Osceola: Fire Incidents, Arkansas (AR)
Where are fire incidents reported in Osceola, AR
Something went wrong! Please refresh the page.
| Fire incidents reported | |
|---|---|
| Sreet name | Count |
| KEISER AVE | 80 |
| KEISER | 76 |
| PEARL | 76 |
| SEMMES | 68 |
| WALNUT | 64 |
| WASHINGTON | 62 |
| BROADWAY | 44 |
| HALE | 42 |
| INTERSTATE 55 | 42 |
| BARD | 40 |
| PEARL ST | 38 |
| FORD | 30 |
| HALE AVE | 30 |
| ELIZABETH | 28 |
| QUINN | 28 |
| JOHNSON | 26 |
| ELM | 24 |
| UNION | 22 |
| HWY 61 | 20 |
| I55 | 20 |
| CHILDRESS | 18 |
| DONALDSON | 18 |
| SEMINOLE DR | 18 |
| SEMMES AVE | 18 |
| SHIRLEY DR | 18 |
| MAPLE | 16 |
| PARKWAY | 16 |
| PECAN ST | 16 |
| POPLAR | 16 |
| ALICIA | 14 |
| Other | 318 |
2002 - 2018 National Fire Incident Reporting System (NFIRS) incidents
- Incident types reported to NFIRS in Osceola, AR
- 1,34668.1%Fire
- 20810.5%Good Intent Call
- 1899.6%Hazardous Condition
- 1135.7%False Alarm
- 623.1%Rescue & EMS
- 522.6%Service Call
- 50.3%Special Incident
- 20.1%Overpressure Rupture
- Fire incident types reported to NFIRS in Osceola, AR
- 66749.6%Structure Fires
- 38628.7%Outside Fires
- 25118.6%Mobile Property/Vehicle Fires
- 423.1%Other
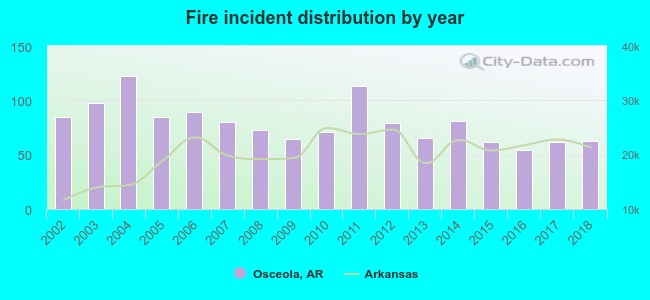 Based on the data from the years 2002 - 2018 the average number of fires per year is 79. The highest number of reported fires - 122 took place in 2004, and the least - 54 in 2016. The data has a decreasing trend.
The average number of yearly fire incidents per 10k residents in Osceola, AR compared to nearest cities:
(Note: Based on data for the last 3 years, including only cities with population 5,000 and above)
| Osceola: | 81.5 |
| Blytheville: | 126.8 |
| Trumann: | 173.6 |
| Marion: | 83.3 |
| Paragould: | 93.7 |
| West Memphis: | 88.5 |
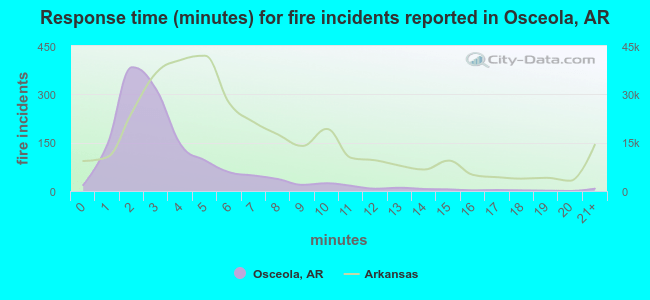 The median response time based on all reported fire incidents is 3 minutes. This is much lower compared to the Arkansas median value.
The median response time in Osceola, AR compared to nearest cities:
(Note: Based on data for all years, including only cities with at least 500 fire incidents)
| Osceola: | 3 minutes |
| Blytheville: | 4 minutes |
| Marked Tree: | 6 minutes |
| Trumann: | 3 minutes |
| Marion: | 7 minutes |
| Paragould: | 4 minutes |
| West Memphis: | 5 minutes |
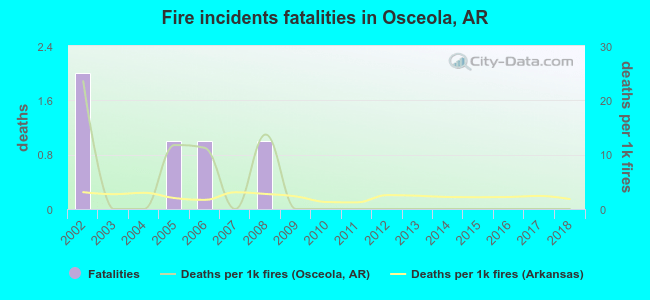 According to the reports from the years 2002 - 2018 the average number of fire-related fatalities per year is 0. The highest number of reported deaths - 2 took place in 2002, and the lowest - 0 in 2003. The data has a dropping trend.
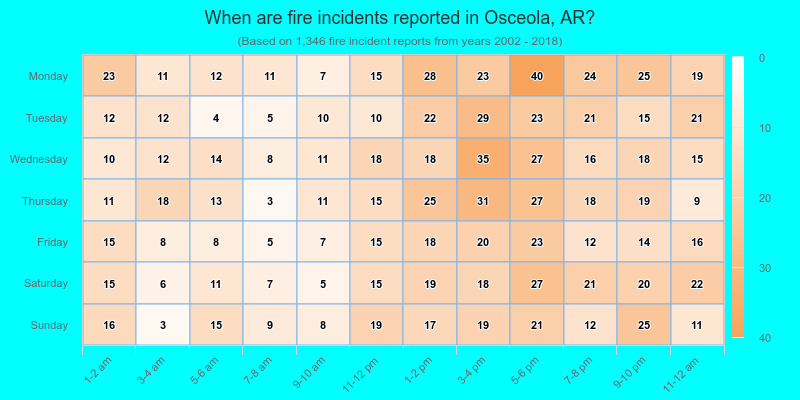
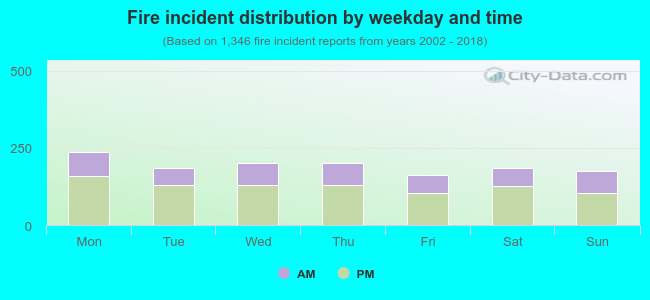 34.4% incidents where reported in the morning and 65.6% in the evening. The most fires (17.7%) took place on Monday, and the least (12.0%) on Friday.
 Based on the 1,346 fires from years 2002 - 2018 most fires (10.8%) took place during July, and the least (6.7%) in May.
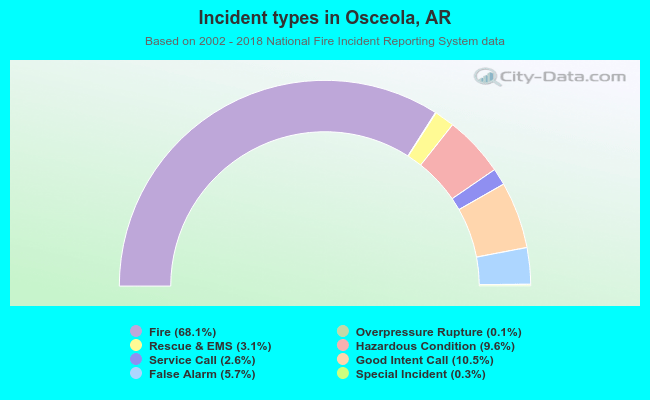 Out of all 1,977 cases reported during the years 2002 - 2018, the most belonged to the categories: Fire (68.1%), Good Intent Call (10.5%), and Hazardous Condition (9.6%).
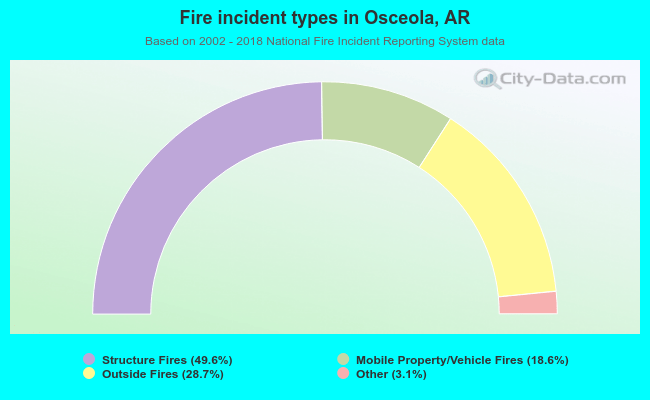 When looking into fire subcategories, the most incidents belonged to: Structure Fires (49.6%), and Outside Fires (28.7%).