Rye: Fire Incidents, New Hampshire (NH)
Where are fire incidents reported in Rye, NH
Something went wrong! Please refresh the page.
|
| |||||||||||||||||||||||||||||||||||||||||||||||||||||||||||||||||||||||||||||||||||||||||||||||||||||||||||||
2006 - 2018 National Fire Incident Reporting System (NFIRS) incidents
- Incident types reported to NFIRS in Rye, NH
- 2,16751.0%Rescue & EMS
- 62814.8%Hazardous Condition
- 54512.8%Service Call
- 47011.1%False Alarm
- 3047.2%Fire
- 1182.8%Good Intent Call
- 70.2%Overpressure Rupture
- 60.1%Severe Weather
- Fire incident types reported to NFIRS in Rye, NH
- 17457.2%Structure Fires
- 9129.9%Outside Fires
- 237.6%Mobile Property/Vehicle Fires
- 165.3%Other
 According to the data from the years 2006 - 2018 the average number of fire incidents per year is 23. The highest number of reported fire incidents - 34 took place in 2007, and the least - 16 in 2012. The data has a decreasing trend.
The average number of yearly fire incidents per 10k residents in Rye, NH compared to nearest cities:
(Note: Based on data for the last 3 years, including only cities with population 5,000 and above)
| Rye: | 37.8 |
| Portsmouth: | 34.1 |
| Hampton: | 65.2 |
| Stratham: | 53.3 |
| Seabrook: | 62.1 |
| Exeter: | 59.2 |
| Newmarket: | 32.1 |
| Durham: | 42.2 |
| Dover: | 27.6 |

 30.6% incidents where reported in the morning and 69.4% in the evening. The most fires (17.1%) took place on Saturday, and the least (9.9%) on Friday.
 Based on the 304 fire incident reports from years 2006 - 2018 most fires (11.5%) took place during March, and the least (4.6%) in August.
 Out of all 4,246 cases reported during the years 2006 - 2018, the most belonged to the categories: Rescue & EMS (51.0%), Hazardous Condition (14.8%), and Service Call (12.8%).
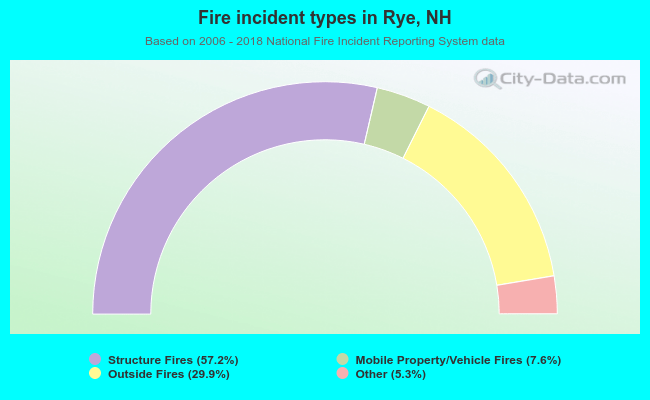 When looking into fire subcategories, the most reports belonged to: Structure Fires (57.2%), and Outside Fires (29.9%).