Dover: Fire Incidents, New Hampshire (NH)
Where are fire incidents reported in Dover, NH
Something went wrong! Please refresh the page.
| Fire incidents reported | |
|---|---|
| Sreet name | Count |
| CENTRAL AVE | 164 |
| BROADWAY | 50 |
| MUTUAL AID GIVEN | 48 |
| NEW ROCHESTER RD | 36 |
| CHESTNUT ST | 34 |
| SPAULDING TPKE | 32 |
| WASHINGTON ST | 30 |
| PORTLAND AVE | 26 |
| DOVER POINT RD | 24 |
| LOCUST ST | 24 |
| BELKNAP ST | 20 |
| THIRD ST | 20 |
| NEW YORK ST | 18 |
| PLAZA DR | 18 |
| PARK ST | 16 |
| COUNTY FARM RD | 14 |
| OAK ST | 14 |
| SECOND ST | 14 |
| TOLEND RD | 14 |
| GROVE ST | 12 |
| GULF RD | 12 |
| HENRY LAW AVE | 12 |
| INDIAN BROOK DR | 12 |
| KNOX MARSH RD | 12 |
| MARTHAS WAY | 12 |
| SIXTH ST | 12 |
| ADDISON PL | 10 |
| ADELLE DR | 10 |
| LITTLEWORTH RD | 10 |
| OLD ENGLISH VILLAGE RD | 10 |
| Other | 9 |
2003 - 2018 National Fire Incident Reporting System (NFIRS) incidents
- Incident types reported to NFIRS in Dover, NH
- 10,34152.9%Rescue & EMS
- 3,76319.3%Service Call
- 1,8719.6%Hazardous Condition
- 1,8619.5%False Alarm
- 9084.6%Good Intent Call
- 7493.8%Fire
- 210.1%Special Incident
- Fire incident types reported to NFIRS in Dover, NH
- 40053.4%Structure Fires
- 23531.4%Outside Fires
- 678.9%Mobile Property/Vehicle Fires
- 476.3%Other
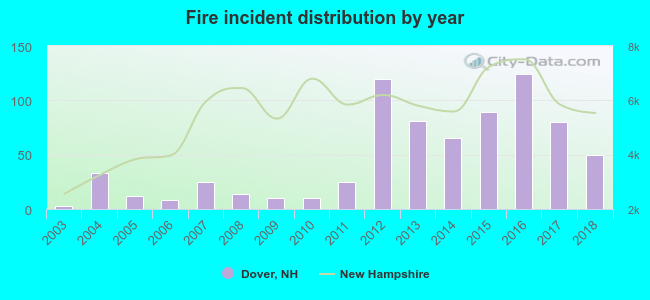 According to the data from the years 2003 - 2018 the average number of fire incidents per year is 47. The highest number of fire incidents - 124 took place in 2016, and the least - 3 in 2003. The data has a rising trend.
The average number of yearly fire incidents per 10k residents in Dover, NH compared to nearest cities:
(Note: Based on data for the last 3 years, including only cities with population 5,000 and above)
| Dover: | 27.6 |
| Durham: | 42.2 |
| Somersworth: | 36.5 |
| Barrington: | 30.3 |
| Newmarket: | 32.1 |
| Rochester: | 24.6 |
| Portsmouth: | 34.1 |
| Stratham: | 53.3 |
| Rye: | 37.8 |
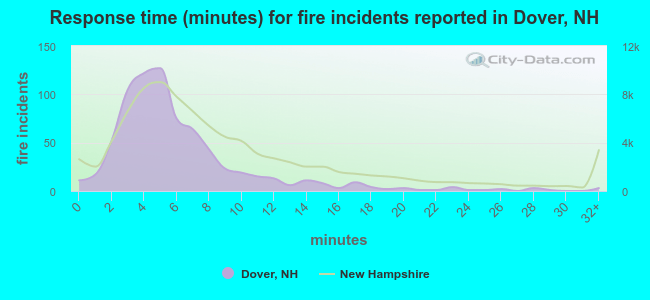 The median response time based on all reported fire incidents is 5 minutes. This is lower than the New Hampshire median value.
The median response time in Dover, NH compared to nearest cities:
(Note: Based on data for all years, including only cities with at least 500 fire incidents)
| Dover: | 5 minutes |
| Durham: | 4 minutes |
| Somersworth: | 4 minutes |
| Rochester: | 5 minutes |
| Portsmouth: | 6 minutes |
| Epping: | 9 minutes |
| Exeter: | 6 minutes |
| Wells: | 7 minutes |
| Farmington: | 7 minutes |
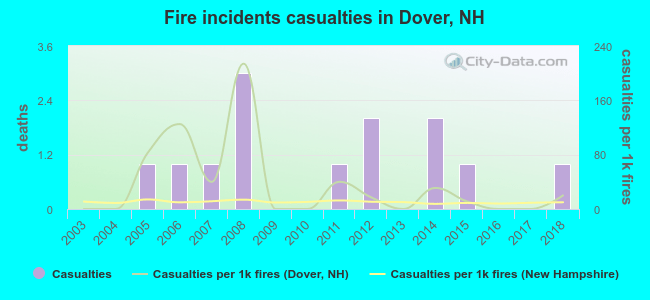 According to the reports from the years 2003 - 2018 the average number of fire-related casualties per year is 1. The highest number of casualties - 3 took place in 2008, and the lowest - 0 in 2003. The data has an increasing trend.
The average number of injuries per 1,000 fire incidents is 36. This indicator was the highest - 214 in 2008, and the lowest 0 in 2003. The trend for casualties per 1,000 fire incidents is increasing. Compared to the New Hampshire value the number of casualties per 1,000 incidents is higher.
According to the reports from the years 2003 - 2018 the average number of fire-related casualties per year is 1. The highest number of casualties - 3 took place in 2008, and the lowest - 0 in 2003. The data has an increasing trend.
The average number of injuries per 1,000 fire incidents is 36. This indicator was the highest - 214 in 2008, and the lowest 0 in 2003. The trend for casualties per 1,000 fire incidents is increasing. Compared to the New Hampshire value the number of casualties per 1,000 incidents is higher.Casualties per 1,000 incidents in Dover, NH compared to nearest cities:
(Note: Based on data for all years, including only cities with at least 500 fire incidents)
| Dover: | 17.4 |
| Durham: | 8.4 |
| Somersworth: | 3.9 |
| Rochester: | 20.5 |
| Portsmouth: | 12.7 |
| Epping: | 11.9 |
| Exeter: | 2.3 |
| Wells: | 14.2 |
| Farmington: | 1.2 |
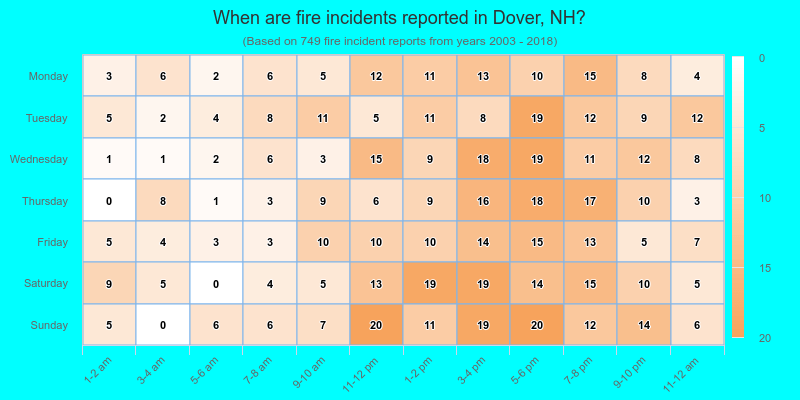
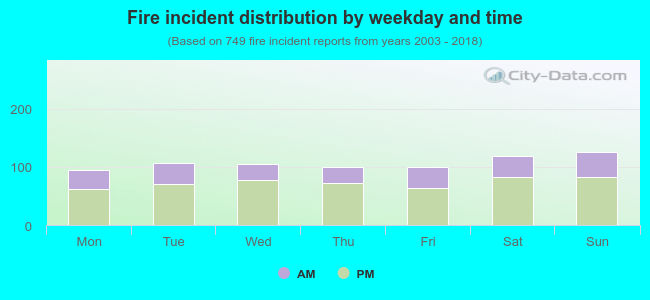 31.9% incidents where reported in the morning and 68.1% in the evening. The most fires (16.8%) took place on Sunday, and the least (12.7%) on Monday.
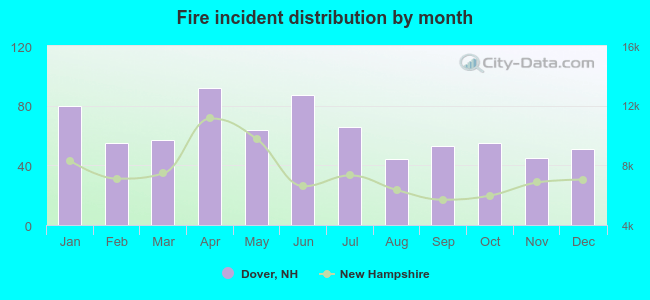 According to the 749 fire incident reports from years 2003 - 2018 most fires (12.3%) took place during April, and the least (5.9%) in August.
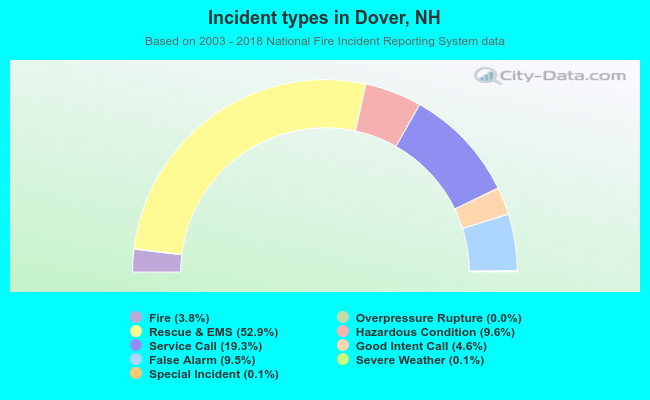 Out of all 19,531 cases reported during the years 2003 - 2018, the most belonged to the categories: Rescue & EMS (52.9%), Service Call (19.3%), and Hazardous Condition (9.6%).
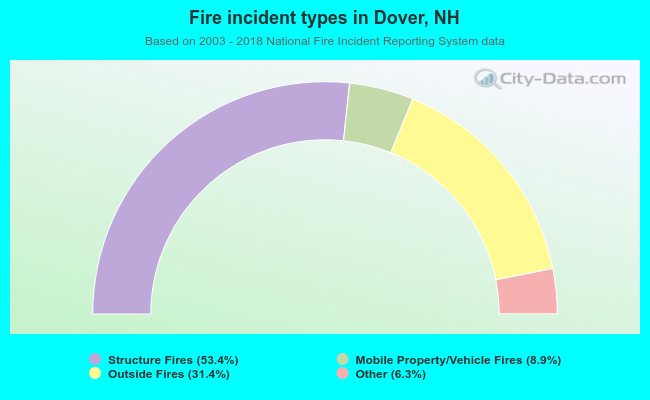 When looking into fire subcategories, the most reports belonged to: Structure Fires (53.4%), and Outside Fires (31.4%).