Farmington: Fire Incidents, New Hampshire (NH)
Where are fire incidents reported in Farmington, NH
Something went wrong! Please refresh the page.
| Fire incidents reported | |
|---|---|
| Sreet name | Count |
| RT 11 HWY | 116 |
| TEN ROD RD | 96 |
| MAIN ST | 72 |
| MEADERBORO RD | 52 |
| ELM ST | 48 |
| SPRING ST | 48 |
| HORNETOWN RD | 38 |
| CENTRAL ST | 36 |
| CHESTNUT HILL RD | 28 |
| CHARLES ST | 26 |
| CHESTNUT HILL RD | 24 |
| PAULSON RD | 22 |
| GLEN ST | 20 |
| ORANGE ST | 20 |
| ROUTE 11 | 20 |
| SCHOOL ST | 20 |
| WATER ST | 20 |
| RT 11 | 18 |
| UNION ST | 18 |
| WALDRON CROSS RD | 16 |
| BAY RD | 14 |
| CAMELOT SHORES ST | 14 |
| MEADERBORO ROAD | 14 |
| MECHANIC ST | 14 |
| RIDGE RD | 14 |
| BRANSON RD | 12 |
| BUNKER ST | 12 |
| GOVERNORS RD | 12 |
| GROVE ST | 12 |
| HANCOCK ST | 12 |
2005 - 2018 National Fire Incident Reporting System (NFIRS) incidents
- Incident types reported to NFIRS in Farmington, NH
- 2,84352.4%Rescue & EMS
- 82815.3%Fire
- 75413.9%Hazardous Condition
- 4147.6%Service Call
- 2975.5%Good Intent Call
- 2604.8%False Alarm
- 160.3%Special Incident
- 90.2%Severe Weather
- Fire incident types reported to NFIRS in Farmington, NH
- 44253.4%Outside Fires
- 30036.2%Structure Fires
- 556.6%Mobile Property/Vehicle Fires
- 313.7%Other
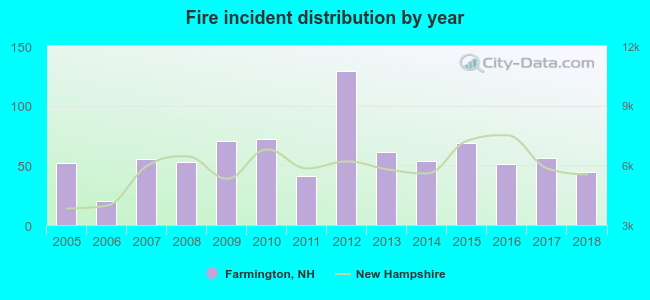 Based on the data from the years 2005 - 2018 the average number of fires per year is 59. The highest number of reported fires - 129 took place in 2012, and the least - 20 in 2006. The data has a dropping trend.
 The median response time based on all reported fire incidents is 7 minutes. This is close to the New Hampshire median value.
The median response time in Farmington, NH compared to nearest cities:
(Note: Based on data for all years, including only cities with at least 500 fire incidents)
| Farmington: | 7 minutes |
| Rochester: | 5 minutes |
| Alton: | 14 minutes |
| Somersworth: | 4 minutes |
| Pittsfield: | 10 minutes |
| Wakefield: | 10 minutes |
| Sanford: | 4 minutes |
| Wolfeboro: | 7 minutes |
| Dover: | 5 minutes |
 25.6% incidents where reported in the morning and 74.4% in the evening. The most fires (16.8%) took place on Friday, and the least (11.4%) on Sunday.
 Based on the 828 fire incidents from years 2005 - 2018 most fires (13.0%) took place during April, and the least (4.3%) in October.
 Out of all 5,425 cases reported during the years 2005 - 2018, the most belonged to the categories: Rescue & EMS (52.4%), Fire (15.3%), and Hazardous Condition (13.9%).
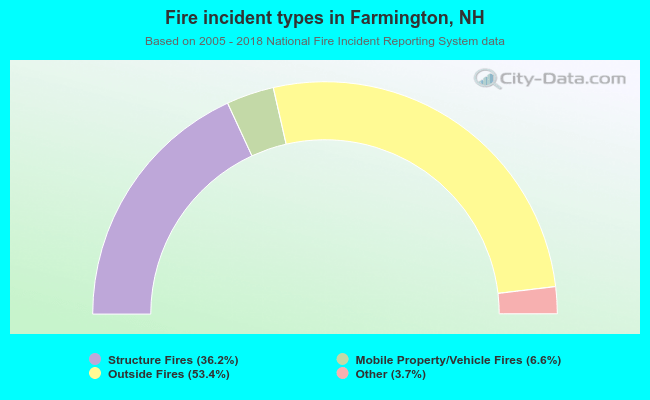 When looking into fire subcategories, the most incidents belonged to: Outside Fires (53.4%), and Structure Fires (36.2%).