Portsmouth: Fire Incidents, New Hampshire (NH)
Where are fire incidents reported in Portsmouth, NH
Something went wrong! Please refresh the page.
| Fire incidents reported | |
|---|---|
| Sreet name | Count |
| LAFAYETTE RD | 288 |
| WOODBURY AVE | 122 |
| ISLINGTON ST | 64 |
| BORTHWICK AVE | 60 |
| STATE ST | 52 |
| MARKET ST | 36 |
| MIDDLE ST | 30 |
| COURT ST | 28 |
| MUTUAL AID GIVEN | 28 |
| SAGAMORE AVE | 28 |
| HANOVER ST | 26 |
| I-95 NB | 26 |
| MAPLEWOOD AVE | 26 |
| CONGRESS ST | 24 |
| GOSLING RD | 24 |
| GREENLAND RD | 24 |
| ANDREW JARVIS DR | 22 |
| CORPORATE DR | 22 |
| FREEDOM CIR | 22 |
| BEECHSTONE | 20 |
| INTERNATIONAL DR | 20 |
| LEDGEWOOD DR | 20 |
| PEASE | 20 |
| COMMERCE WAY | 18 |
| ELWYN RD | 18 |
| PEVERLY HILL RD | 18 |
| BOW ST | 16 |
| BANFIELD RD | 14 |
| HERITAGE AVE | 14 |
| I95 SB | 14 |
2006 - 2018 National Fire Incident Reporting System (NFIRS) incidents
- Incident types reported to NFIRS in Portsmouth, NH
- 6,19645.0%Rescue & EMS
- 2,32716.9%Hazardous Condition
- 2,30316.7%False Alarm
- 1,0237.4%Fire
- 9446.8%Good Intent Call
- 9086.6%Service Call
- 390.3%Severe Weather
- 330.2%Special Incident
- Fire incident types reported to NFIRS in Portsmouth, NH
- 42541.5%Structure Fires
- 40639.7%Outside Fires
- 13513.2%Mobile Property/Vehicle Fires
- 575.6%Other
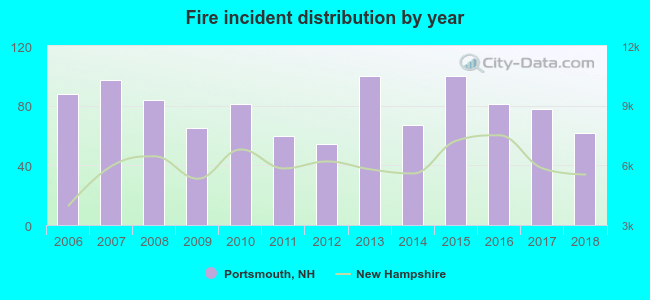 Based on the data from the years 2006 - 2018 the average number of fire incidents per year is 78. The highest number of reported fire incidents - 100 took place in 2013, and the least - 54 in 2012. The data has a declining trend.
The average number of yearly fire incidents per 10k residents in Portsmouth, NH compared to nearest cities:
(Note: Based on data for the last 3 years, including only cities with population 5,000 and above)
| Portsmouth: | 34.1 |
| Rye: | 37.8 |
| Stratham: | 53.3 |
| Newmarket: | 32.1 |
| Hampton: | 65.2 |
| Durham: | 42.2 |
| Dover: | 27.6 |
| Exeter: | 59.2 |
| Seabrook: | 62.1 |
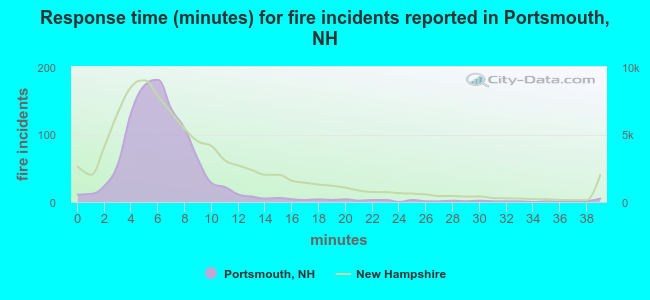 The median response time based on all reported fire incidents is 6 minutes. This is similar to the New Hampshire median value.
The median response time in Portsmouth, NH compared to nearest cities:
(Note: Based on data for all years, including only cities with at least 500 fire incidents)
| Portsmouth: | 6 minutes |
| Hampton: | 5 minutes |
| Durham: | 4 minutes |
| Dover: | 5 minutes |
| Exeter: | 6 minutes |
| Somersworth: | 4 minutes |
| Epping: | 9 minutes |
| Salisbury: | 4 minutes |
| Amesbury: | 5 minutes |
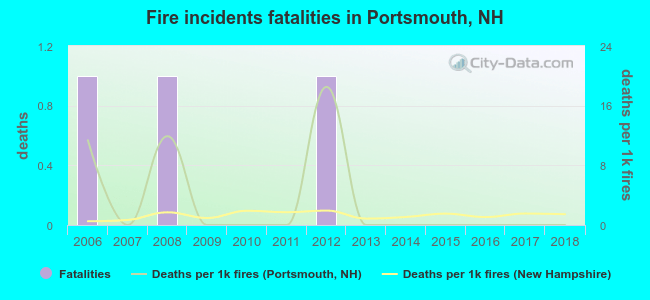 According to the reports from the years 2006 - 2018 the average number of fire-related fatalities per year is 0. The highest number of deaths - 1 took place in 2006, and the lowest - 0 in 2007. The data has a decreasing trend.
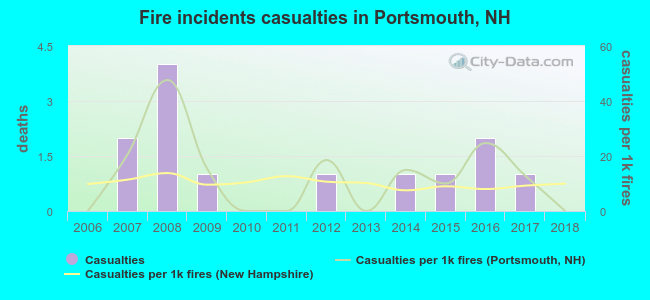 Based on the data from the years 2006 - 2018 the average number of fire-related yearly casualties is 1. The highest number of reported injuries - 4 took place in 2008, and the lowest - 0 in 2006. The data has a constant trend.
The average number of injuries per 1,000 fires is 13. This indicator was the highest - 48 in 2008, and the lowest 0 in 2006. The trend for injuries per 1,000 fire incidents is constant. Compared to the New Hampshire value the number of casualties per 1,000 incidents is higher.
Based on the data from the years 2006 - 2018 the average number of fire-related yearly casualties is 1. The highest number of reported injuries - 4 took place in 2008, and the lowest - 0 in 2006. The data has a constant trend.
The average number of injuries per 1,000 fires is 13. This indicator was the highest - 48 in 2008, and the lowest 0 in 2006. The trend for injuries per 1,000 fire incidents is constant. Compared to the New Hampshire value the number of casualties per 1,000 incidents is higher.
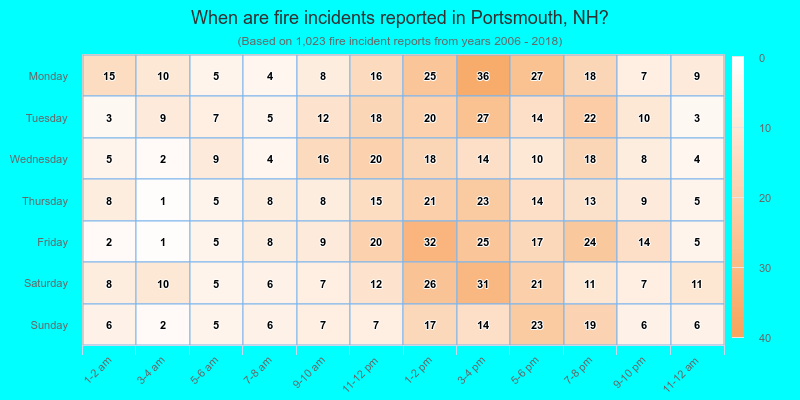
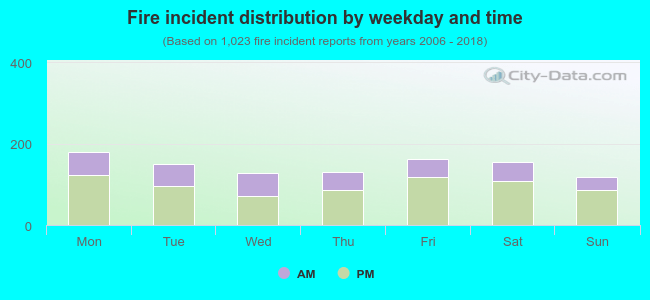 33.1% incidents where reported in the morning and 66.9% in the evening. The most fires (17.6%) took place on Monday, and the least (11.5%) on Sunday.
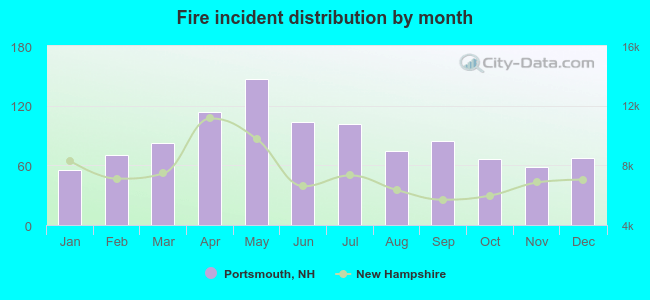 According to the 1,023 fire incidents from years 2006 - 2018 most fires (14.4%) took place during May, and the least (5.4%) in January.
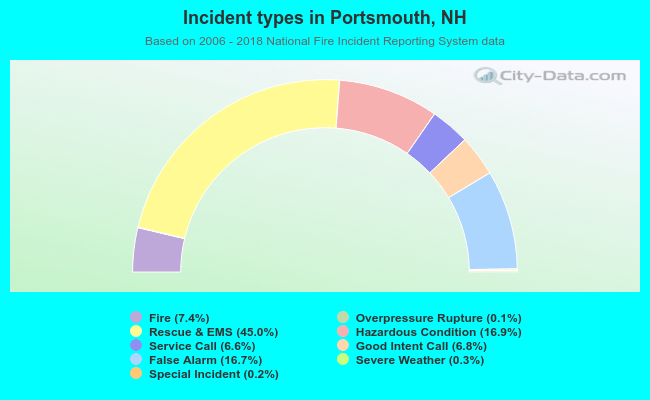 Out of all 13,782 cases reported during the years 2006 - 2018, the most belonged to the categories: Rescue & EMS (45.0%), Hazardous Condition (16.9%), and False Alarm (16.7%).
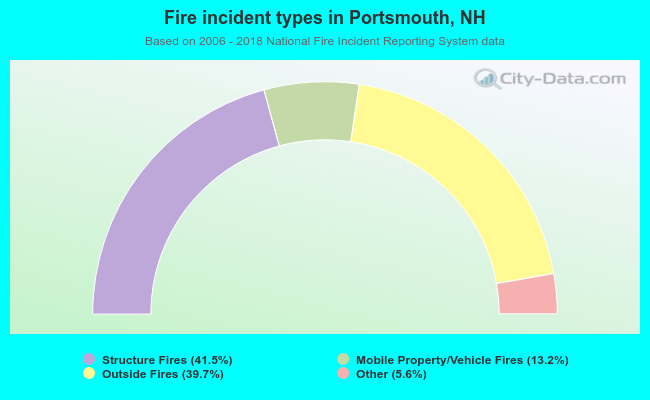 When looking into fire subcategories, the most reports belonged to: Structure Fires (41.5%), and Outside Fires (39.7%).