Poway: Fire Incidents, California (CA)
Where are fire incidents reported in Poway, CA
Something went wrong! Please refresh the page.
|
| |||||||||||||||||||||||||||||||||||||||||||||||||||||||||||||||||||||||||||||||||||||||||||||||||||||||||||||
2005 - 2018 National Fire Incident Reporting System (NFIRS) incidents
- Incident types reported to NFIRS in Poway, CA
- 8,52870.0%Rescue & EMS
- 1,28210.5%Good Intent Call
- 8156.7%Service Call
- 7906.5%False Alarm
- 4813.9%Fire
- 2632.2%Hazardous Condition
- 160.1%Special Incident
- Fire incident types reported to NFIRS in Poway, CA
- 17736.8%Structure Fires
- 17336.0%Outside Fires
- 10221.2%Mobile Property/Vehicle Fires
- 296.0%Other
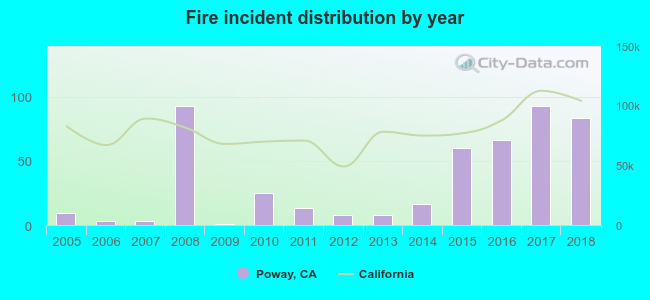 According to the data from the years 2005 - 2018 the average number of fires per year is 34. The highest number of reported fires - 93 took place in 2008, and the least - 1 in 2009. The data has a rising trend.
The average number of yearly fire incidents per 10k residents in Poway, CA compared to nearest cities:
(Note: Based on data for the last 3 years, including only cities with population 5,000 and above)
| Poway: | 16.2 |
| Santee: | 16.9 |
| Ramona: | 24.5 |
| Escondido: | 17.9 |
| Lakeside: | 55.2 |
| El Cajon: | 14.4 |
| Solana Beach: | 36.7 |
| La Mesa: | 6.2 |
| San Marcos: | 15.0 |
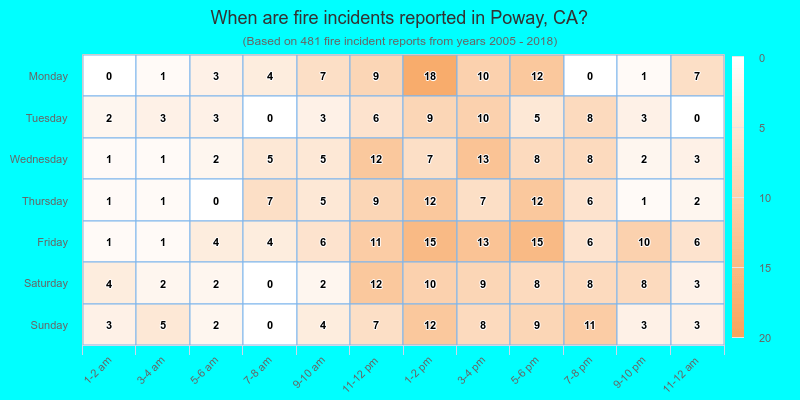
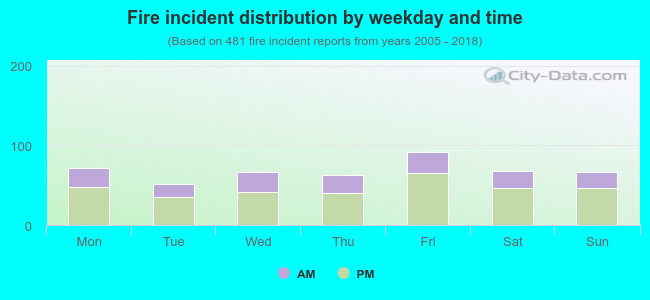 33.3% incidents where reported in the morning and 66.7% in the evening. The most fires (19.1%) took place on Friday, and the least (10.8%) on Tuesday.
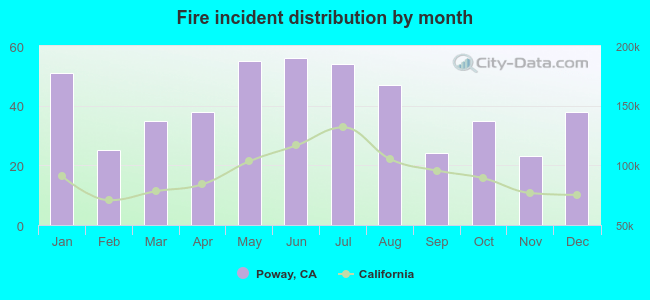 According to the 481 fire incidents from years 2005 - 2018 most fires (11.6%) took place during June, and the least (4.8%) in November.
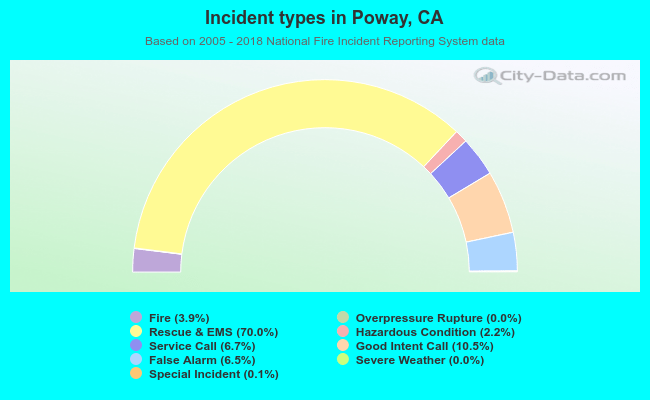 Out of all 12,180 cases reported during the years 2005 - 2018, the most belonged to the categories: Rescue & EMS (70.0%), Good Intent Call (10.5%), and Service Call (6.7%).
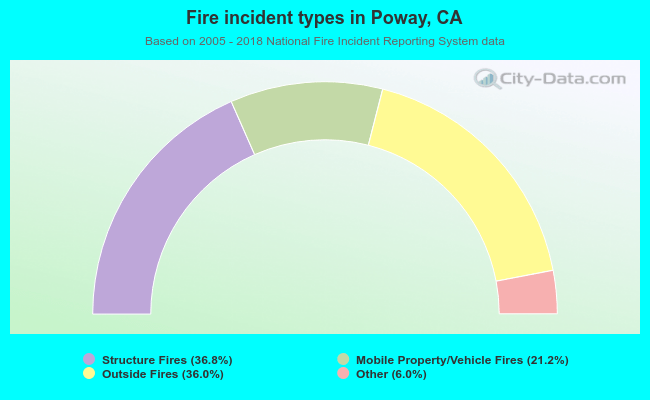 When looking into fire subcategories, the most incidents belonged to: Structure Fires (36.8%), and Outside Fires (36.0%).