Solana Beach: Fire Incidents, California (CA)
Where are fire incidents reported in Solana Beach, CA
Something went wrong! Please refresh the page.
|
| |||||||||||||||||||||||||||||||||||||||||||||||||||||||||||||||||||||||||||||||||||||||||||||||||||||||||||||
2005 - 2017 National Fire Incident Reporting System (NFIRS) incidents
- Incident types reported to NFIRS in Solana Beach, CA
- 2,77159.3%Rescue & EMS
- 71515.3%Good Intent Call
- 3687.9%False Alarm
- 3026.5%Fire
- 2816.0%Service Call
- 2244.8%Hazardous Condition
- 80.2%Severe Weather
- 50.1%Special Incident
- Fire incident types reported to NFIRS in Solana Beach, CA
- 19765.2%Structure Fires
- 5016.6%Mobile Property/Vehicle Fires
- 309.9%Outside Fires
- 258.3%Other
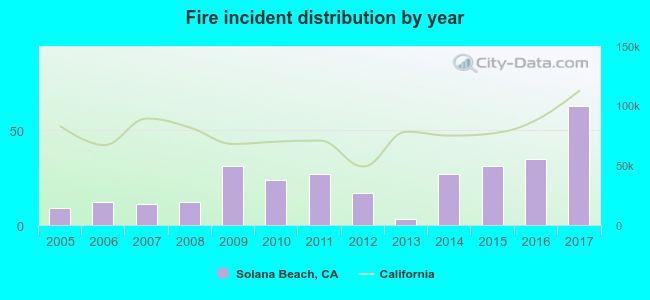 According to the data from the years 2005 - 2017 the average number of fire incidents per year is 23. The highest number of reported fire incidents - 63 took place in 2017, and the least - 3 in 2013. The data has a growing trend.
The average number of yearly fire incidents per 10k residents in Solana Beach, CA compared to nearest cities:
(Note: Based on data for the last 3 years, including only cities with population 5,000 and above)
| Solana Beach: | 36.7 |
| Encinitas: | 12.4 |
| Carlsbad: | 13.8 |
| San Marcos: | 15.0 |
| Poway: | 16.2 |
| Escondido: | 17.9 |
| Vista: | 24.5 |
| Oceanside: | 18.4 |
| San Diego: | 15.0 |
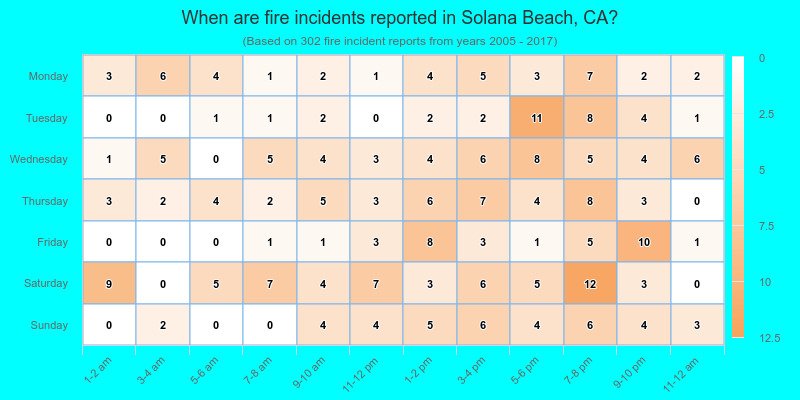
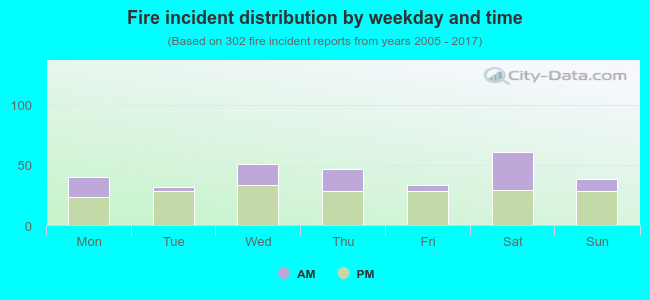 34.8% incidents where reported in the morning and 65.2% in the evening. The most fires (20.2%) took place on Saturday, and the least (10.6%) on Tuesday.
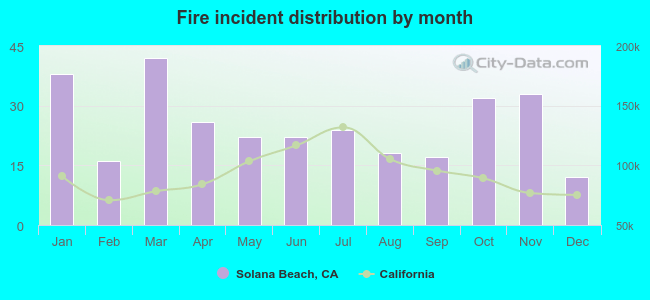 According to the 302 reports from years 2005 - 2017 most fires (13.9%) took place during March, and the least (4.0%) in December.
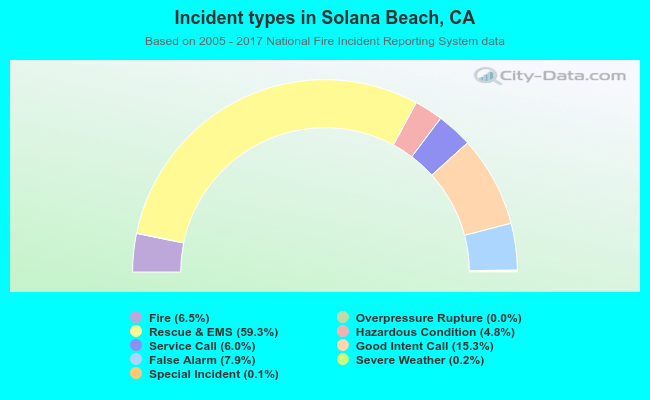 Out of all 4,676 cases reported during the years 2005 - 2017, the most belonged to the categories: Rescue & EMS (59.3%), Good Intent Call (15.3%), and False Alarm (7.9%).
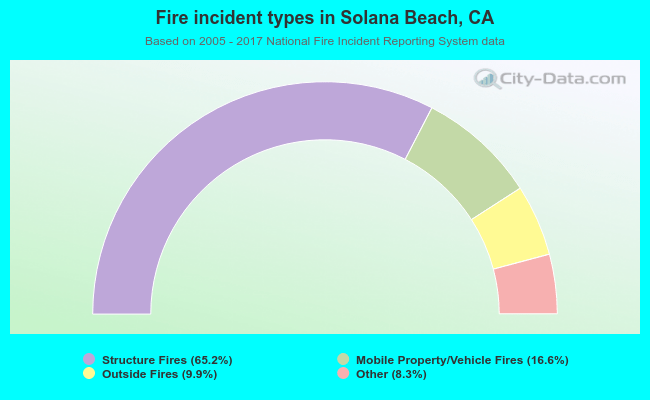 When looking into fire subcategories, the most reports belonged to: Structure Fires (65.2%), and Mobile Property/Vehicle Fires (16.6%).