San Marcos: Fire Incidents, California (CA)
Where are fire incidents reported in San Marcos, CA
Something went wrong! Please refresh the page.
| Fire incidents reported | |
|---|---|
| Sreet name | Count |
| TWIN OAKS VALLEY RD | 188 |
| RANCHO SANTA FE RD | 164 |
| SAN MARCOS BLVD | 160 |
| MISSION RD | 134 |
| 78 HWY | 70 |
| BARHAM DR | 70 |
| LINDA VISTA DR | 64 |
| WOODLAND PKY | 60 |
| AUTUMN DR | 54 |
| SMILAX RD | 54 |
| LAS POSAS RD | 50 |
| SAN ELIJO RD | 50 |
| SAN MARCOS BL | 44 |
| CENTER DR | 42 |
| RANCHEROS DR | 40 |
| GRAND AVE | 38 |
| TRAVELERS WAY | 38 |
| GRANDON AVE | 36 |
| LAS FLORES DR | 36 |
| SANTA FE AVE | 36 |
| BORDEN RD | 32 |
| RICHLAND RD | 32 |
| RICHMAR AVE | 32 |
| CRAVEN RD | 28 |
| DESCANSO AVE | 28 |
| DISCOVERY ST | 26 |
| KNOLL RD | 26 |
| SR78 HWY | 26 |
| NORDAHL RD | 24 |
| ROCK SPRINGS RD | 24 |
| Other | 235 |
2005 - 2018 National Fire Incident Reporting System (NFIRS) incidents
- Incident types reported to NFIRS in San Marcos, CA
- 27,79864.8%Rescue & EMS
- 5,16512.0%Good Intent Call
- 3,2787.6%Service Call
- 3,2747.6%Hazardous Condition
- 1,9414.5%Fire
- 1,3723.2%False Alarm
- Fire incident types reported to NFIRS in San Marcos, CA
- 78540.4%Structure Fires
- 63732.8%Outside Fires
- 45523.4%Mobile Property/Vehicle Fires
- 643.3%Other
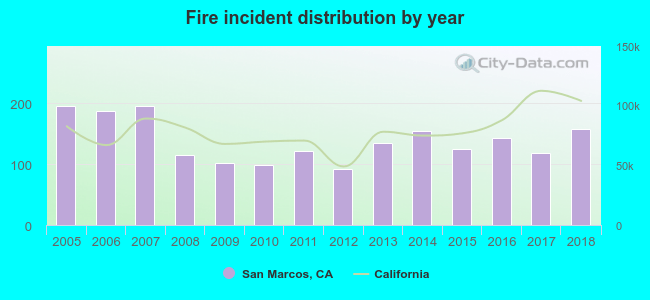 According to the data from the years 2005 - 2018 the average number of fire incidents per year is 139. The highest number of fires - 196 took place in 2005, and the least - 92 in 2012. The data has a declining trend.
The average number of yearly fire incidents per 10k residents in San Marcos, CA compared to nearest cities:
(Note: Based on data for the last 3 years, including only cities with population 5,000 and above)
| San Marcos: | 15.0 |
| Escondido: | 17.9 |
| Vista: | 24.5 |
| Carlsbad: | 13.8 |
| Encinitas: | 12.4 |
| Oceanside: | 18.4 |
| Valley Center: | 73.3 |
| Solana Beach: | 36.7 |
| Poway: | 16.2 |
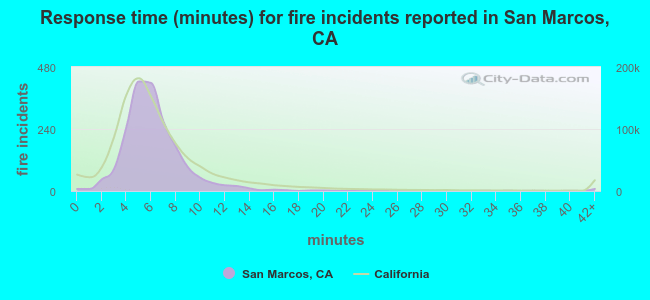 The median response time based on all reported fire incidents is 6 minutes. This is close to the state median value.
The median response time in San Marcos, CA compared to nearest cities:
(Note: Based on data for all years, including only cities with at least 500 fire incidents)
| San Marcos: | 6 minutes |
| Escondido: | 6 minutes |
| Vista: | 6 minutes |
| Carlsbad: | 6 minutes |
| Rancho Santa Fe: | 6 minutes |
| Encinitas: | 5 minutes |
| Oceanside: | 6 minutes |
| Fallbrook: | 10 minutes |
| Ramona: | 5 minutes |
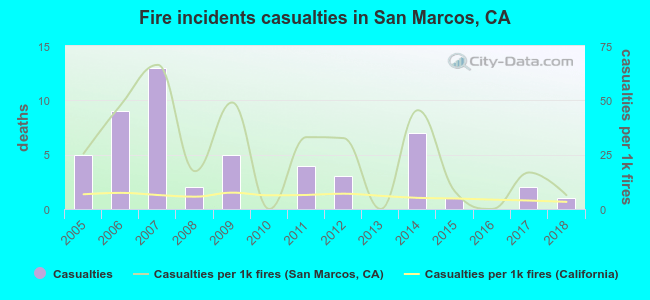 Based on the reports from the years 2005 - 2018 the average number of fire-related yearly casualties is 4. The highest number of injuries - 13 took place in 2007, and the lowest - 0 in 2010. The data has a decreasing trend.
The average number of casualties per 1,000 fires is 25. This indicator was the highest - 66 in 2007, and the lowest 0 in 2010. The trend for casualties per 1,000 incidents is dropping. Compared to the California value the number of injuries per 1,000 fires is much higher.
Based on the reports from the years 2005 - 2018 the average number of fire-related yearly casualties is 4. The highest number of injuries - 13 took place in 2007, and the lowest - 0 in 2010. The data has a decreasing trend.
The average number of casualties per 1,000 fires is 25. This indicator was the highest - 66 in 2007, and the lowest 0 in 2010. The trend for casualties per 1,000 incidents is dropping. Compared to the California value the number of injuries per 1,000 fires is much higher.
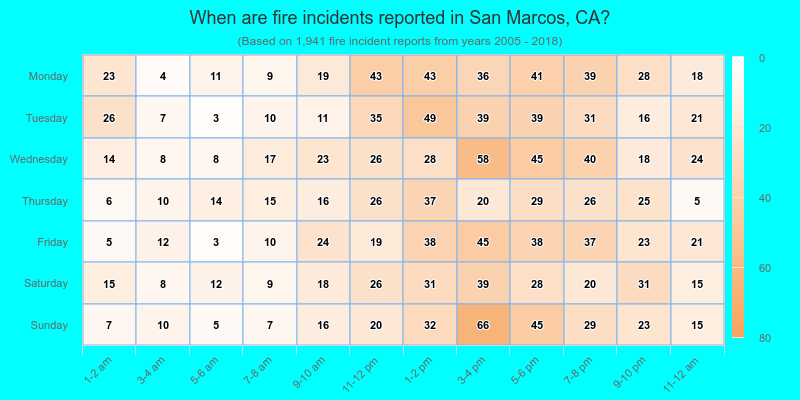
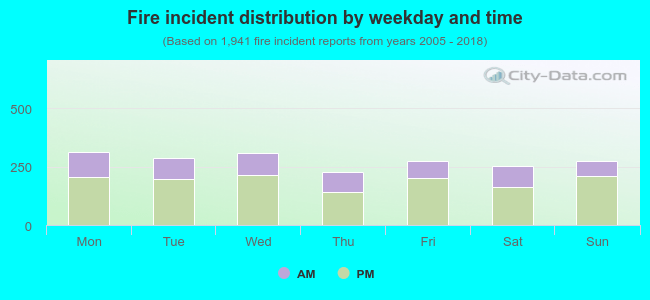 31.4% incidents where reported in the morning and 68.6% in the evening. The most fires (16.2%) took place on Monday, and the least (11.8%) on Thursday.
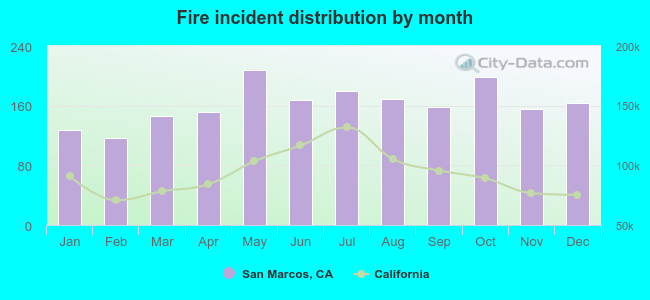 Based on the 1,941 reports from years 2005 - 2018 most fires (10.7%) took place during May, and the least (6.0%) in February.
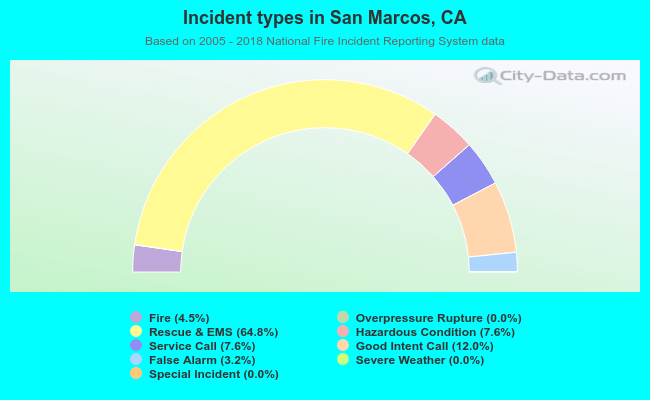 Out of all 42,875 cases reported during the years 2005 - 2018, the most belonged to the categories: Rescue & EMS (64.8%), Good Intent Call (12.0%), and Service Call (7.6%).
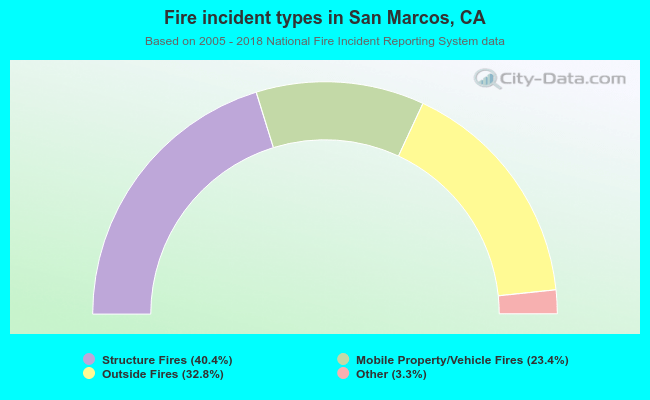 When looking into fire subcategories, the most incidents belonged to: Structure Fires (40.4%), and Outside Fires (32.8%).