El Cajon: Fire Incidents, California (CA)
Where are fire incidents reported in El Cajon, CA
Something went wrong! Please refresh the page.
| Fire incidents reported | |
|---|---|
| Sreet name | Count |
| MAIN ST | 234 |
| CASINO WAY | 114 |
| JAMACHA RD | 114 |
| DEHESA RD | 92 |
| MOLLISON AVE | 88 |
| BROADWAY | 82 |
| I8 EB | 82 |
| GREENFIELD DR | 66 |
| MAGNOLIA AVE | 66 |
| I8 WB | 62 |
| ANZA ST | 60 |
| CHASE AVE | 58 |
| FLETCHER PARKWAY | 50 |
| LEXINGTON AVE | 44 |
| WASHINGTON AVE | 42 |
| BALLANTYNE ST | 40 |
| MOLLISON AV | 40 |
| BRADLEY AVE | 38 |
| MADISON AVE | 38 |
| FIRST ST | 36 |
| CUYAMACA ST | 32 |
| LESLIE RD | 32 |
| LINCOLN AVE | 32 |
| PETREE ST | 30 |
| SECOND ST | 30 |
| BRADLEY | 28 |
| HARBISON CANYON RD | 28 |
| MAGNOLIA AV | 28 |
| SYCUAN RD | 28 |
| 2ND ST | 26 |
| Other | 589 |
2005 - 2018 National Fire Incident Reporting System (NFIRS) incidents
- Incident types reported to NFIRS in El Cajon, CA
- 28,16367.1%Rescue & EMS
- 7,97919.0%Good Intent Call
- 2,3295.5%Fire
- 1,7734.2%Service Call
- 9722.3%Hazardous Condition
- 7061.7%False Alarm
- Fire incident types reported to NFIRS in El Cajon, CA
- 90738.9%Outside Fires
- 81435.0%Structure Fires
- 37115.9%Mobile Property/Vehicle Fires
- 23710.2%Other
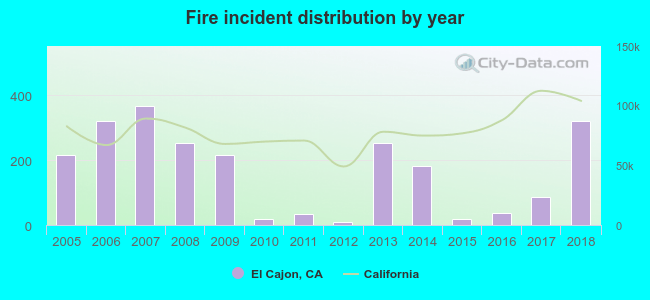 According to the data from the years 2005 - 2018 the average number of fires per year is 166. The highest number of reported fires - 368 took place in 2007, and the least - 8 in 2012. The data has an increasing trend.
The average number of yearly fire incidents per 10k residents in El Cajon, CA compared to nearest cities:
(Note: Based on data for the last 3 years, including only cities with population 5,000 and above)
| El Cajon: | 14.4 |
| Santee: | 16.9 |
| La Mesa: | 6.2 |
| Spring Valley: | 11.8 |
| Lakeside: | 55.2 |
| Lemon Grove: | 8.2 |
| Jamul: | 33.0 |
| Bonita: | 16.7 |
| San Diego: | 15.0 |
 The median response time based on all reported fire incidents is 6 minutes. This is about the same as the state median value.
The median response time in El Cajon, CA compared to nearest cities:
(Note: Based on data for all years, including only cities with at least 500 fire incidents)
| El Cajon: | 6 minutes |
| Santee: | 7 minutes |
| La Mesa: | 6 minutes |
| Lakeside: | 8 minutes |
| San Diego: | 6 minutes |
| Alpine: | 9 minutes |
| National City: | 6 minutes |
| Chula Vista: | 6 minutes |
| Ramona: | 5 minutes |
 33.8% incidents where reported in the morning and 66.2% in the evening. The most fires (15.7%) took place on Sunday, and the least (13.2%) on Friday.
 According to the 2,329 fires from years 2005 - 2018 most fires (11.1%) took place during May, and the least (6.5%) in February.
 Out of all 41,966 cases reported during the years 2005 - 2018, the most belonged to the categories: Rescue & EMS (67.1%), Good Intent Call (19.0%), and Fire (5.5%).
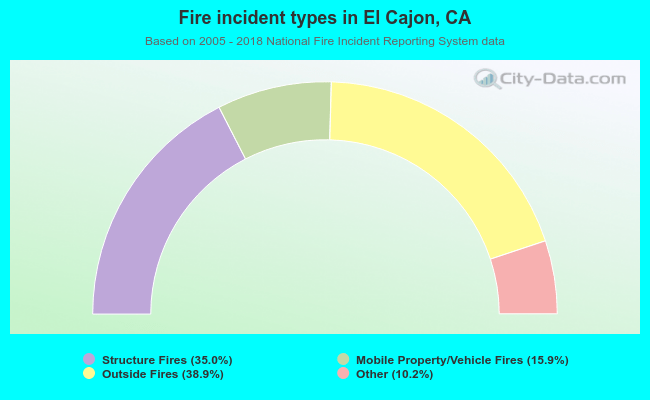 When looking into fire subcategories, the most incidents belonged to: Outside Fires (38.9%), and Structure Fires (35.0%).