National City: Fire Incidents, California (CA)
Where are fire incidents reported in National City, CA
Something went wrong! Please refresh the page.
| Fire incidents reported | |
|---|---|
| Sreet name | Count |
| PLAZA BONITA RD | 166 |
| 18TH ST | 88 |
| PLAZA BLVD | 84 |
| SWEETWATER RD | 84 |
| HIGHLAND AVE | 70 |
| PLAZA | 66 |
| 8TH ST | 62 |
| I805 NB | 60 |
| 16TH ST | 58 |
| 24TH ST | 58 |
| I805 SB | 52 |
| HIGHLAND | 50 |
| 08TH ST | 44 |
| D AVE | 42 |
| DIVISION ST | 38 |
| NATIONAL CITY BLVD | 38 |
| 22ND ST | 36 |
| I5 NB | 36 |
| 04TH ST | 34 |
| HARBISON AVE | 32 |
| PALM AVE | 32 |
| D | 30 |
| RIDGEWAY DR | 30 |
| PLAZA BL | 28 |
| SR54 EB | 28 |
| 4TH ST | 26 |
| HIGHLAND AV | 26 |
| 26TH ST | 24 |
| B AVE | 24 |
| I5 SB | 24 |
| Other | 103 |
2005 - 2018 National Fire Incident Reporting System (NFIRS) incidents
- Incident types reported to NFIRS in National City, CA
- 19,12067.1%Rescue & EMS
- 5,93120.8%Good Intent Call
- 1,5735.5%Fire
- 7072.5%False Alarm
- 6072.1%Service Call
- 5131.8%Hazardous Condition
- Fire incident types reported to NFIRS in National City, CA
- 62239.5%Outside Fires
- 56435.9%Structure Fires
- 27317.4%Mobile Property/Vehicle Fires
- 1147.2%Other
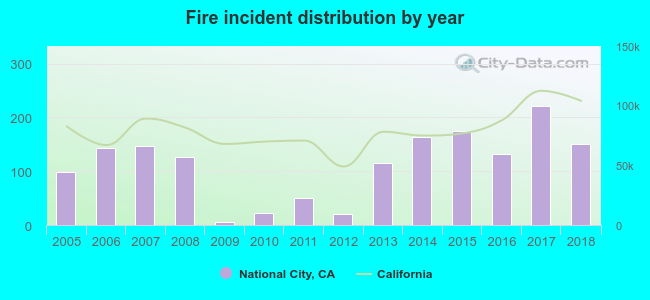 According to the data from the years 2005 - 2018 the average number of fires per year is 112. The highest number of reported fires - 222 took place in 2017, and the least - 5 in 2009. The data has a rising trend.
The average number of yearly fire incidents per 10k residents in National City, CA compared to nearest cities:
(Note: Based on data for the last 3 years, including only cities with population 5,000 and above)
| National City: | 27.8 |
| Bonita: | 16.7 |
| Chula Vista: | 9.6 |
| Coronado: | 6.4 |
| Lemon Grove: | 8.2 |
| Imperial Beach: | 14.2 |
| Spring Valley: | 11.8 |
| La Mesa: | 6.2 |
| San Diego: | 15.0 |
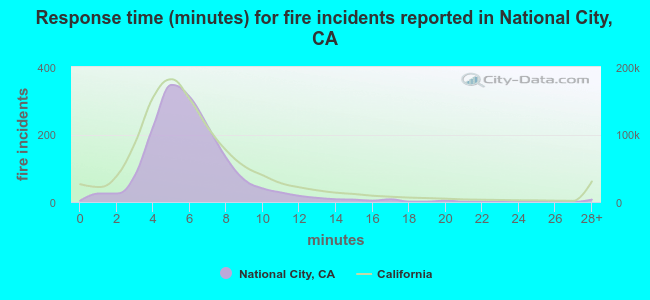 The median response time based on all reported fire incidents is 6 minutes. This is comparable to the California median value.
The median response time in National City, CA compared to nearest cities:
(Note: Based on data for all years, including only cities with at least 500 fire incidents)
| National City: | 6 minutes |
| Chula Vista: | 6 minutes |
| La Mesa: | 6 minutes |
| San Diego: | 6 minutes |
| El Cajon: | 6 minutes |
| Santee: | 7 minutes |
| Lakeside: | 8 minutes |
| Alpine: | 9 minutes |
| Rancho Santa Fe: | 6 minutes |
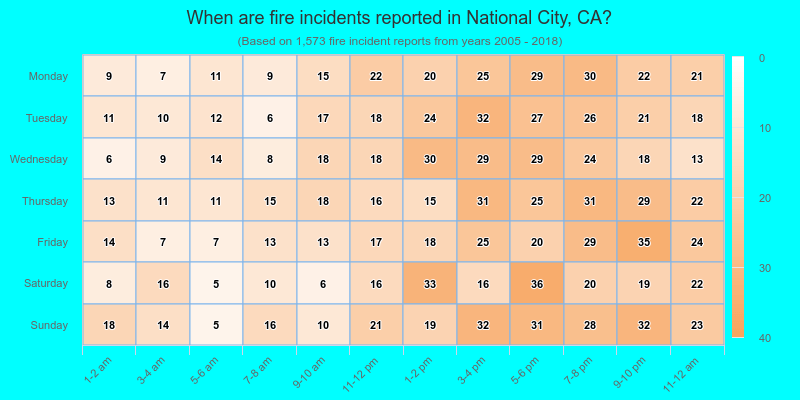
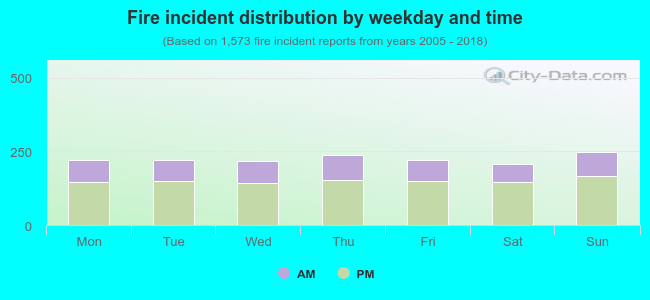 33.1% incidents where reported in the morning and 66.9% in the evening. The most fires (15.8%) took place on Sunday, and the least (13.2%) on Saturday.
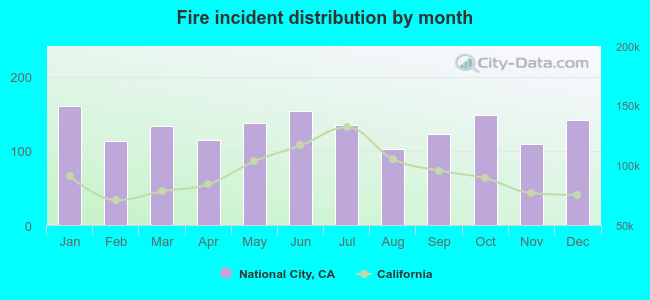 According to the 1,573 reports from years 2005 - 2018 most fires (10.2%) took place during January, and the least (6.5%) in August.
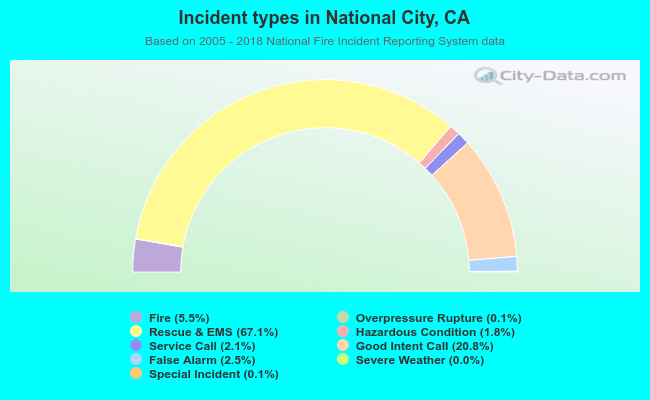 Out of all 28,490 cases reported during the years 2005 - 2018, the most belonged to the categories: Rescue & EMS (67.1%), Good Intent Call (20.8%), and Fire (5.5%).
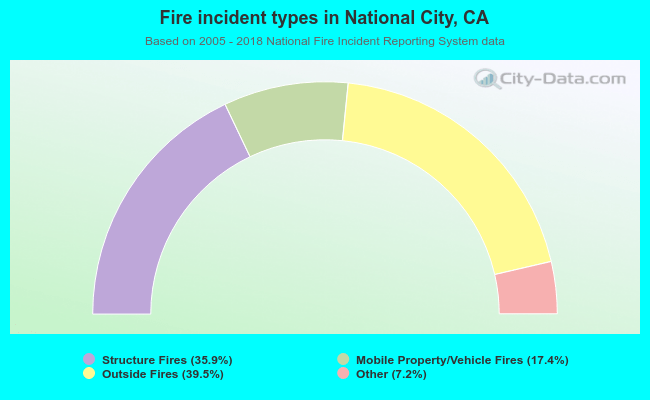 When looking into fire subcategories, the most incidents belonged to: Outside Fires (39.5%), and Structure Fires (35.9%).