Orange Cove: Fire Incidents, California (CA)
Where are fire incidents reported in Orange Cove, CA
Something went wrong! Please refresh the page.
| Fire incidents reported | |
|---|---|
| Sreet name | Count |
| ANCHOR AVE | 174 |
| SOUTH AVE | 142 |
| ADAMS AVE | 102 |
| 10TH ST | 44 |
| MONSON AVE | 44 |
| PARK BLVD | 44 |
| SUMNER AVE | 42 |
| HILL AVE | 36 |
| 11TH ST | 34 |
| 2ND ST | 32 |
| 5TH ST | 32 |
| 8TH ST | 32 |
| 448 AVE | 28 |
| AMERICAN AVE | 28 |
| 9TH ST | 26 |
| CENTER ST | 26 |
| JACOBS AVE | 26 |
| 12TH ST | 24 |
| 4TH ST | 24 |
| COVE AVE | 24 |
| 124 RD | 20 |
| 460 AVE | 18 |
| H ST | 18 |
| HILLS VALLEY RD | 18 |
| 3RD ST | 16 |
| DINUBA AVE | 16 |
| MANNING AVE | 16 |
| 456 AVE | 14 |
| HILLS VALLEY | 14 |
| LINCOLN AVE | 14 |
2007 - 2018 National Fire Incident Reporting System (NFIRS) incidents
- Incident types reported to NFIRS in Orange Cove, CA
- 2,09954.5%Rescue & EMS
- 1,09728.5%Fire
- 2987.7%Good Intent Call
- 1473.8%False Alarm
- 1253.2%Service Call
- 862.2%Hazardous Condition
- Fire incident types reported to NFIRS in Orange Cove, CA
- 78071.1%Outside Fires
- 16114.7%Mobile Property/Vehicle Fires
- 12911.8%Structure Fires
- 272.5%Other
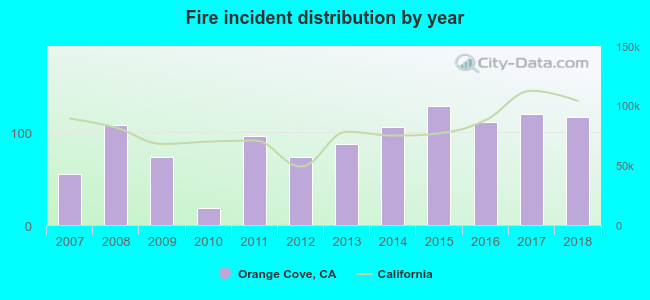 According to the data from the years 2007 - 2018 the average number of fire incidents per year is 91. The highest number of fires - 129 took place in 2015, and the least - 18 in 2010. The data has a rising trend.
The average number of yearly fire incidents per 10k residents in Orange Cove, CA compared to nearest cities:
(Note: Based on data for the last 3 years, including only cities with population 5,000 and above)
| Orange Cove: | 121.0 |
| Orosi: | 42.0 |
| Dinuba: | 52.3 |
| Cutler: | 47.3 |
| Reedley: | 26.7 |
| Parlier: | 45.4 |
| Sanger: | 67.4 |
| Kingsburg: | 79.8 |
| Selma: | 122.0 |
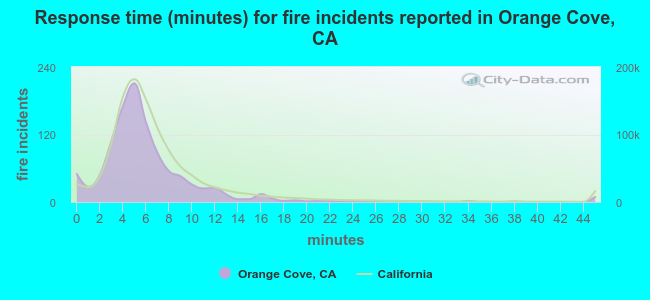 The median response time based on all reported fire incidents is 5 minutes. This is lower than the state median value.
The median response time in Orange Cove, CA compared to nearest cities:
(Note: Based on data for all years, including only cities with at least 500 fire incidents)
| Orange Cove: | 5 minutes |
| Dinuba: | 5 minutes |
| Reedley: | 13 minutes |
| Parlier: | 11 minutes |
| Sanger: | 8 minutes |
| Kingsburg: | 7 minutes |
| Selma: | 6 minutes |
| Woodlake: | 7 minutes |
| Visalia: | 6 minutes |
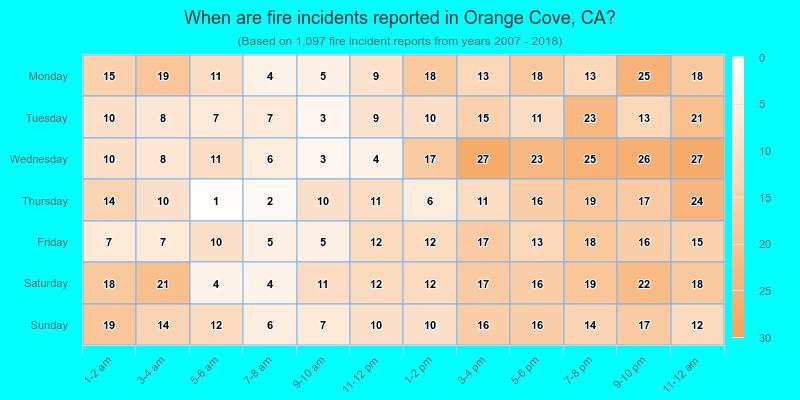
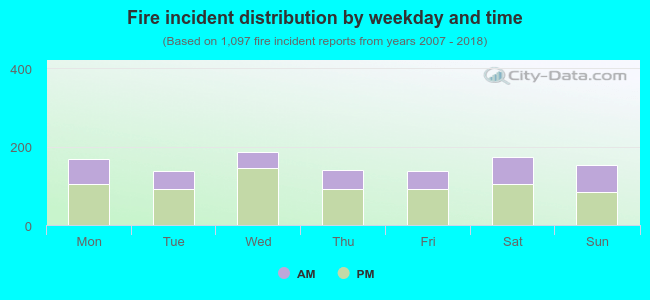 34.7% incidents where reported in the morning and 65.3% in the evening. The most fires (17.0%) took place on Wednesday, and the least (12.5%) on Tuesday.
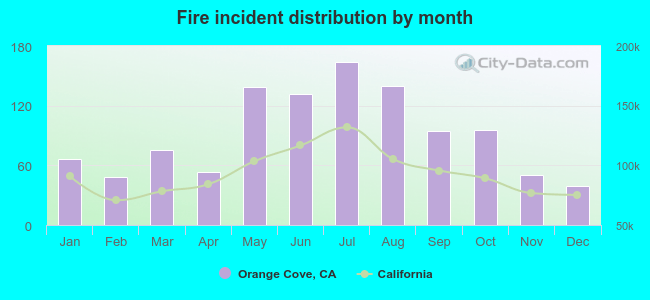 According to the 1,097 reports from years 2007 - 2018 most fires (14.9%) took place during July, and the least (3.6%) in December.
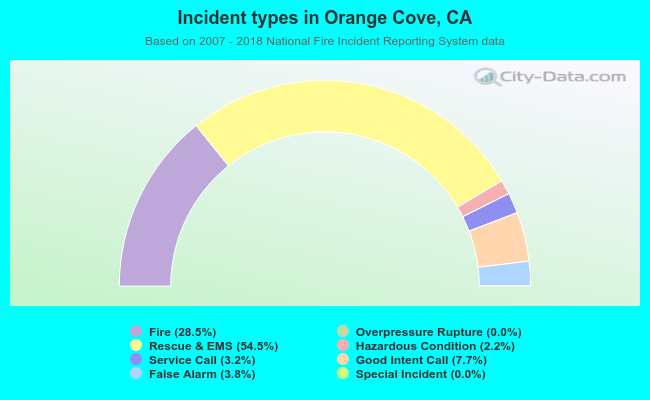 Out of all 3,854 cases reported during the years 2007 - 2018, the most belonged to the categories: Rescue & EMS (54.5%), Fire (28.5%), and Good Intent Call (7.7%).
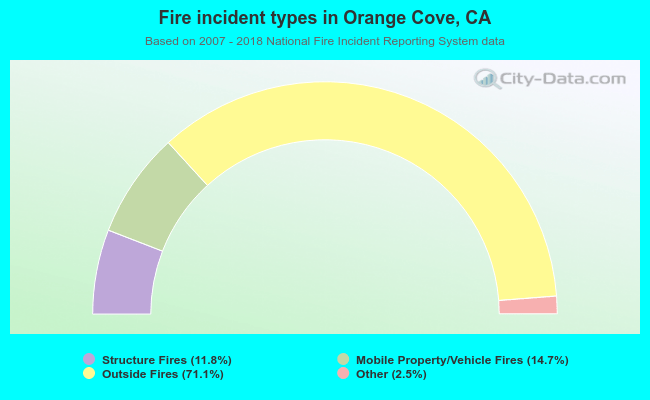 When looking into fire subcategories, the most reports belonged to: Outside Fires (71.1%), and Mobile Property/Vehicle Fires (14.7%).