Visalia: Fire Incidents, California (CA)
Where are fire incidents reported in Visalia, CA
Something went wrong! Please refresh the page.
| Fire incidents reported | |
|---|---|
| Sreet name | Count |
| MOONEY BLVD | 448 |
| DINUBA BLVD | 192 |
| COURT ST | 188 |
| MAIN ST | 164 |
| HOUSTON AVE | 136 |
| GOSHEN | 122 |
| BEN MADDOX WAY | 118 |
| BRIDGE ST | 116 |
| MINERAL KING AVE | 114 |
| PLAZA DR | 112 |
| AKERS ST | 110 |
| SANTA FE ST | 110 |
| NOBLE AVE | 108 |
| BEN MADDOX | 106 |
| CALDWELL AVE | 106 |
| CALDWELL AV | 104 |
| 198 HWY | 102 |
| DEMAREE ST | 100 |
| DIVISADERO ST | 100 |
| NOBLE | 96 |
| WALNUT AV | 94 |
| CALDWELL | 92 |
| TULARE AVE | 90 |
| HWY 198 | 88 |
| GOSHEN AV | 84 |
| RIGGIN AVE | 84 |
| GOSHEN AVE | 80 |
| MOONEY | 80 |
| GARDEN ST | 78 |
| HWY 198 HWY | 78 |
| Other | 3,690 |
2005 - 2018 National Fire Incident Reporting System (NFIRS) incidents
- Incident types reported to NFIRS in Visalia, CA
- 35,46851.9%Rescue & EMS
- 11,00816.1%Hazardous Condition
- 8,92813.1%Good Intent Call
- 7,29010.7%Fire
- 3,9655.8%Service Call
- 1,5422.3%False Alarm
- Fire incident types reported to NFIRS in Visalia, CA
- 3,78551.9%Outside Fires
- 2,08028.5%Structure Fires
- 1,27317.5%Mobile Property/Vehicle Fires
- 1522.1%Other
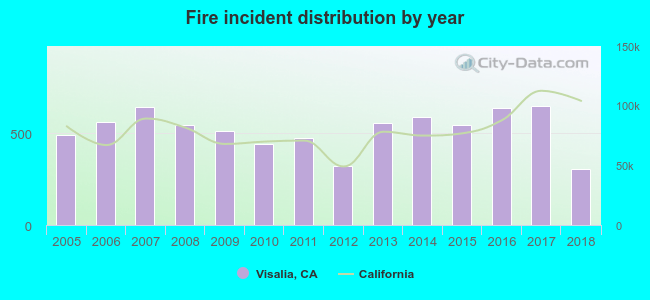 According to the data from the years 2005 - 2018 the average number of fires per year is 521. The highest number of fires - 652 took place in 2017, and the least - 308 in 2018. The data has a dropping trend.
The average number of yearly fire incidents per 10k residents in Visalia, CA compared to nearest cities:
(Note: Based on data for the last 3 years, including only cities with population 5,000 and above)
| Visalia: | 41.3 |
| Farmersville: | 36.5 |
| Tulare: | 50.4 |
| Exeter: | 87.5 |
| Woodlake: | 77.9 |
| Cutler: | 47.3 |
| Lindsay: | 35.6 |
| Orosi: | 42.0 |
| Dinuba: | 52.3 |
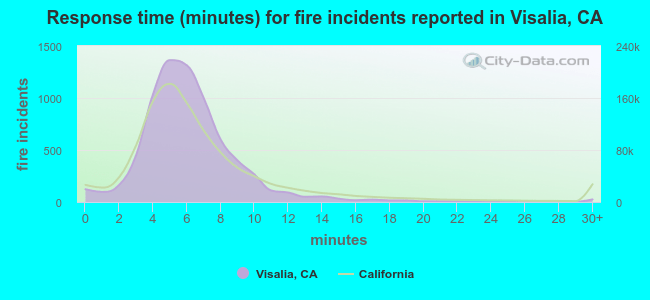 The median response time based on all reported fire incidents is 6 minutes. This is close to the state median value.
The median response time in Visalia, CA compared to nearest cities:
(Note: Based on data for all years, including only cities with at least 500 fire incidents)
| Visalia: | 6 minutes |
| Farmersville: | 5 minutes |
| Tulare: | 5 minutes |
| Exeter: | 7 minutes |
| Woodlake: | 7 minutes |
| Lindsay: | 8 minutes |
| Dinuba: | 5 minutes |
| Hanford: | 7 minutes |
| Kingsburg: | 7 minutes |
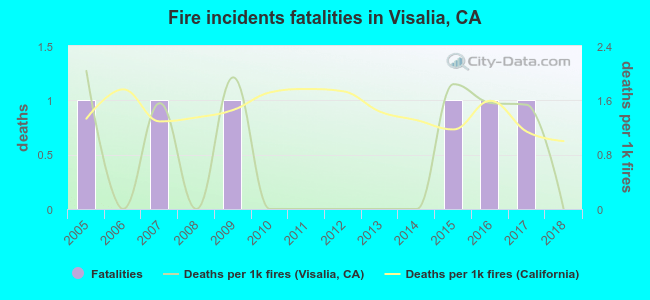 According to the reports from the years 2005 - 2018 the average number of fire-related fatalities per year is 0. The highest number of reported deaths - 1 took place in 2005, and the lowest - 0 in 2006. The data has a decreasing trend.
The average number of deaths per 1,000 fire incidents is 1. This indicator was the highest - 2 in 2005, and the lowest 0 in 2006. The trend for fatalities per 1,000 fire incidents is declining. Compared to the California value the number of deaths per 1,000 fires is lower.
According to the reports from the years 2005 - 2018 the average number of fire-related fatalities per year is 0. The highest number of reported deaths - 1 took place in 2005, and the lowest - 0 in 2006. The data has a decreasing trend.
The average number of deaths per 1,000 fire incidents is 1. This indicator was the highest - 2 in 2005, and the lowest 0 in 2006. The trend for fatalities per 1,000 fire incidents is declining. Compared to the California value the number of deaths per 1,000 fires is lower.Deaths per 1,000 incidents in Visalia, CA compared to nearest cities:
(Note: Based on data for all years, including only cities with at least 2,500 fire incidents)
| Visalia: | 0.8 |
| Tulare: | 0.3 |
| Porterville: | 1.9 |
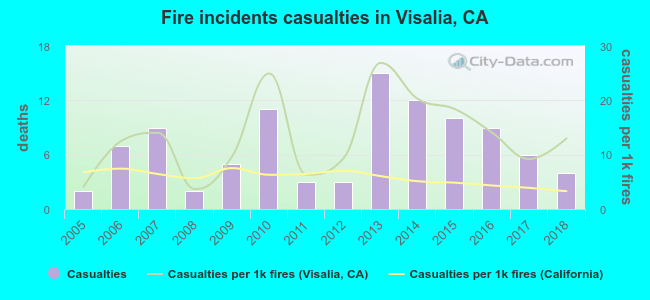 According to the reports from the years 2005 - 2018 the average number of fire-related yearly casualties is 7. The highest number of injuries - 15 took place in 2013, and the lowest - 2 in 2005. The data has a rising trend.
The average number of injuries per 1,000 fires is 13. This indicator was the highest - 27 in 2013, and the lowest 4 in 2008. The trend for injuries per 1,000 fire incidents is growing. Compared to the state value the number of injuries per 1,000 fires is much higher.
According to the reports from the years 2005 - 2018 the average number of fire-related yearly casualties is 7. The highest number of injuries - 15 took place in 2013, and the lowest - 2 in 2005. The data has a rising trend.
The average number of injuries per 1,000 fires is 13. This indicator was the highest - 27 in 2013, and the lowest 4 in 2008. The trend for injuries per 1,000 fire incidents is growing. Compared to the state value the number of injuries per 1,000 fires is much higher.
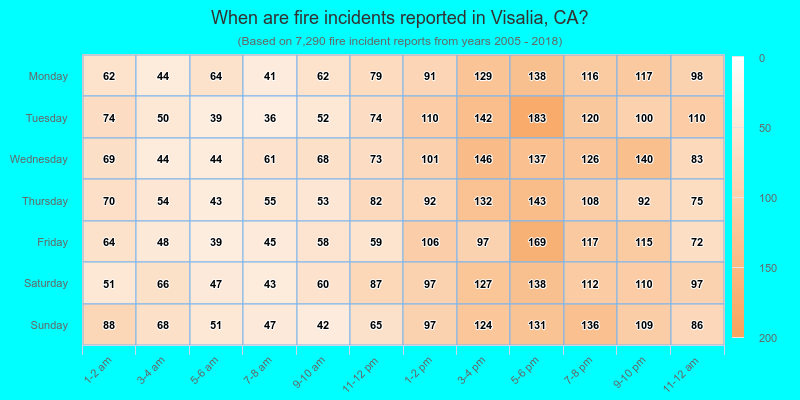
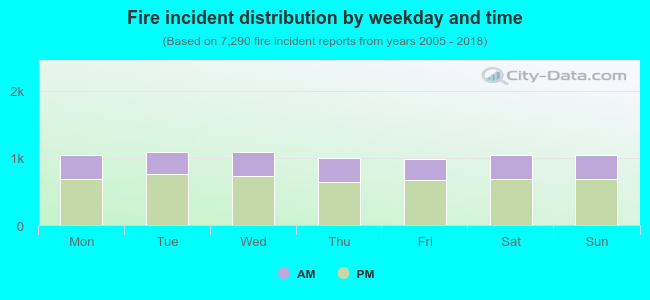 33.2% incidents where reported in the morning and 66.8% in the evening. The most fires (15.0%) took place on Wednesday, and the least (13.6%) on Friday.
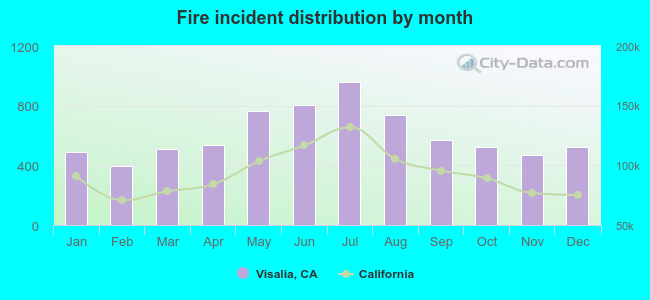 Based on the 7,290 incident reports from years 2005 - 2018 most fires (13.2%) took place during July, and the least (5.4%) in February.
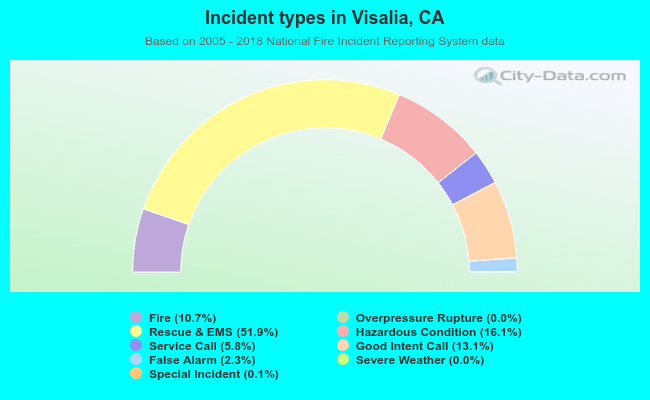 Out of all 68,282 cases reported during the years 2005 - 2018, the most belonged to the categories: Rescue & EMS (51.9%), Hazardous Condition (16.1%), and Good Intent Call (13.1%).
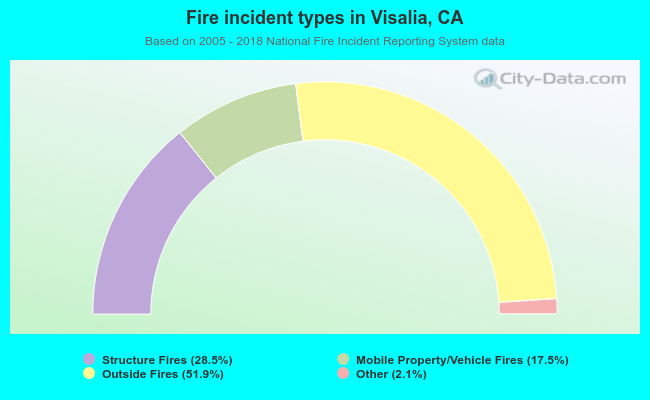 When looking into fire subcategories, the most reports belonged to: Outside Fires (51.9%), and Structure Fires (28.5%).