Kingsburg: Fire Incidents, California (CA)
Where are fire incidents reported in Kingsburg, CA
Something went wrong! Please refresh the page.
|
| |||||||||||||||||||||||||||||||||||||||||||||||||||||||||||||||||||||||||||||||||||||||||||||||||||||||||||||
2005 - 2018 National Fire Incident Reporting System (NFIRS) incidents
- Incident types reported to NFIRS in Kingsburg, CA
- 6,29364.1%Rescue & EMS
- 1,31813.4%Good Intent Call
- 1,17712.0%Fire
- 4774.9%False Alarm
- 2732.8%Service Call
- 2502.5%Hazardous Condition
- 200.2%Special Incident
- 100.1%Overpressure Rupture
- Fire incident types reported to NFIRS in Kingsburg, CA
- 56447.9%Outside Fires
- 29324.9%Structure Fires
- 26222.3%Mobile Property/Vehicle Fires
- 584.9%Other
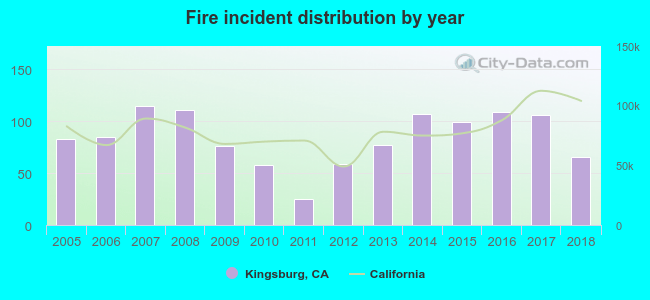 According to the data from the years 2005 - 2018 the average number of fires per year is 84. The highest number of fire incidents - 115 took place in 2007, and the least - 25 in 2011. The data has a decreasing trend.
The average number of yearly fire incidents per 10k residents in Kingsburg, CA compared to nearest cities:
(Note: Based on data for the last 3 years, including only cities with population 5,000 and above)
| Kingsburg: | 79.8 |
| Selma: | 122.0 |
| Parlier: | 45.4 |
| Reedley: | 26.7 |
| Dinuba: | 52.3 |
| Fowler: | 80.0 |
| Sanger: | 67.4 |
| Hanford: | 53.5 |
| Cutler: | 47.3 |
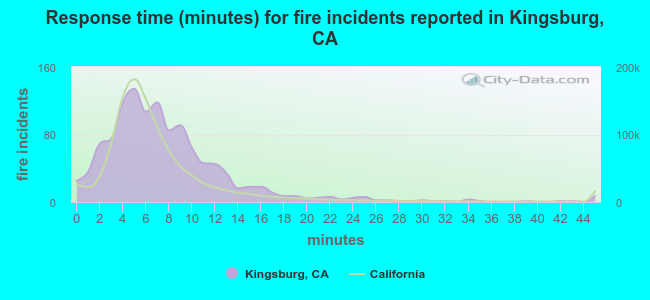 The median response time based on all reported fire incidents is 7 minutes. This is about the same as the California median value.
The median response time in Kingsburg, CA compared to nearest cities:
(Note: Based on data for all years, including only cities with at least 500 fire incidents)
| Kingsburg: | 7 minutes |
| Selma: | 6 minutes |
| Parlier: | 11 minutes |
| Reedley: | 13 minutes |
| Dinuba: | 5 minutes |
| Sanger: | 8 minutes |
| Hanford: | 7 minutes |
| Orange Cove: | 5 minutes |
| Caruthers: | 10 minutes |
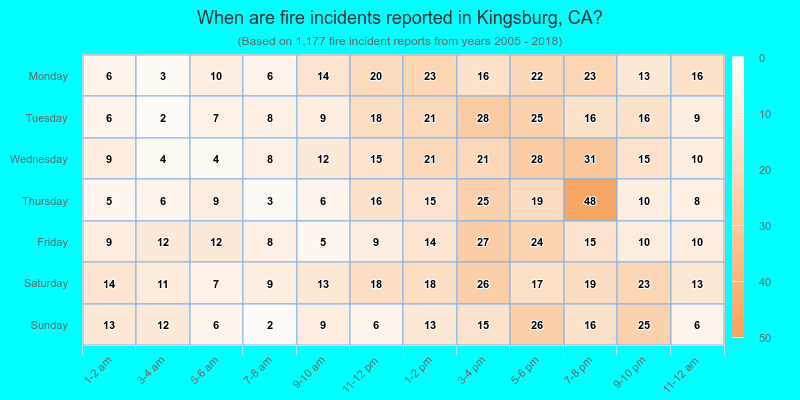
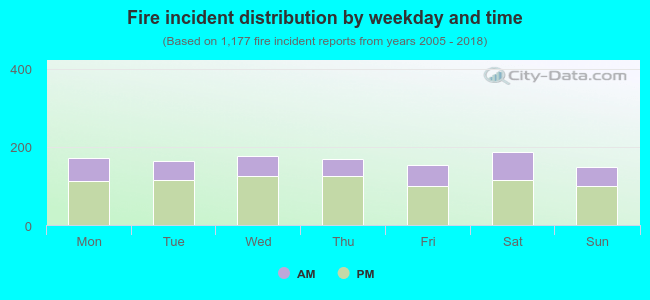 32.4% incidents where reported in the morning and 67.6% in the evening. The most fires (16.0%) took place on Saturday, and the least (12.7%) on Sunday.
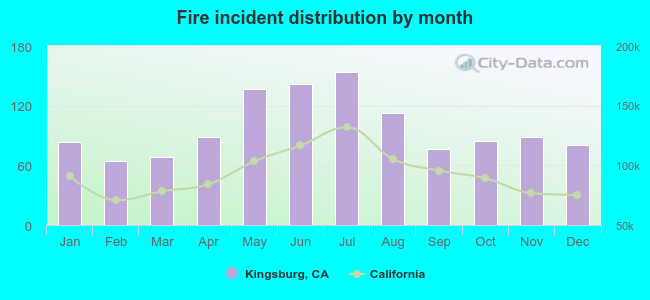 According to the 1,177 reports from years 2005 - 2018 most fires (13.1%) took place during July, and the least (5.4%) in February.
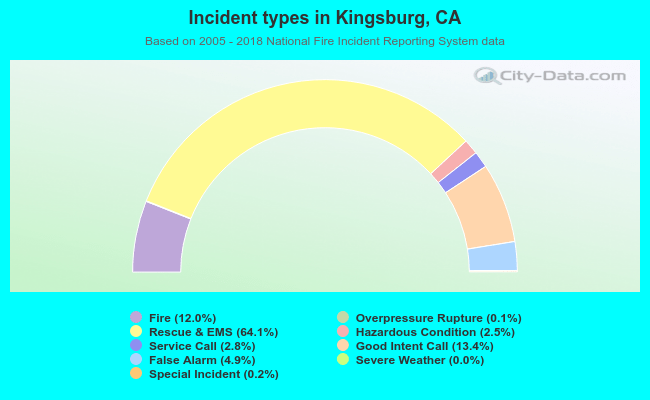 Out of all 9,819 cases reported during the years 2005 - 2018, the most belonged to the categories: Rescue & EMS (64.1%), Good Intent Call (13.4%), and Fire (12.0%).
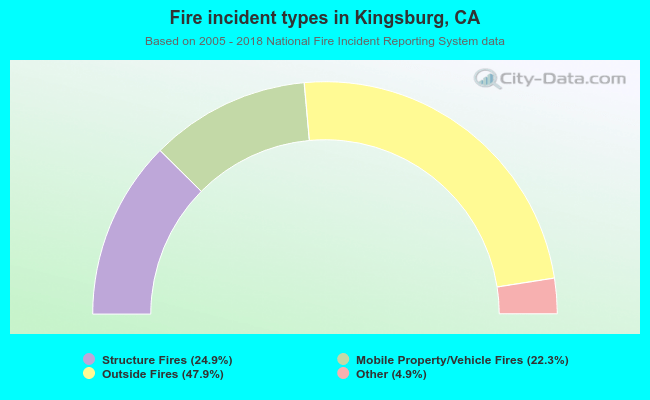 When looking into fire subcategories, the most incidents belonged to: Outside Fires (47.9%), and Structure Fires (24.9%).