Sanger: Fire Incidents, California (CA)
Where are fire incidents reported in Sanger, CA
Something went wrong! Please refresh the page.
| Fire incidents reported | |
|---|---|
| Sreet name | Count |
| KINGS CANYON RD | 140 |
| ACADEMY AVE | 132 |
| BELMONT | 82 |
| ACADEMY | 72 |
| DEL REY | 64 |
| BETHEL | 56 |
| JENSEN AVE | 54 |
| GREENWOOD | 52 |
| MCKINLEY | 52 |
| K ST | 50 |
| INDIANOLA | 48 |
| RIVERBEND | 48 |
| TRIMMER SPRINGS RD | 46 |
| O ST | 42 |
| ANNADALE | 40 |
| BETHEL AVE | 40 |
| NEWMARK | 40 |
| 9TH ST | 38 |
| LINCOLN | 38 |
| NORTH AVE | 38 |
| J ST | 36 |
| HWY 180 | 34 |
| NEWMARK AVE | 34 |
| CENTRAL | 32 |
| GREENWOOD AVE | 32 |
| JENSEN | 32 |
| QUALITY | 32 |
| RAINBOW | 32 |
| 5TH ST | 30 |
| CALIFORNIA | 30 |
| Other | 255 |
2005 - 2018 National Fire Incident Reporting System (NFIRS) incidents
- Incident types reported to NFIRS in Sanger, CA
- 11,92974.2%Rescue & EMS
- 1,75110.9%Fire
- 1,2627.8%Good Intent Call
- 4222.6%Hazardous Condition
- 4172.6%False Alarm
- 2851.8%Service Call
- Fire incident types reported to NFIRS in Sanger, CA
- 91052.0%Outside Fires
- 42724.4%Structure Fires
- 32718.7%Mobile Property/Vehicle Fires
- 875.0%Other
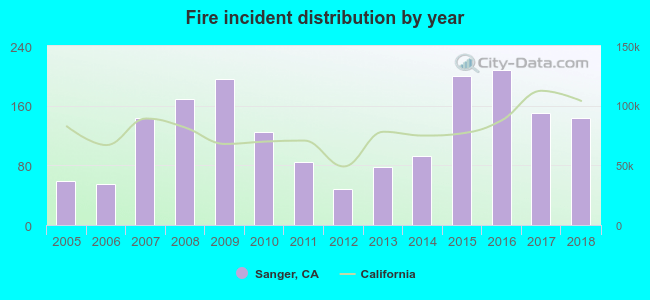 According to the data from the years 2005 - 2018 the average number of fire incidents per year is 125. The highest number of reported fires - 208 took place in 2016, and the least - 48 in 2012. The data has a growing trend.
The average number of yearly fire incidents per 10k residents in Sanger, CA compared to nearest cities:
(Note: Based on data for the last 3 years, including only cities with population 5,000 and above)
| Sanger: | 67.4 |
| Parlier: | 45.4 |
| Fowler: | 80.0 |
| Selma: | 122.0 |
| Reedley: | 26.7 |
| Clovis: | 32.3 |
| Kingsburg: | 79.8 |
| Fresno: | 73.2 |
| Dinuba: | 52.3 |
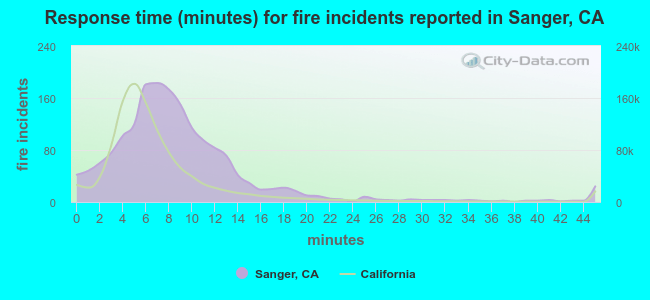 The median response time based on all reported fire incidents is 8 minutes. This is higher than the California median value.
The median response time in Sanger, CA compared to nearest cities:
(Note: Based on data for all years, including only cities with at least 500 fire incidents)
| Sanger: | 8 minutes |
| Parlier: | 11 minutes |
| Selma: | 6 minutes |
| Reedley: | 13 minutes |
| Clovis: | 5 minutes |
| Kingsburg: | 7 minutes |
| Easton: | 7 minutes |
| Fresno: | 5 minutes |
| Dinuba: | 5 minutes |
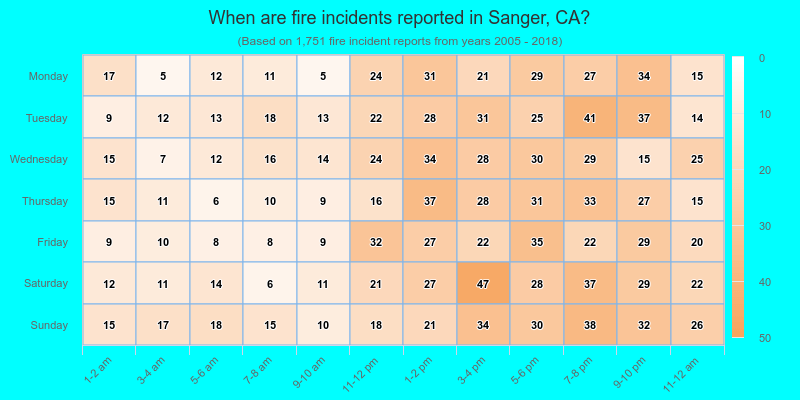
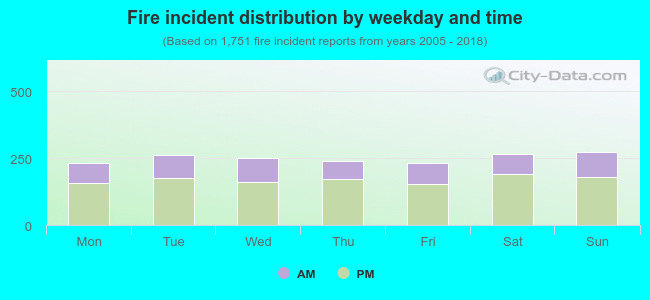 32.0% incidents where reported in the morning and 68.0% in the evening. The most fires (15.6%) took place on Sunday, and the least (13.2%) on Monday.
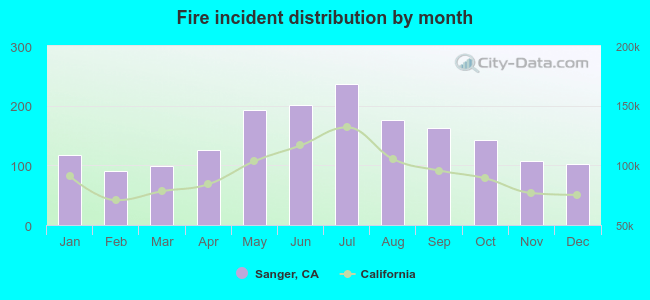 According to the 1,751 reports from years 2005 - 2018 most fires (13.5%) took place during July, and the least (5.2%) in February.
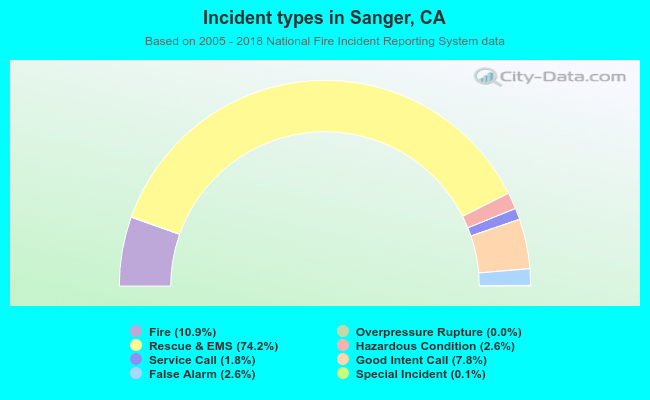 Out of all 16,086 cases reported during the years 2005 - 2018, the most belonged to the categories: Rescue & EMS (74.2%), Fire (10.9%), and Good Intent Call (7.8%).
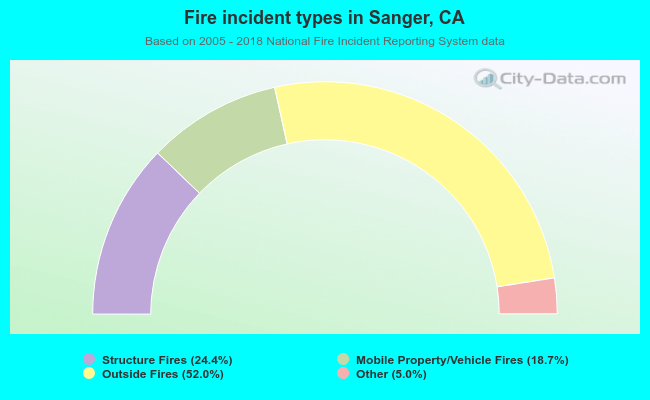 When looking into fire subcategories, the most reports belonged to: Outside Fires (52.0%), and Structure Fires (24.4%).