Menomonee Falls: Fire Incidents, Wisconsin (WI)
Where are fire incidents reported in Menomonee Falls, WI
Something went wrong! Please refresh the page.
| Fire incidents reported | |
|---|---|
| Sreet name | Count |
| APPLETON AVE | 130 |
| MAIN ST | 86 |
| PILGRIM RD | 58 |
| MARCY RD | 52 |
| APPLETON | 46 |
| TOWN HALL RD | 46 |
| BOUNDARY RD | 44 |
| FOND DU LAC AVE | 44 |
| SILVER SPRING DR | 44 |
| ANTHONY AVE | 38 |
| LILLY RD | 38 |
| SHADY LN | 38 |
| MENOMONEE AVE | 34 |
| CLEVELAND AVE | 30 |
| COUNTY LINE RD | 30 |
| LEON RD | 30 |
| WATER ST | 30 |
| WHITE OAK CIR | 28 |
| CARMEN AVE | 26 |
| RIDGEWOOD DR | 24 |
| UNVERIFIED DR | 24 |
| ELDER LN | 22 |
| HWY 41 FWY | 22 |
| TOWN LINE RD | 18 |
| KOHLER LN | 16 |
| LISBON RD | 16 |
| RIDGE RD | 16 |
| NORTHFIELD DR | 14 |
| ROOSEVELT DR | 14 |
| ANN AVE | 12 |
| Other | 160 |
2002 - 2018 National Fire Incident Reporting System (NFIRS) incidents
- Incident types reported to NFIRS in Menomonee Falls, WI
- 13,45864.4%Rescue & EMS
- 2,13810.2%Service Call
- 1,5977.6%Hazardous Condition
- 1,4717.0%False Alarm
- 1,2305.9%Fire
- 9644.6%Good Intent Call
- 220.1%Severe Weather
- Fire incident types reported to NFIRS in Menomonee Falls, WI
- 58047.2%Structure Fires
- 33427.2%Outside Fires
- 23419.0%Mobile Property/Vehicle Fires
- 826.7%Other
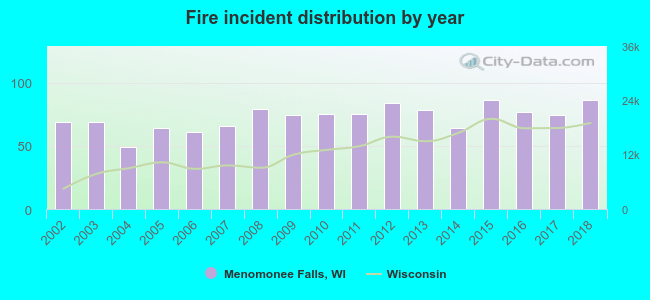 Based on the data from the years 2002 - 2018 the average number of fires per year is 72. The highest number of fire incidents - 86 took place in 2015, and the least - 49 in 2004. The data has a rising trend.
The average number of yearly fire incidents per 10k residents in Menomonee Falls, WI compared to nearest cities:
(Note: Based on data for the last 3 years, including only cities with population 5,000 and above)
| Menomonee Falls: | 22.0 |
| Germantown: | 31.0 |
| Sussex: | 23.0 |
| Brookfield: | 23.3 |
| Lisbon: | 3.0 |
| Brown Deer: | 13.5 |
| Elm Grove: | 13.0 |
| Wauwatosa: | 16.1 |
| Richfield: | 20.9 |
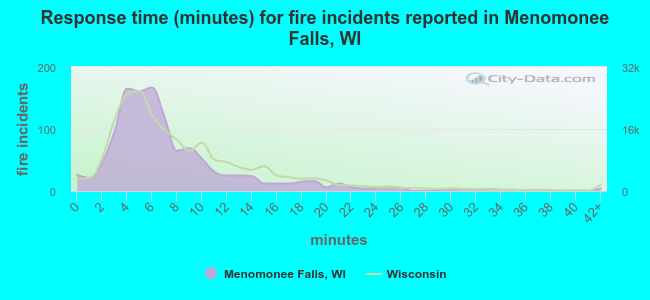 The median response time based on all reported fire incidents is 6 minutes. This is similar to the state median value.
The median response time in Menomonee Falls, WI compared to nearest cities:
(Note: Based on data for all years, including only cities with at least 500 fire incidents)
| Menomonee Falls: | 6 minutes |
| Sussex: | 9 minutes |
| Brookfield: | 7 minutes |
| Wauwatosa: | 6 minutes |
| Pewaukee: | 8 minutes |
| Milwaukee: | 4 minutes |
| West Allis: | 4 minutes |
| Waukesha: | 6 minutes |
| New Berlin: | 7 minutes |
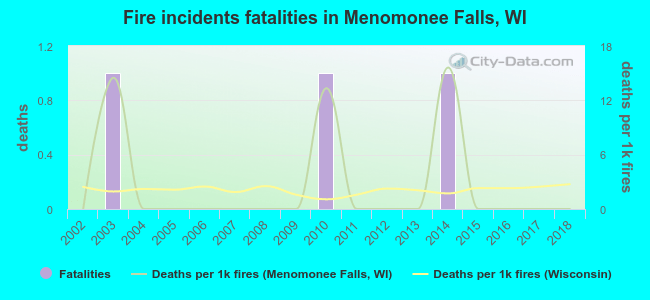 According to the reports from the years 2002 - 2018 the average number of fire-related yearly deaths is 0. The highest number of deaths - 1 took place in 2003, and the lowest - 0 in 2002. The data has a constant trend.
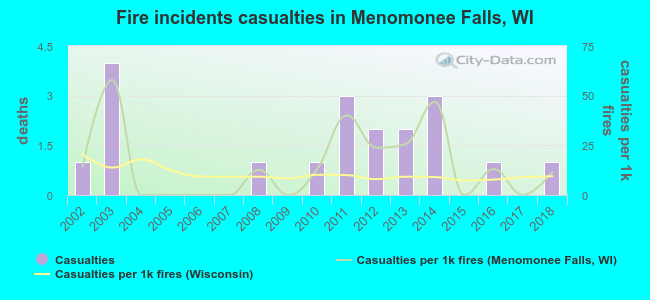 Based on the data from the years 2002 - 2018 the average number of fire-related yearly casualties is 1. The highest number of casualties - 4 took place in 2003, and the lowest - 0 in 2004. The data has a constant trend.
The average number of injuries per 1,000 fires is 15. This indicator was the highest - 58 in 2003, and the lowest 0 in 2004. The trend for casualties per 1,000 fire incidents is decreasing. Compared to the state value the number of injuries per 1,000 fire incidents is higher.
Based on the data from the years 2002 - 2018 the average number of fire-related yearly casualties is 1. The highest number of casualties - 4 took place in 2003, and the lowest - 0 in 2004. The data has a constant trend.
The average number of injuries per 1,000 fires is 15. This indicator was the highest - 58 in 2003, and the lowest 0 in 2004. The trend for casualties per 1,000 fire incidents is decreasing. Compared to the state value the number of injuries per 1,000 fire incidents is higher.Casualties per 1,000 incidents in Menomonee Falls, WI compared to nearest cities:
(Note: Based on data for all years, including only cities with at least 500 fire incidents)
| Menomonee Falls: | 15.4 |
| Sussex: | 10.1 |
| Brookfield: | 21.0 |
| Wauwatosa: | 28.7 |
| Pewaukee: | 16.7 |
| Milwaukee: | 1.6 |
| West Allis: | 53.5 |
| Waukesha: | 11.9 |
| New Berlin: | 7.1 |
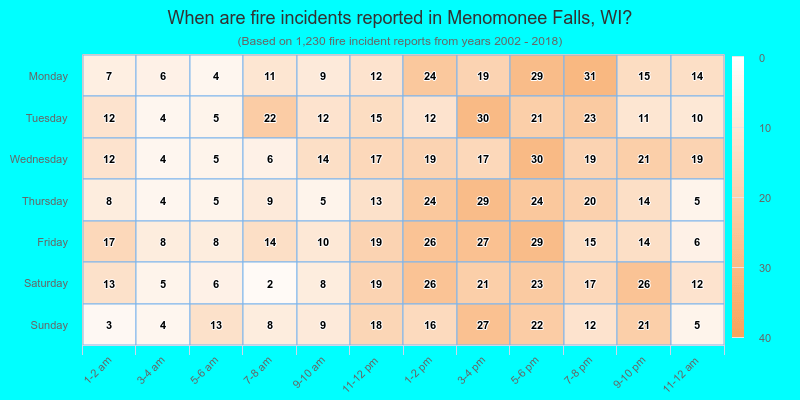
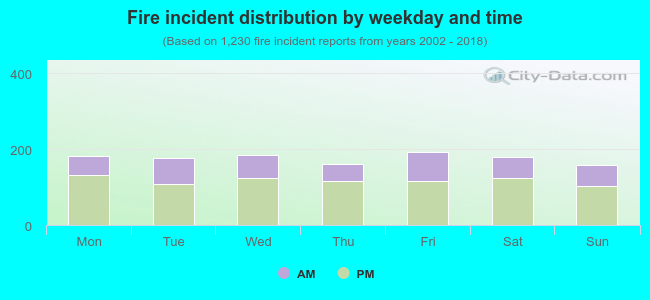 32.9% incidents where reported in the morning and 67.1% in the evening. The most fires (15.7%) took place on Friday, and the least (12.8%) on Sunday.
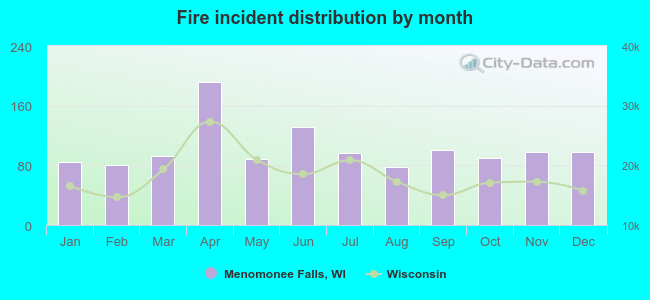 Based on the 1,230 reports from years 2002 - 2018 most fires (15.6%) took place during April, and the least (6.3%) in August.
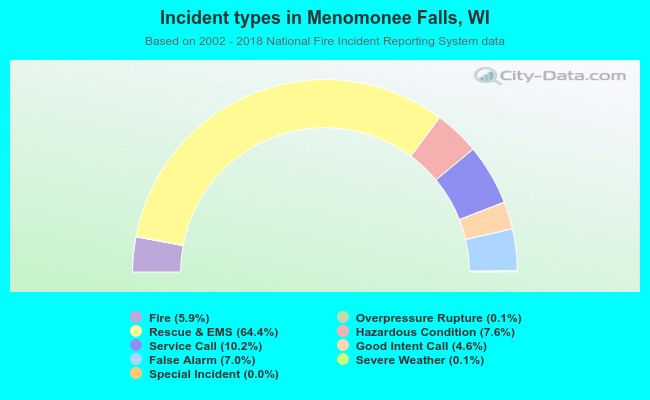 Out of all 20,902 cases reported during the years 2002 - 2018, the most belonged to the categories: Rescue & EMS (64.4%), Service Call (10.2%), and Hazardous Condition (7.6%).
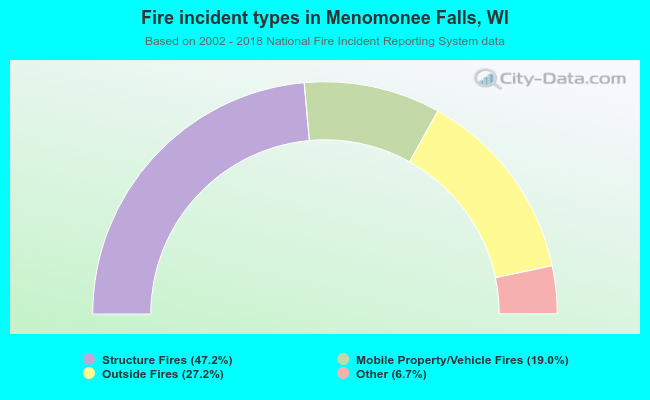 When looking into fire subcategories, the most reports belonged to: Structure Fires (47.2%), and Outside Fires (27.2%).