Brookfield: Fire Incidents, Wisconsin (WI)
Where are fire incidents reported in Brookfield, WI
Something went wrong! Please refresh the page.
| Fire incidents reported | |
|---|---|
| Sreet name | Count |
| BLUEMOUND RD | 164 |
| BROOKFIELD RD | 132 |
| CAPITOL DR | 116 |
| CALHOUN RD | 82 |
| MOORLAND RD | 82 |
| BARKER RD | 72 |
| NORTH AVE | 66 |
| WB I94 | 60 |
| INTERSTATE 94 | 34 |
| 124TH ST | 32 |
| EB I94 | 32 |
| LILLY RD | 32 |
| COMMERCE AVE | 28 |
| LISBON RD | 26 |
| NORTH AV | 26 |
| 127TH ST | 22 |
| COMMERCE AV | 22 |
| PILGRIM RD | 22 |
| GREENFIELD AVE | 20 |
| NORHARDT DR | 18 |
| GREENFIELD AV | 16 |
| RIVERVIEW DR | 16 |
| SUNNY SLOPE RD | 16 |
| WILSON DR | 16 |
| 126TH ST | 14 |
| BURLEIGH RD | 14 |
| DAVIDSON RD | 14 |
| ELM GROVE RD | 14 |
| ENTERPRISE AV | 14 |
| I-94 WESTBOUND EXPY | 14 |
| Other | 96 |
2003 - 2018 National Fire Incident Reporting System (NFIRS) incidents
- Incident types reported to NFIRS in Brookfield, WI
- 12,34158.6%Rescue & EMS
- 2,0679.8%False Alarm
- 1,8218.6%Service Call
- 1,7908.5%Hazardous Condition
- 1,4236.8%Good Intent Call
- 1,3326.3%Fire
- 2651.3%Overpressure Rupture
- Fire incident types reported to NFIRS in Brookfield, WI
- 64648.5%Structure Fires
- 34125.6%Outside Fires
- 27420.6%Mobile Property/Vehicle Fires
- 715.3%Other
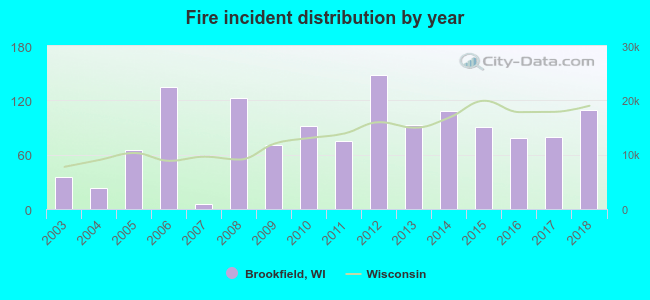 According to the data from the years 2003 - 2018 the average number of fires per year is 83. The highest number of fire incidents - 148 took place in 2012, and the least - 5 in 2007. The data has a growing trend.
The average number of yearly fire incidents per 10k residents in Brookfield, WI compared to nearest cities:
(Note: Based on data for the last 3 years, including only cities with population 5,000 and above)
| Brookfield: | 23.3 |
| Elm Grove: | 13.0 |
| Wauwatosa: | 16.1 |
| New Berlin: | 28.9 |
| West Allis: | 18.9 |
| Menomonee Falls: | 22.0 |
| Pewaukee: | 40.9 |
| Waukesha: | 23.6 |
| Sussex: | 23.0 |
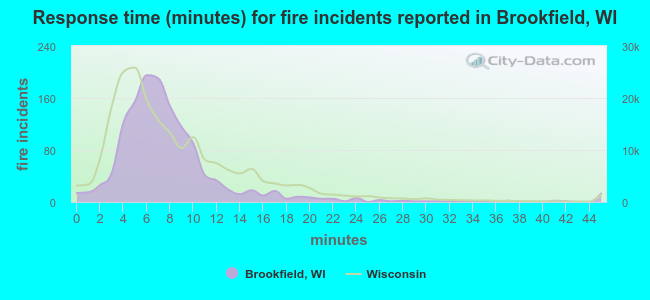 The median response time based on all reported fire incidents is 7 minutes. This is close to the state median value.
The median response time in Brookfield, WI compared to nearest cities:
(Note: Based on data for all years, including only cities with at least 500 fire incidents)
| Brookfield: | 7 minutes |
| Wauwatosa: | 6 minutes |
| New Berlin: | 7 minutes |
| West Allis: | 4 minutes |
| Menomonee Falls: | 6 minutes |
| Pewaukee: | 8 minutes |
| Waukesha: | 6 minutes |
| Sussex: | 9 minutes |
| Milwaukee: | 4 minutes |
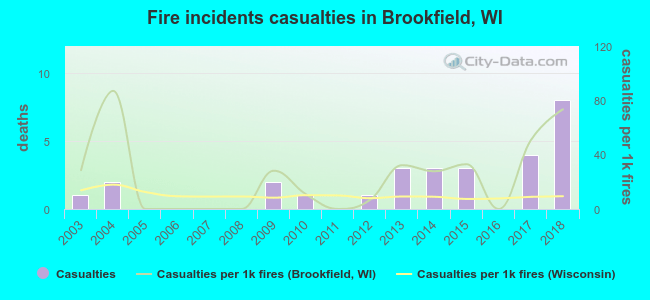 Based on the reports from the years 2003 - 2018 the average number of fire-related yearly casualties is 2. The highest number of reported injuries - 8 took place in 2018, and the lowest - 0 in 2005. The data has a rising trend.
The average number of casualties per 1,000 fire incidents is 24. This indicator was the highest - 87 in 2004, and the lowest 0 in 2005. The trend for injuries per 1,000 fires is rising. Compared to the Wisconsin value the number of injuries per 1,000 fires is much higher.
Based on the reports from the years 2003 - 2018 the average number of fire-related yearly casualties is 2. The highest number of reported injuries - 8 took place in 2018, and the lowest - 0 in 2005. The data has a rising trend.
The average number of casualties per 1,000 fire incidents is 24. This indicator was the highest - 87 in 2004, and the lowest 0 in 2005. The trend for injuries per 1,000 fires is rising. Compared to the Wisconsin value the number of injuries per 1,000 fires is much higher.Casualties per 1,000 incidents in Brookfield, WI compared to nearest cities:
(Note: Based on data for all years, including only cities with at least 500 fire incidents)
| Brookfield: | 21.0 |
| Wauwatosa: | 28.7 |
| New Berlin: | 7.1 |
| West Allis: | 53.5 |
| Menomonee Falls: | 15.4 |
| Pewaukee: | 16.7 |
| Waukesha: | 11.9 |
| Sussex: | 10.1 |
| Milwaukee: | 1.6 |
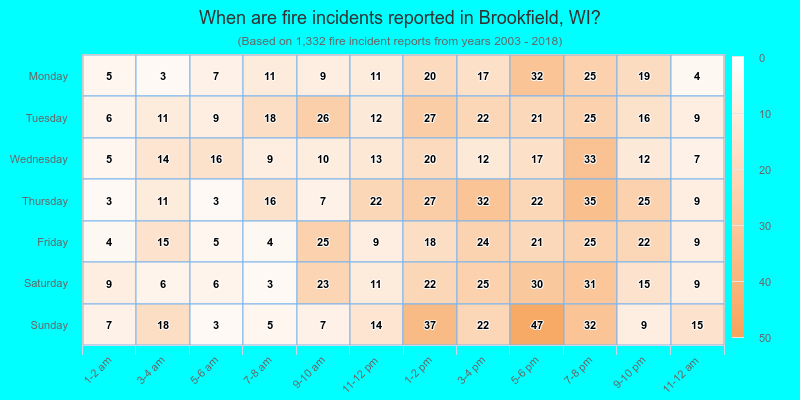
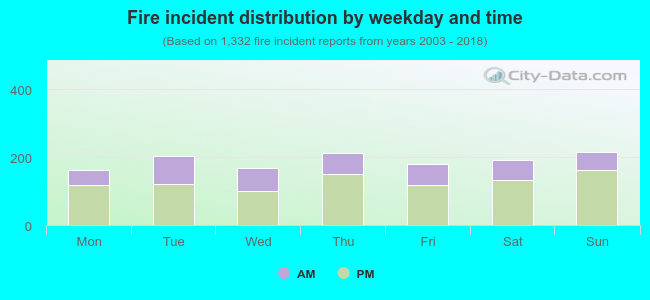 32.4% incidents where reported in the morning and 67.6% in the evening. The most fires (16.2%) took place on Sunday, and the least (12.2%) on Monday.
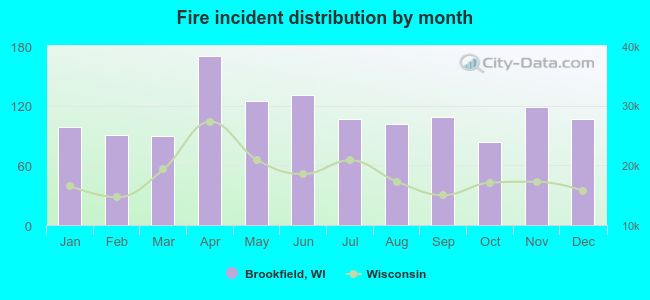 Based on the 1,332 fire incident reports from years 2003 - 2018 most fires (12.8%) took place during April, and the least (6.2%) in October.
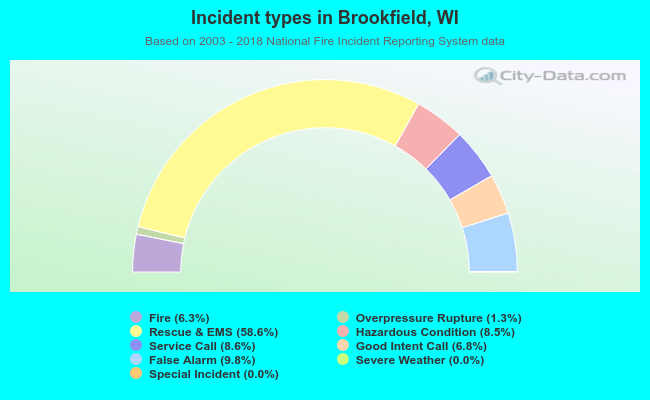 Out of all 21,054 cases reported during the years 2003 - 2018, the most belonged to the categories: Rescue & EMS (58.6%), False Alarm (9.8%), and Service Call (8.6%).
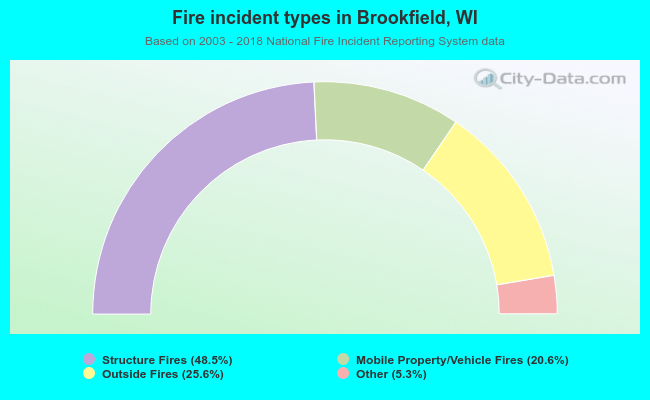 When looking into fire subcategories, the most incidents belonged to: Structure Fires (48.5%), and Outside Fires (25.6%).