Milwaukee: Fire Incidents, Wisconsin (WI)
Where are fire incidents reported in Milwaukee, WI
Something went wrong! Please refresh the page.
| Fire incidents reported | |
|---|---|
| Sreet name | Count |
| 27TH ST | 800 |
| 35TH ST | 642 |
| 20TH ST | 640 |
| 13TH ST | 634 |
| 29TH ST | 566 |
| 37TH ST | 566 |
| 28TH ST | 558 |
| 26TH ST | 526 |
| 38TH ST | 526 |
| 23RD ST | 524 |
| 39TH ST | 524 |
| 6TH ST | 518 |
| 25TH ST | 500 |
| 11TH ST | 494 |
| 60TH ST | 492 |
| 12TH ST | 490 |
| FOND DU LAC AVE | 472 |
| 14TH ST | 458 |
| 21ST ST | 456 |
| 36TH ST | 450 |
| 9TH ST | 446 |
| 40TH ST | 442 |
| 22ND ST | 440 |
| 10TH ST | 424 |
| TEUTONIA AVE | 420 |
| 24TH ST | 416 |
| 30TH ST | 408 |
| 34TH ST | 402 |
| 76TH ST | 392 |
| 41ST ST | 386 |
| Other | 8,875 |
2005 - 2018 National Fire Incident Reporting System (NFIRS) incidents
- Incident types reported to NFIRS in Milwaukee, WI
- 146,01864.1%Rescue & EMS
- 23,88710.5%Fire
- 20,9279.2%False Alarm
- 20,3818.9%Hazardous Condition
- 10,6334.7%Good Intent Call
- 5,5222.4%Service Call
- 4360.2%Overpressure Rupture
- Fire incident types reported to NFIRS in Milwaukee, WI
- 10,06642.1%Structure Fires
- 7,58831.8%Outside Fires
- 5,88824.6%Mobile Property/Vehicle Fires
- 3451.4%Other
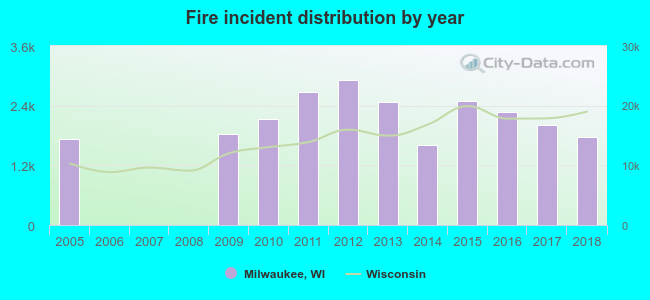 According to the data from the years 2005 - 2018 the average number of fire incidents per year is 1,706. The highest number of fire incidents - 2,911 took place in 2012, and the least - 0 in 2006. The data has a growing trend.
The average number of yearly fire incidents per 10k residents in Milwaukee, WI compared to nearest cities:
(Note: Based on data for the last 3 years, including only cities with population 5,000 and above)
| Milwaukee: | 33.6 |
| Wauwatosa: | 16.1 |
| West Allis: | 18.9 |
| Shorewood: | 10.0 |
| Whitefish Bay: | 7.1 |
| Glendale: | 23.0 |
| Greenfield: | 14.3 |
| Elm Grove: | 13.0 |
| Fox Point: | 10.9 |
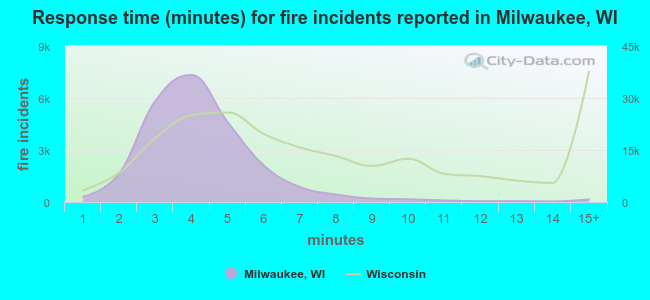 The median response time based on all reported fire incidents is 4 minutes. This is lower than the Wisconsin median value.
The median response time in Milwaukee, WI compared to nearest cities:
(Note: Based on data for all years, including only cities with at least 500 fire incidents)
| Milwaukee: | 4 minutes |
| Wauwatosa: | 6 minutes |
| West Allis: | 4 minutes |
| Greenfield: | 6 minutes |
| Brookfield: | 7 minutes |
| Cudahy: | 3 minutes |
| New Berlin: | 7 minutes |
| Menomonee Falls: | 6 minutes |
| South Milwaukee: | 3 minutes |
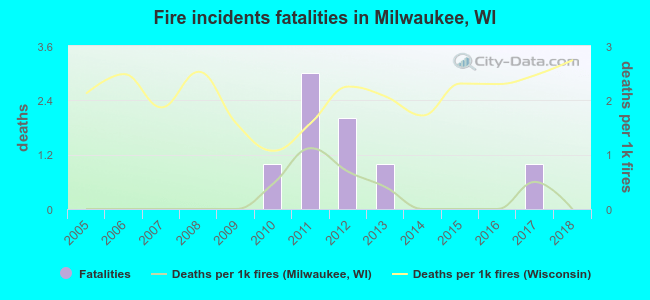 According to the reports from the years 2005 - 2018 the average number of fire-related fatalities per year is 1. The highest number of reported deaths - 3 took place in 2011, and the lowest - 0 in 2005. The data has a constant trend.
The average number of fatalities per 1,000 fire incidents is 0. This indicator was the highest - 1 in 2011, and the lowest 0 in 2005. The trend for deaths per 1,000 incidents is constant. Compared to the Wisconsin value the number of deaths per 1,000 fire incidents is much lower.
According to the reports from the years 2005 - 2018 the average number of fire-related fatalities per year is 1. The highest number of reported deaths - 3 took place in 2011, and the lowest - 0 in 2005. The data has a constant trend.
The average number of fatalities per 1,000 fire incidents is 0. This indicator was the highest - 1 in 2011, and the lowest 0 in 2005. The trend for deaths per 1,000 incidents is constant. Compared to the Wisconsin value the number of deaths per 1,000 fire incidents is much lower.Deaths per 1,000 incidents in Milwaukee, WI compared to nearest cities:
(Note: Based on data for all years, including only cities with at least 2,500 fire incidents)
| Milwaukee: | 0.3 |
| Racine: | 3.2 |
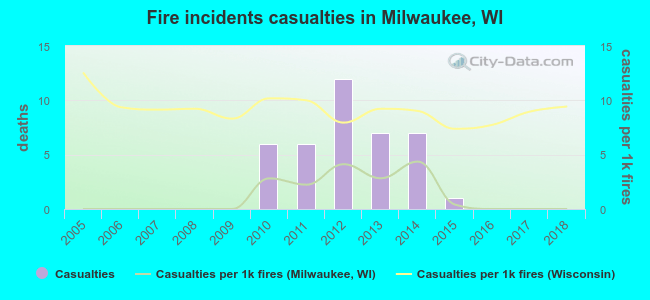 Based on the data from the years 2005 - 2018 the average number of fire-related casualties per year is 3. The highest number of reported casualties - 12 took place in 2012, and the lowest - 0 in 2005. The data has a constant trend.
The average number of injuries per 1,000 fire incidents is 1. This indicator was the highest - 4 in 2014, and the lowest 0 in 2005. The trend for injuries per 1,000 fires is constant. Compared to the Wisconsin value the number of injuries per 1,000 incidents is much lower.
Based on the data from the years 2005 - 2018 the average number of fire-related casualties per year is 3. The highest number of reported casualties - 12 took place in 2012, and the lowest - 0 in 2005. The data has a constant trend.
The average number of injuries per 1,000 fire incidents is 1. This indicator was the highest - 4 in 2014, and the lowest 0 in 2005. The trend for injuries per 1,000 fires is constant. Compared to the Wisconsin value the number of injuries per 1,000 incidents is much lower.Casualties per 1,000 incidents in Milwaukee, WI compared to nearest cities:
(Note: Based on data for all years, including only cities with at least 500 fire incidents)
| Milwaukee: | 1.6 |
| Wauwatosa: | 28.7 |
| West Allis: | 53.5 |
| Greenfield: | 4.0 |
| Brookfield: | 21.0 |
| Cudahy: | 8.5 |
| New Berlin: | 7.1 |
| Menomonee Falls: | 15.4 |
| South Milwaukee: | 18.4 |
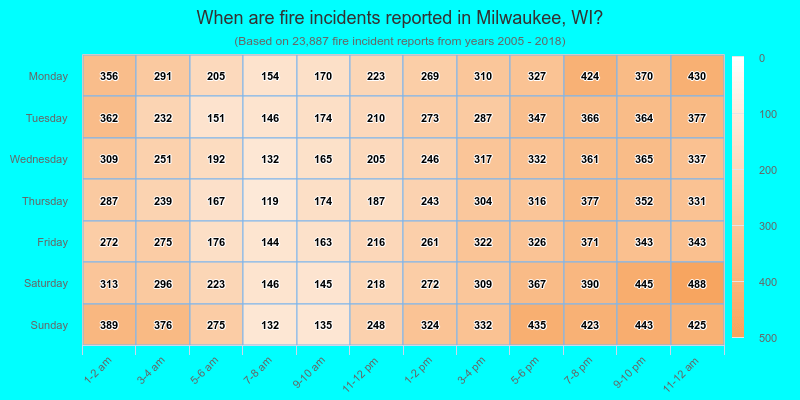
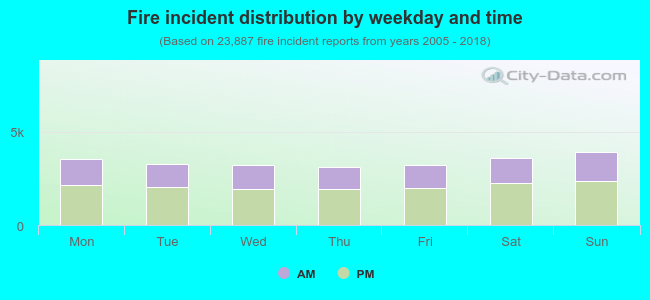 38.7% incidents where reported in the morning and 61.3% in the evening. The most fires (16.5%) took place on Sunday, and the least (13.0%) on Thursday.
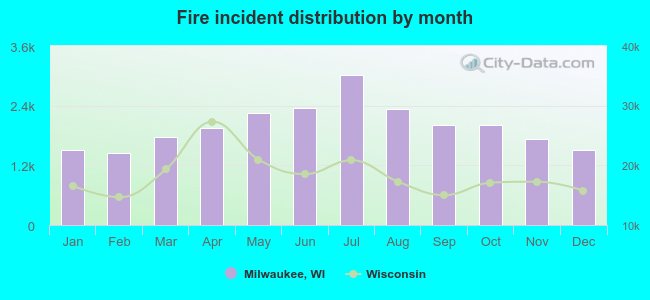 Based on the 23,887 reports from years 2005 - 2018 most fires (12.6%) took place during July, and the least (6.1%) in February.
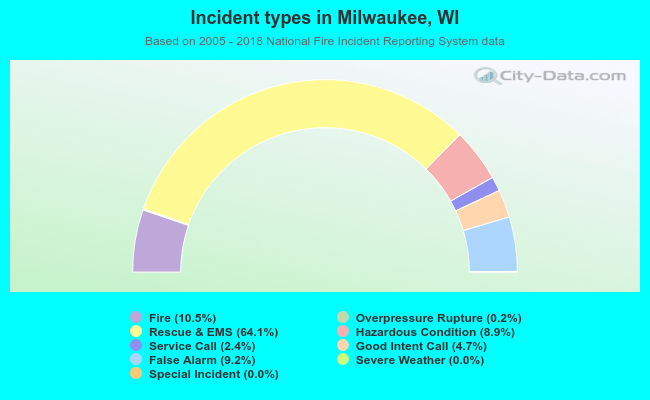 Out of all 227,918 cases reported during the years 2005 - 2018, the most belonged to the categories: Rescue & EMS (64.1%), Fire (10.5%), and False Alarm (9.2%).
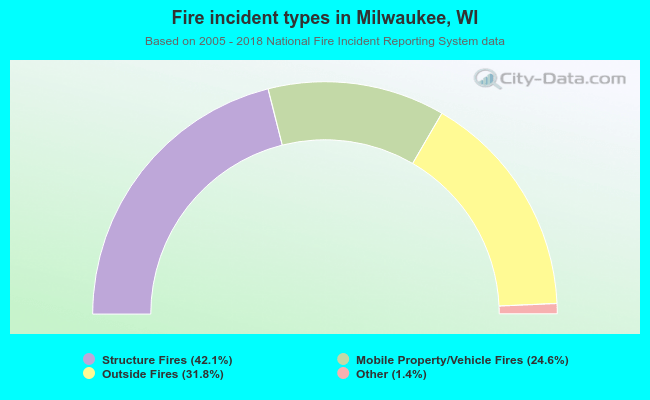 When looking into fire subcategories, the most reports belonged to: Structure Fires (42.1%), and Outside Fires (31.8%).