Germantown: Fire Incidents, Wisconsin (WI)
Where are fire incidents reported in Germantown, WI
Something went wrong! Please refresh the page.
|
| |||||||||||||||||||||||||||||||||||||||||||||||||||||||||||||||||||||||||||||||||||||||||||||||||||||||||||||
2004 - 2018 National Fire Incident Reporting System (NFIRS) incidents
- Incident types reported to NFIRS in Germantown, WI
- 5,12069.5%Rescue & EMS
- 7039.5%False Alarm
- 4776.5%Fire
- 4225.7%Hazardous Condition
- 3314.5%Good Intent Call
- 2733.7%Service Call
- 210.3%Overpressure Rupture
- 120.2%Special Incident
- 100.1%Severe Weather
- Fire incident types reported to NFIRS in Germantown, WI
- 24350.9%Structure Fires
- 12325.8%Outside Fires
- 9219.3%Mobile Property/Vehicle Fires
- 194.0%Other
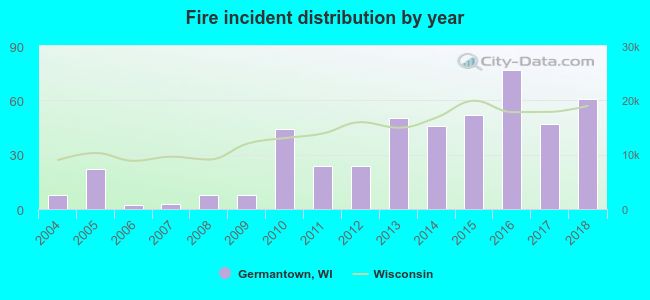 According to the data from the years 2004 - 2018 the average number of fire incidents per year is 32. The highest number of reported fires - 77 took place in 2016, and the least - 2 in 2006. The data has an increasing trend.
The average number of yearly fire incidents per 10k residents in Germantown, WI compared to nearest cities:
(Note: Based on data for the last 3 years, including only cities with population 5,000 and above)
| Germantown: | 31.0 |
| Menomonee Falls: | 22.0 |
| Richfield: | 20.9 |
| Jackson: | 27.4 |
| Sussex: | 23.0 |
| Lisbon: | 3.0 |
| Brown Deer: | 13.5 |
| Mequon: | 6.0 |
| Cedarburg: | 15.9 |
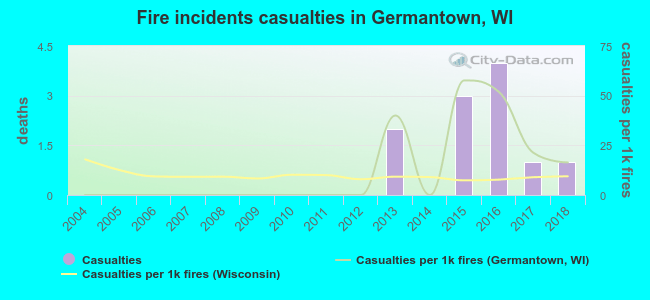 Based on the data from the years 2004 - 2018 the average number of fire-related yearly casualties is 1. The highest number of casualties - 4 took place in 2016, and the lowest - 0 in 2004. The data has a rising trend.
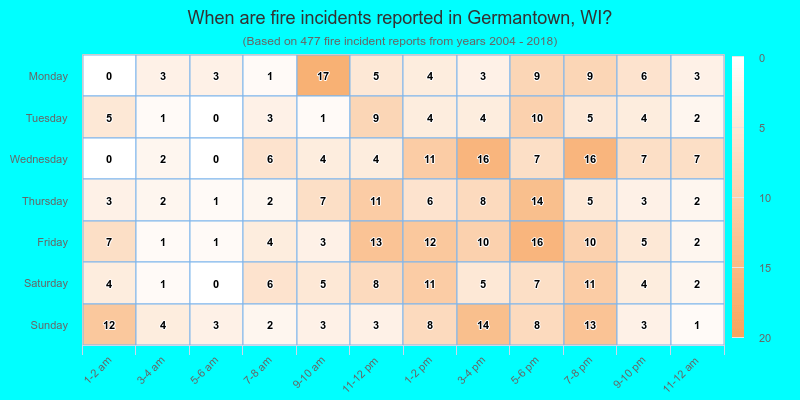
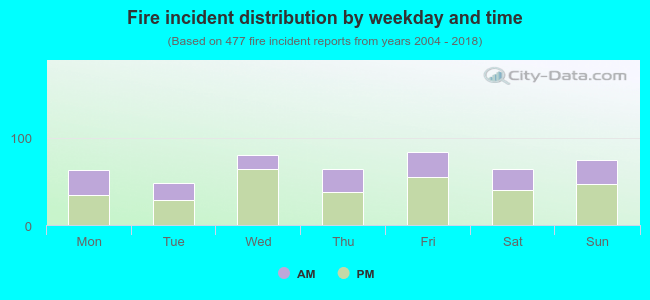 35.6% incidents where reported in the morning and 64.4% in the evening. The most fires (17.6%) took place on Friday, and the least (10.1%) on Tuesday.
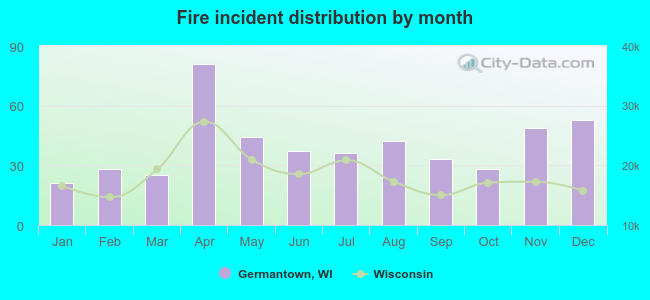 According to the 477 fire incident reports from years 2004 - 2018 most fires (17.0%) took place during April, and the least (4.4%) in January.
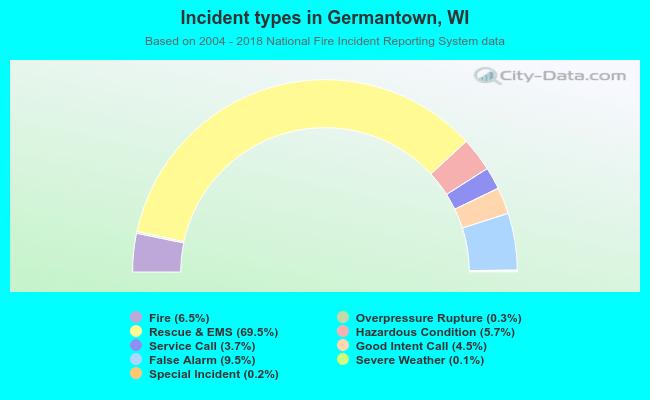 Out of all 7,369 cases reported during the years 2004 - 2018, the most belonged to the categories: Rescue & EMS (69.5%), False Alarm (9.5%), and Fire (6.5%).
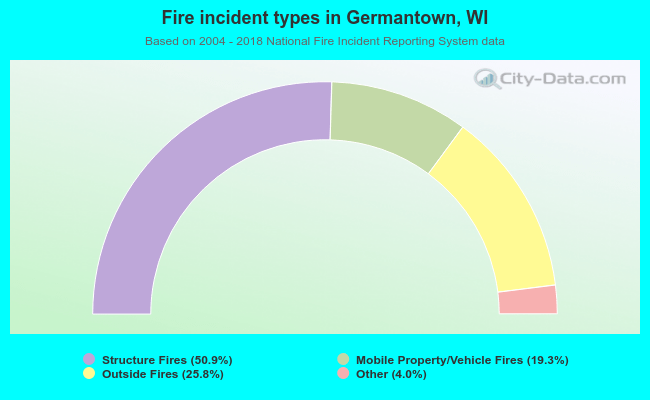 When looking into fire subcategories, the most incidents belonged to: Structure Fires (50.9%), and Outside Fires (25.8%).