Jackson: Fire Incidents, Wisconsin (WI)
Where are fire incidents reported in Jackson, WI
Something went wrong! Please refresh the page.
|
| |||||||||||||||||||||||||||||||||||||||||||||||||||||||||||||||||||||||||||||||||||||||||||||||||||||||||||||
2002 - 2018 National Fire Incident Reporting System (NFIRS) incidents
- Incident types reported to NFIRS in Jackson, WI
- 29431.3%Fire
- 21322.7%Hazardous Condition
- 17819.0%Rescue & EMS
- 15416.4%False Alarm
- 606.4%Good Intent Call
- 333.5%Service Call
- 40.4%Overpressure Rupture
- 10.1%Severe Weather
- 10.1%Special Incident
- Fire incident types reported to NFIRS in Jackson, WI
- 12040.8%Structure Fires
- 9632.7%Outside Fires
- 6221.1%Mobile Property/Vehicle Fires
- 165.4%Other
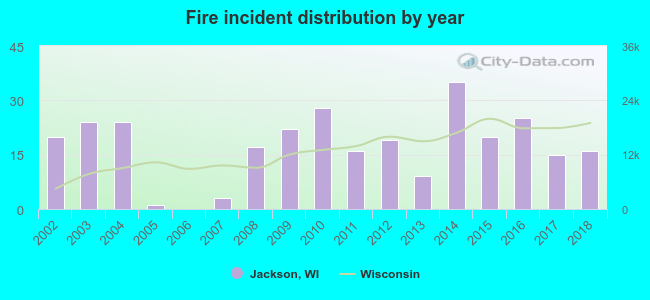 According to the data from the years 2002 - 2018 the average number of fires per year is 17. The highest number of reported fire incidents - 35 took place in 2014, and the least - 0 in 2006. The data has a declining trend.
The average number of yearly fire incidents per 10k residents in Jackson, WI compared to nearest cities:
(Note: Based on data for the last 3 years, including only cities with population 5,000 and above)
| Jackson: | 27.4 |
| Slinger: | 47.0 |
| West Bend: | 28.4 |
| Richfield: | 20.9 |
| Germantown: | 31.0 |
| Cedarburg: | 15.9 |
| Hartford: | 44.6 |
| Grafton: | 15.9 |
| Menomonee Falls: | 22.0 |
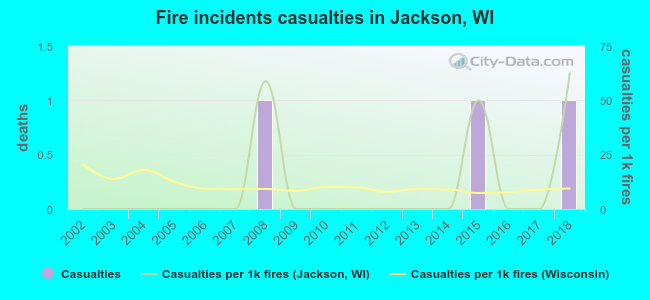 According to the reports from the years 2002 - 2018 the average number of fire-related casualties per year is 0. The highest number of injuries - 1 took place in 2008, and the lowest - 0 in 2002. The data has an increasing trend.
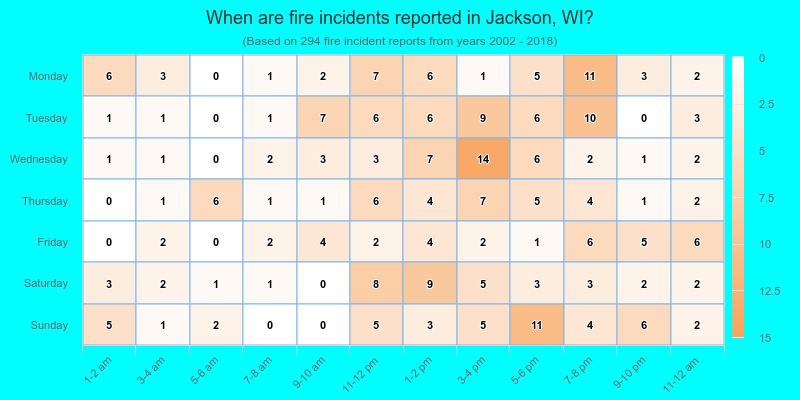
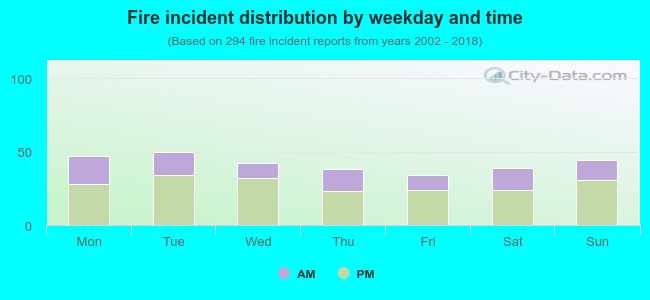 33.3% incidents where reported in the morning and 66.7% in the evening. The most fires (17.0%) took place on Tuesday, and the least (11.6%) on Friday.
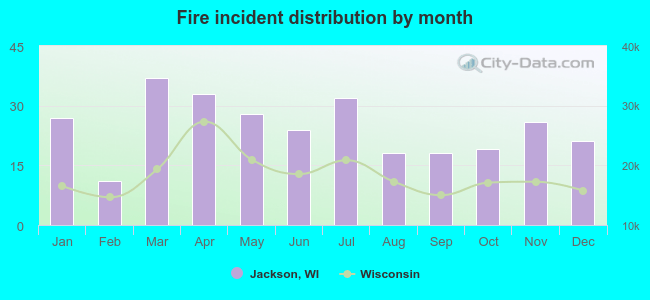 Based on the 294 reports from years 2002 - 2018 most fires (12.6%) took place during March, and the least (3.7%) in February.
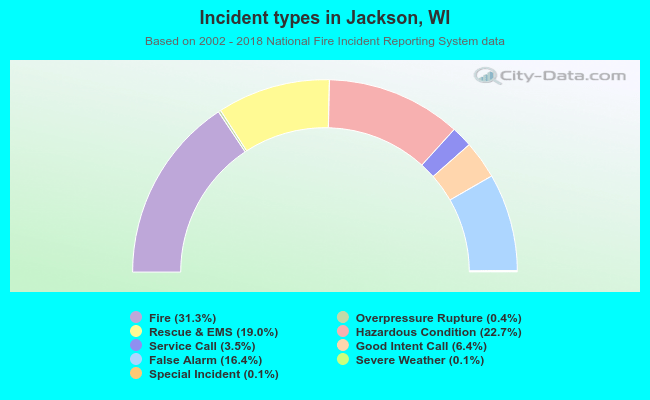 Out of all 938 cases reported during the years 2002 - 2018, the most belonged to the categories: Fire (31.3%), Hazardous Condition (22.7%), and Rescue & EMS (19.0%).
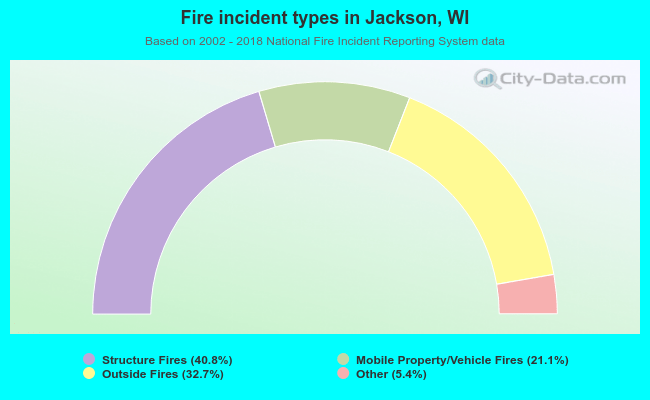 When looking into fire subcategories, the most reports belonged to: Structure Fires (40.8%), and Outside Fires (32.7%).