Laurel: Fire Incidents, Montana (MT)
Where are fire incidents reported in Laurel, MT
Something went wrong! Please refresh the page.
|
| |||||||||||||||||||||||||||||||||||||||||||||||||||||||||||||||||||||||||||||||||||||||||||||||||||||||||||||
| Other | 53 | |||||||||||||||||||||||||||||||||||||||||||||||||||||||||||||||||||||||||||||||||||||||||||||||||||||||||||||
2002 - 2018 National Fire Incident Reporting System (NFIRS) incidents
- Incident types reported to NFIRS in Laurel, MT
- 73541.1%Rescue & EMS
- 39322.0%Fire
- 25714.4%Hazardous Condition
- 1779.9%Good Intent Call
- 1769.8%False Alarm
- 352.0%Service Call
- 70.4%Overpressure Rupture
- 60.3%Special Incident
- 20.1%Severe Weather
- Fire incident types reported to NFIRS in Laurel, MT
- 23960.8%Outside Fires
- 9624.4%Structure Fires
- 4611.7%Mobile Property/Vehicle Fires
- 123.1%Other
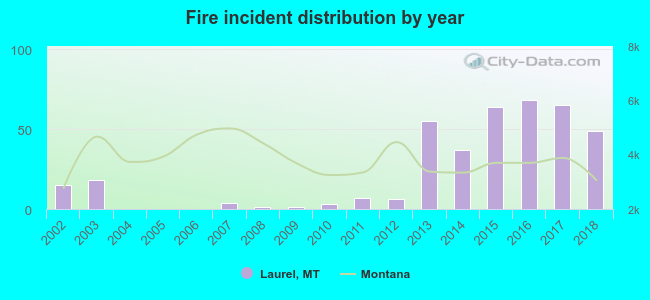 According to the data from the years 2002 - 2018 the average number of fires per year is 23. The highest number of fires - 68 took place in 2016, and the least - 0 in 2004. The data has a rising trend.
The average number of yearly fire incidents per 10k residents in Laurel, MT compared to nearest cities:
(Note: Based on data for the last 3 years, including only cities with population 5,000 and above)
| Laurel: | 87.5 |
| Billings: | 32.3 |
| Lockwood: | 3.9 |
| Livingston: | 98.5 |
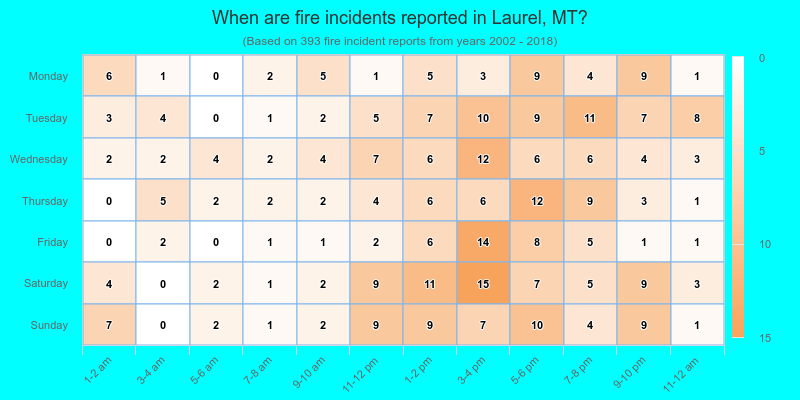
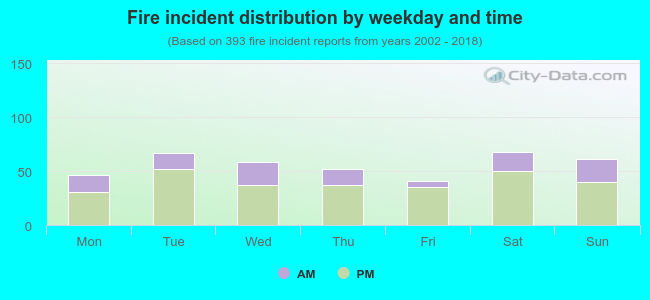 28.2% incidents where reported in the morning and 71.8% in the evening. The most fires (17.3%) took place on Saturday, and the least (10.4%) on Friday.
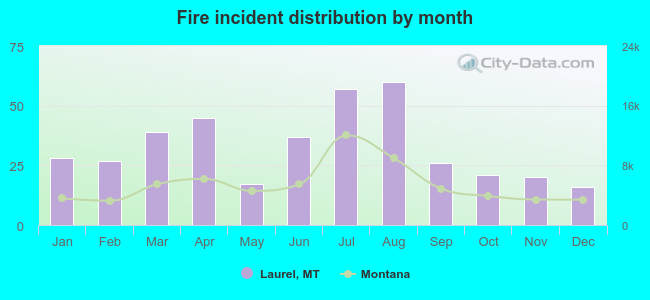 According to the 393 incident reports from years 2002 - 2018 most fires (15.3%) took place during August, and the least (4.1%) in December.
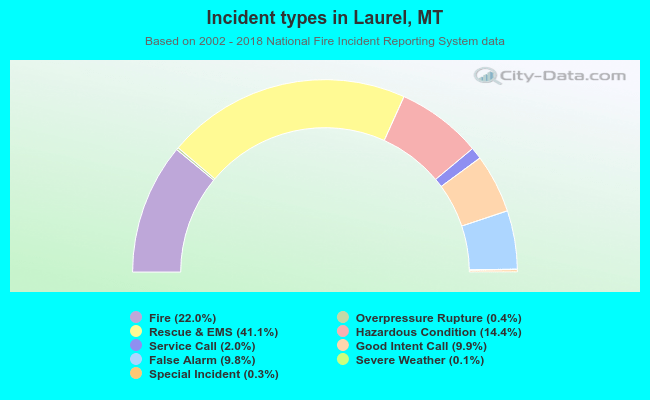 Out of all 1,788 cases reported during the years 2002 - 2018, the most belonged to the categories: Rescue & EMS (41.1%), Fire (22.0%), and Hazardous Condition (14.4%).
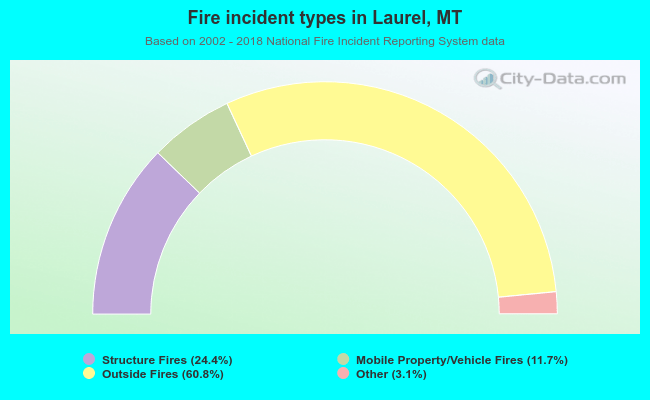 When looking into fire subcategories, the most incidents belonged to: Outside Fires (60.8%), and Structure Fires (24.4%).