Livingston: Fire Incidents, Montana (MT)
Where are fire incidents reported in Livingston, MT
Something went wrong! Please refresh the page.
|
| |||||||||||||||||||||||||||||||||||||||||||||||||||||||||||||||||||||||||||||||||||||||||||||||||||||||||||||
| Other | 335 | |||||||||||||||||||||||||||||||||||||||||||||||||||||||||||||||||||||||||||||||||||||||||||||||||||||||||||||
2002 - 2018 National Fire Incident Reporting System (NFIRS) incidents
- Incident types reported to NFIRS in Livingston, MT
- 5,36454.1%Rescue & EMS
- 1,47014.8%Hazardous Condition
- 1,35113.6%Fire
- 8388.4%Good Intent Call
- 7107.2%Service Call
- 1741.8%False Alarm
- Fire incident types reported to NFIRS in Livingston, MT
- 71953.2%Outside Fires
- 40730.1%Structure Fires
- 15211.3%Mobile Property/Vehicle Fires
- 735.4%Other
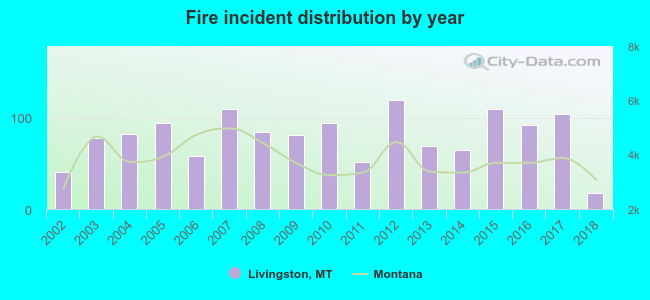 According to the data from the years 2002 - 2018 the average number of fires per year is 79. The highest number of fires - 119 took place in 2012, and the least - 18 in 2018. The data has a declining trend.
 The median response time based on all reported fire incidents is 8 minutes. This is similar to the Montana median value.
The median response time in Livingston, MT compared to nearest cities:
(Note: Based on data for all years, including only cities with at least 500 fire incidents)
| Livingston: | 8 minutes |
| Bozeman: | 11 minutes |
| Belgrade: | 11 minutes |
| Three Forks: | 17 minutes |
 27.2% incidents where reported in the morning and 72.8% in the evening. The most fires (15.5%) took place on Tuesday, and the least (12.1%) on Wednesday.
 Based on the 1,351 fires from years 2002 - 2018 most fires (19.5%) took place during July, and the least (5.6%) in October.
 Out of all 9,920 cases reported during the years 2002 - 2018, the most belonged to the categories: Rescue & EMS (54.1%), Hazardous Condition (14.8%), and Fire (13.6%).
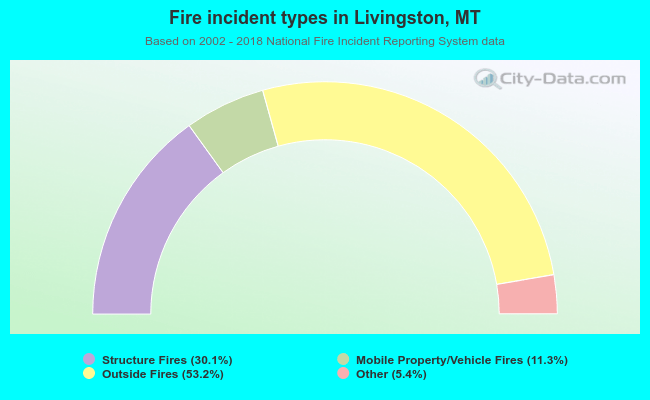 When looking into fire subcategories, the most reports belonged to: Outside Fires (53.2%), and Structure Fires (30.1%).