Billings: Fire Incidents, Montana (MT)
Where are fire incidents reported in Billings, MT
Something went wrong! Please refresh the page.
| Fire incidents reported | |
|---|---|
| Sreet name | Count |
| GRAND AVE | 280 |
| KING AVE | 242 |
| HIGHWAY 87 EAST | 234 |
| CENTRAL AVE | 218 |
| I90 | 198 |
| BROADWATER AVE | 188 |
| MAIN | 166 |
| 1 AVE | 130 |
| 28 | 102 |
| I-90 | 102 |
| LEWIS AVE | 102 |
| OLD HARDIN RD | 98 |
| 27 | 96 |
| BILLINGS BLVD | 96 |
| 29 | 92 |
| 30 | 92 |
| CUSTER AVE | 90 |
| LAKE ELMO DR | 88 |
| 24 | 82 |
| FRONTAGE RD | 80 |
| JACKSON | 80 |
| MAIN ST | 80 |
| MONTANA AVE | 80 |
| RIMROCK RD | 80 |
| MONAD RD | 74 |
| 32 | 72 |
| JELLISON RD | 72 |
| MINNESOTA AVE | 72 |
| SHILOH RD | 72 |
| 4 AVE | 70 |
| Other | 3,531 |
2002 - 2018 National Fire Incident Reporting System (NFIRS) incidents
- Incident types reported to NFIRS in Billings, MT
- 37,11649.4%Rescue & EMS
- 17,36123.1%Good Intent Call
- 7,0599.4%Fire
- 5,0176.7%Service Call
- 4,8386.4%Hazardous Condition
- 3,6324.8%False Alarm
- Fire incident types reported to NFIRS in Billings, MT
- 3,40748.3%Outside Fires
- 1,77025.1%Structure Fires
- 1,10315.6%Mobile Property/Vehicle Fires
- 77911.0%Other
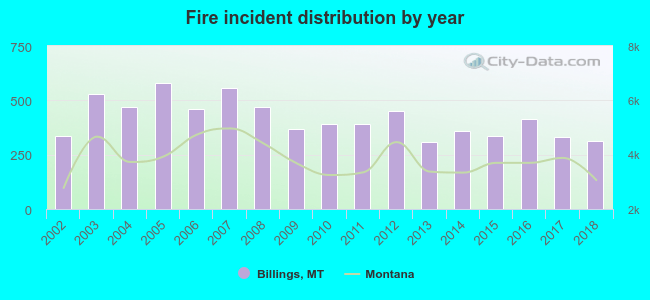 Based on the data from the years 2002 - 2018 the average number of fires per year is 415. The highest number of fire incidents - 580 took place in 2005, and the least - 306 in 2013. The data has a declining trend.
 The median response time based on all reported fire incidents is 6 minutes. This is lower compared to the Montana median value.
The median response time in Billings, MT compared to nearest cities:
(Note: Based on data for all years, including only cities with at least 500 fire incidents)
| Billings: | 6 minutes |
| Hardin: | 15 minutes |
 Based on the reports from the years 2002 - 2018 the average number of fire-related fatalities per year is 1. The highest number of deaths - 4 took place in 2005, and the lowest - 0 in 2006. The data has a constant trend.
The average number of deaths per 1,000 fires is 4. This indicator was the highest - 8 in 2014, and the lowest 0 in 2006. The trend for fatalities per 1,000 incidents is rising. Compared to the state value the number of fatalities per 1,000 incidents is higher.
Based on the reports from the years 2002 - 2018 the average number of fire-related fatalities per year is 1. The highest number of deaths - 4 took place in 2005, and the lowest - 0 in 2006. The data has a constant trend.
The average number of deaths per 1,000 fires is 4. This indicator was the highest - 8 in 2014, and the lowest 0 in 2006. The trend for fatalities per 1,000 incidents is rising. Compared to the state value the number of fatalities per 1,000 incidents is higher.Deaths per 1,000 incidents in Billings, MT compared to nearest cities:
(Note: Based on data for all years, including only cities with at least 2,500 fire incidents)
| Billings: | 3.5 |
 Based on the data from the years 2002 - 2018 the average number of fire-related casualties per year is 9. The highest number of reported injuries - 17 took place in 2012, and the lowest - 0 in 2014. The data has a rising trend.
The average number of casualties per 1,000 fire incidents is 21. This indicator was the highest - 41 in 2011, and the lowest 0 in 2014. The trend for casualties per 1,000 fires is rising. Compared to the Montana value the number of casualties per 1,000 incidents is much higher.
Based on the data from the years 2002 - 2018 the average number of fire-related casualties per year is 9. The highest number of reported injuries - 17 took place in 2012, and the lowest - 0 in 2014. The data has a rising trend.
The average number of casualties per 1,000 fire incidents is 21. This indicator was the highest - 41 in 2011, and the lowest 0 in 2014. The trend for casualties per 1,000 fires is rising. Compared to the Montana value the number of casualties per 1,000 incidents is much higher.Casualties per 1,000 incidents in Billings, MT compared to nearest cities:
(Note: Based on data for all years, including only cities with at least 500 fire incidents)
| Billings: | 21.0 |
| Hardin: | 3.5 |
 32.6% incidents where reported in the morning and 67.4% in the evening. The most fires (15.4%) took place on Saturday, and the least (13.5%) on Thursday.
 Based on the 7,059 incident reports from years 2002 - 2018 most fires (16.6%) took place during July, and the least (5.2%) in January.
 Out of all 75,122 cases reported during the years 2002 - 2018, the most belonged to the categories: Rescue & EMS (49.4%), Good Intent Call (23.1%), and Fire (9.4%).
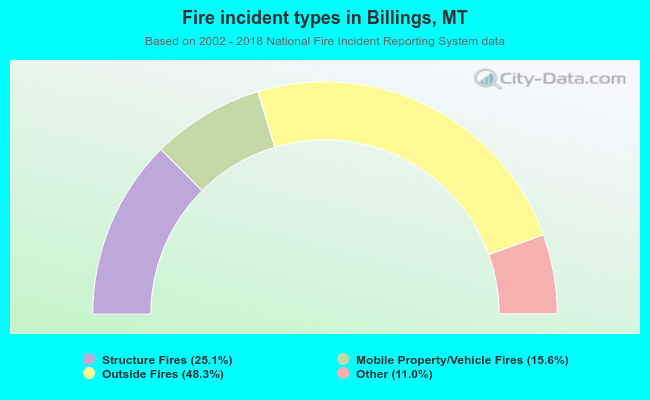 When looking into fire subcategories, the most reports belonged to: Outside Fires (48.3%), and Structure Fires (25.1%).