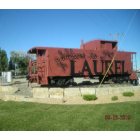
Laurel, Montana Submit your own pictures of this city and show them to the world
OSM Map
General Map
Google Map
MSN Map
OSM Map
General Map
Google Map
MSN Map
OSM Map
General Map
Google Map
MSN Map
OSM Map
General Map
Google Map
MSN Map
Please wait while loading the map...
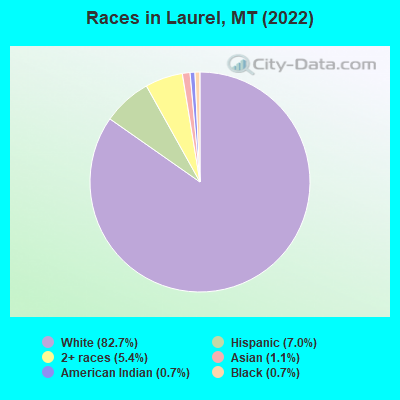
Population in 2022: 7,203 (100% urban, 0% rural). Population change since 2000: +15.2%Males: 3,621 Females: 3,582
March 2022 cost of living index in Laurel: 89.1 (less than average, U.S. average is 100) Percentage of residents living in poverty in 2022: 11.2%for White Non-Hispanic residents , 4.2% for Hispanic or Latino residents , 100.0% for other race residents , 13.2% for two or more races residents )
Profiles of local businesses
Business Search - 14 Million verified businesses
Data:
Median household income ($)
Median household income (% change since 2000)
Household income diversity
Ratio of average income to average house value (%)
Ratio of average income to average rent
Median household income ($) - White
Median household income ($) - Black or African American
Median household income ($) - Asian
Median household income ($) - Hispanic or Latino
Median household income ($) - American Indian and Alaska Native
Median household income ($) - Multirace
Median household income ($) - Other Race
Median household income for houses/condos with a mortgage ($)
Median household income for apartments without a mortgage ($)
Races - White alone (%)
Races - White alone (% change since 2000)
Races - Black alone (%)
Races - Black alone (% change since 2000)
Races - American Indian alone (%)
Races - American Indian alone (% change since 2000)
Races - Asian alone (%)
Races - Asian alone (% change since 2000)
Races - Hispanic (%)
Races - Hispanic (% change since 2000)
Races - Native Hawaiian and Other Pacific Islander alone (%)
Races - Native Hawaiian and Other Pacific Islander alone (% change since 2000)
Races - Two or more races (%)
Races - Two or more races (% change since 2000)
Races - Other race alone (%)
Races - Other race alone (% change since 2000)
Racial diversity
Unemployment (%)
Unemployment (% change since 2000)
Unemployment (%) - White
Unemployment (%) - Black or African American
Unemployment (%) - Asian
Unemployment (%) - Hispanic or Latino
Unemployment (%) - American Indian and Alaska Native
Unemployment (%) - Multirace
Unemployment (%) - Other Race
Population density (people per square mile)
Population - Males (%)
Population - Females (%)
Population - Males (%) - White
Population - Males (%) - Black or African American
Population - Males (%) - Asian
Population - Males (%) - Hispanic or Latino
Population - Males (%) - American Indian and Alaska Native
Population - Males (%) - Multirace
Population - Males (%) - Other Race
Population - Females (%) - White
Population - Females (%) - Black or African American
Population - Females (%) - Asian
Population - Females (%) - Hispanic or Latino
Population - Females (%) - American Indian and Alaska Native
Population - Females (%) - Multirace
Population - Females (%) - Other Race
Coronavirus confirmed cases (May 02, 2024)
Deaths caused by coronavirus (May 02, 2024)
Coronavirus confirmed cases (per 100k population) (May 02, 2024)
Deaths caused by coronavirus (per 100k population) (May 02, 2024)
Daily increase in number of cases (May 02, 2024)
Weekly increase in number of cases (May 02, 2024)
Cases doubled (in days) (May 02, 2024)
Hospitalized patients (Apr 18, 2022)
Negative test results (Apr 18, 2022)
Total test results (Apr 18, 2022)
COVID Vaccine doses distributed (per 100k population) (Sep 19, 2023)
COVID Vaccine doses administered (per 100k population) (Sep 19, 2023)
COVID Vaccine doses distributed (Sep 19, 2023)
COVID Vaccine doses administered (Sep 19, 2023)
Likely homosexual households (%)
Likely homosexual households (% change since 2000)
Likely homosexual households - Lesbian couples (%)
Likely homosexual households - Lesbian couples (% change since 2000)
Likely homosexual households - Gay men (%)
Likely homosexual households - Gay men (% change since 2000)
Cost of living index
Median gross rent ($)
Median contract rent ($)
Median monthly housing costs ($)
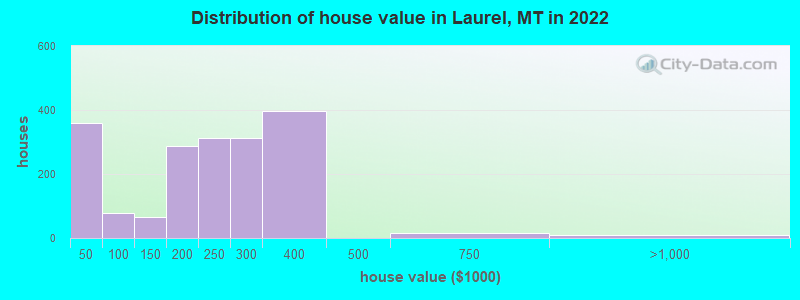
Median house or condo value ($)
Median house or condo value ($ change since 2000)
Mean house or condo value by units in structure - 1, detached ($)
Mean house or condo value by units in structure - 1, attached ($)
Mean house or condo value by units in structure - 2 ($)
Mean house or condo value by units in structure by units in structure - 3 or 4 ($)
Mean house or condo value by units in structure - 5 or more ($)
Mean house or condo value by units in structure - Boat, RV, van, etc. ($)
Mean house or condo value by units in structure - Mobile home ($)
Median house or condo value ($) - White
Median house or condo value ($) - Black or African American
Median house or condo value ($) - Asian
Median house or condo value ($) - Hispanic or Latino
Median house or condo value ($) - American Indian and Alaska Native
Median house or condo value ($) - Multirace
Median house or condo value ($) - Other Race
Median resident age
Resident age diversity
Median resident age - Males
Median resident age - Females
Median resident age - White
Median resident age - Black or African American
Median resident age - Asian
Median resident age - Hispanic or Latino
Median resident age - American Indian and Alaska Native
Median resident age - Multirace
Median resident age - Other Race
Median resident age - Males - White
Median resident age - Males - Black or African American
Median resident age - Males - Asian
Median resident age - Males - Hispanic or Latino
Median resident age - Males - American Indian and Alaska Native
Median resident age - Males - Multirace
Median resident age - Males - Other Race
Median resident age - Females - White
Median resident age - Females - Black or African American
Median resident age - Females - Asian
Median resident age - Females - Hispanic or Latino
Median resident age - Females - American Indian and Alaska Native
Median resident age - Females - Multirace
Median resident age - Females - Other Race
Commute - mean travel time to work (minutes)
Travel time to work - Less than 5 minutes (%)
Travel time to work - Less than 5 minutes (% change since 2000)
Travel time to work - 5 to 9 minutes (%)
Travel time to work - 5 to 9 minutes (% change since 2000)
Travel time to work - 10 to 19 minutes (%)
Travel time to work - 10 to 19 minutes (% change since 2000)
Travel time to work - 20 to 29 minutes (%)
Travel time to work - 20 to 29 minutes (% change since 2000)
Travel time to work - 30 to 39 minutes (%)
Travel time to work - 30 to 39 minutes (% change since 2000)
Travel time to work - 40 to 59 minutes (%)
Travel time to work - 40 to 59 minutes (% change since 2000)
Travel time to work - 60 to 89 minutes (%)
Travel time to work - 60 to 89 minutes (% change since 2000)
Travel time to work - 90 or more minutes (%)
Travel time to work - 90 or more minutes (% change since 2000)
Marital status - Never married (%)
Marital status - Now married (%)
Marital status - Separated (%)
Marital status - Widowed (%)
Marital status - Divorced (%)
Median family income ($)
Median family income (% change since 2000)
Median non-family income ($)
Median non-family income (% change since 2000)
Median per capita income ($)
Median per capita income (% change since 2000)
Median family income ($) - White
Median family income ($) - Black or African American
Median family income ($) - Asian
Median family income ($) - Hispanic or Latino
Median family income ($) - American Indian and Alaska Native
Median family income ($) - Multirace
Median family income ($) - Other Race
Median year house/condo built
Median year apartment built
Year house built - Built 2005 or later (%)
Year house built - Built 2000 to 2004 (%)
Year house built - Built 1990 to 1999 (%)
Year house built - Built 1980 to 1989 (%)
Year house built - Built 1970 to 1979 (%)
Year house built - Built 1960 to 1969 (%)
Year house built - Built 1950 to 1959 (%)
Year house built - Built 1940 to 1949 (%)
Year house built - Built 1939 or earlier (%)
Average household size
Household density (households per square mile)
Average household size - White
Average household size - Black or African American
Average household size - Asian
Average household size - Hispanic or Latino
Average household size - American Indian and Alaska Native
Average household size - Multirace
Average household size - Other Race
Occupied housing units (%)
Vacant housing units (%)
Owner occupied housing units (%)
Renter occupied housing units (%)
Vacancy status - For rent (%)
Vacancy status - For sale only (%)
Vacancy status - Rented or sold, not occupied (%)
Vacancy status - For seasonal, recreational, or occasional use (%)
Vacancy status - For migrant workers (%)
Vacancy status - Other vacant (%)
Residents with income below the poverty level (%)
Residents with income below 50% of the poverty level (%)
Children below poverty level (%)
Poor families by family type - Married-couple family (%)
Poor families by family type - Male, no wife present (%)
Poor families by family type - Female, no husband present (%)
Poverty status for native-born residents (%)
Poverty status for foreign-born residents (%)
Poverty among high school graduates not in families (%)
Poverty among people who did not graduate high school not in families (%)
Residents with income below the poverty level (%) - White
Residents with income below the poverty level (%) - Black or African American
Residents with income below the poverty level (%) - Asian
Residents with income below the poverty level (%) - Hispanic or Latino
Residents with income below the poverty level (%) - American Indian and Alaska Native
Residents with income below the poverty level (%) - Multirace
Residents with income below the poverty level (%) - Other Race
Air pollution - Air Quality Index (AQI)
Air pollution - CO
Air pollution - NO2
Air pollution - SO2
Air pollution - Ozone
Air pollution - PM10
Air pollution - PM25
Air pollution - Pb
Crime - Murders per 100,000 population
Crime - Rapes per 100,000 population
Crime - Robberies per 100,000 population
Crime - Assaults per 100,000 population
Crime - Burglaries per 100,000 population
Crime - Thefts per 100,000 population
Crime - Auto thefts per 100,000 population
Crime - Arson per 100,000 population
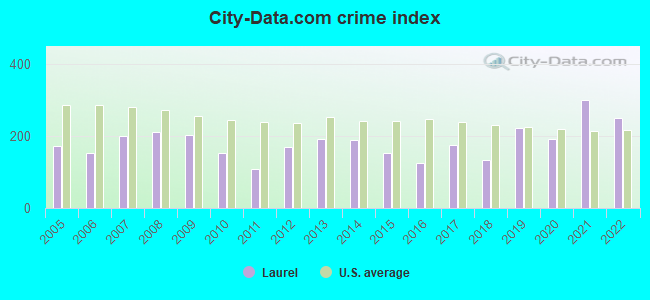
Crime - City-data.com crime index
Crime - Violent crime index
Crime - Property crime index
Crime - Murders per 100,000 population (5 year average)
Crime - Rapes per 100,000 population (5 year average)
Crime - Robberies per 100,000 population (5 year average)
Crime - Assaults per 100,000 population (5 year average)
Crime - Burglaries per 100,000 population (5 year average)
Crime - Thefts per 100,000 population (5 year average)
Crime - Auto thefts per 100,000 population (5 year average)
Crime - Arson per 100,000 population (5 year average)
Crime - City-data.com crime index (5 year average)
Crime - Violent crime index (5 year average)
Crime - Property crime index (5 year average)
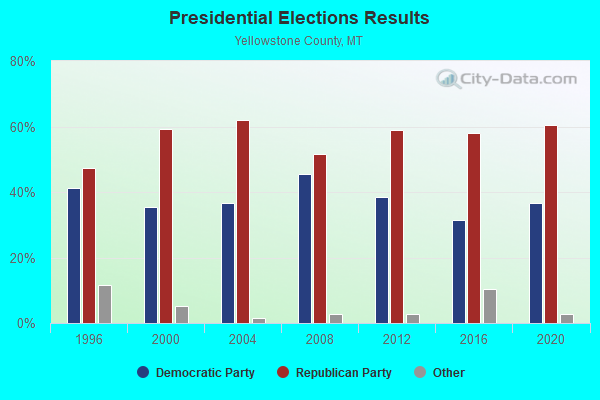
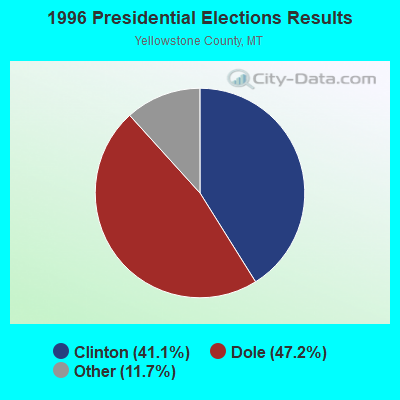
1996 Presidential Elections Results (%) - Democratic Party (Clinton)
1996 Presidential Elections Results (%) - Republican Party (Dole)
1996 Presidential Elections Results (%) - Other
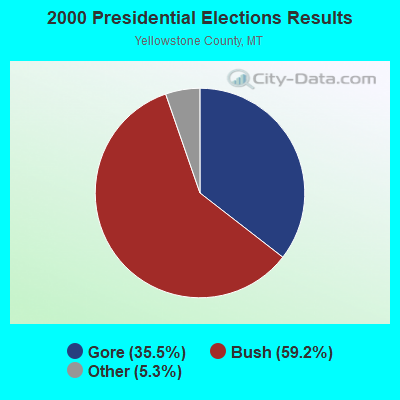
2000 Presidential Elections Results (%) - Democratic Party (Gore)
2000 Presidential Elections Results (%) - Republican Party (Bush)
2000 Presidential Elections Results (%) - Other
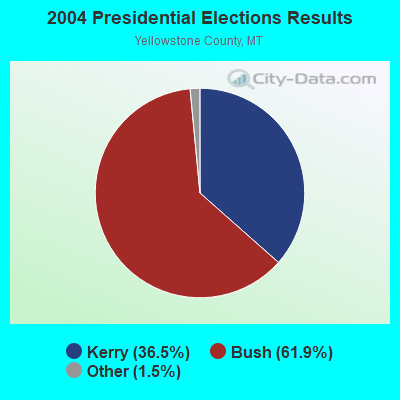
2004 Presidential Elections Results (%) - Democratic Party (Kerry)
2004 Presidential Elections Results (%) - Republican Party (Bush)
2004 Presidential Elections Results (%) - Other
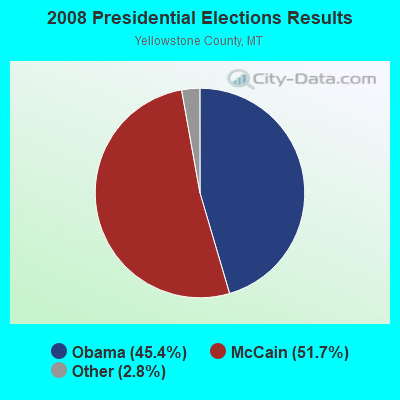
2008 Presidential Elections Results (%) - Democratic Party (Obama)
2008 Presidential Elections Results (%) - Republican Party (McCain)
2008 Presidential Elections Results (%) - Other
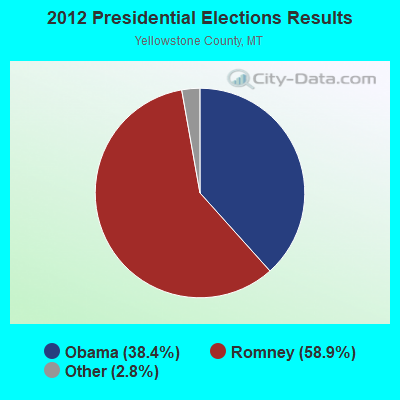
2012 Presidential Elections Results (%) - Democratic Party (Obama)
2012 Presidential Elections Results (%) - Republican Party (Romney)
2012 Presidential Elections Results (%) - Other
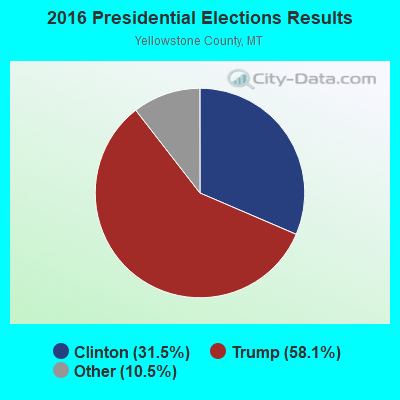
2016 Presidential Elections Results (%) - Democratic Party (Clinton)
2016 Presidential Elections Results (%) - Republican Party (Trump)
2016 Presidential Elections Results (%) - Other
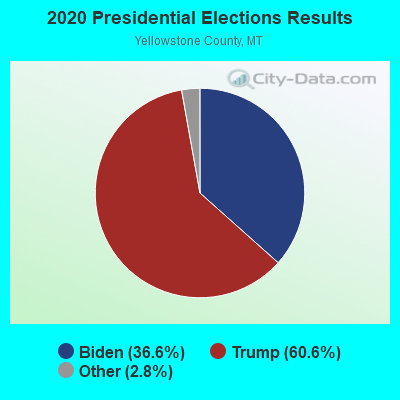
2020 Presidential Elections Results (%) - Democratic Party (Biden)
2020 Presidential Elections Results (%) - Republican Party (Trump)
2020 Presidential Elections Results (%) - Other
Ancestries Reported - Arab (%)
Ancestries Reported - Czech (%)
Ancestries Reported - Danish (%)
Ancestries Reported - Dutch (%)
Ancestries Reported - English (%)
Ancestries Reported - French (%)
Ancestries Reported - French Canadian (%)
Ancestries Reported - German (%)
Ancestries Reported - Greek (%)
Ancestries Reported - Hungarian (%)
Ancestries Reported - Irish (%)
Ancestries Reported - Italian (%)
Ancestries Reported - Lithuanian (%)
Ancestries Reported - Norwegian (%)
Ancestries Reported - Polish (%)
Ancestries Reported - Portuguese (%)
Ancestries Reported - Russian (%)
Ancestries Reported - Scotch-Irish (%)
Ancestries Reported - Scottish (%)
Ancestries Reported - Slovak (%)
Ancestries Reported - Subsaharan African (%)
Ancestries Reported - Swedish (%)
Ancestries Reported - Swiss (%)
Ancestries Reported - Ukrainian (%)
Ancestries Reported - United States (%)
Ancestries Reported - Welsh (%)
Ancestries Reported - West Indian (%)
Ancestries Reported - Other (%)
Educational Attainment - No schooling completed (%)
Educational Attainment - Less than high school (%)
Educational Attainment - High school or equivalent (%)
Educational Attainment - Less than 1 year of college (%)
Educational Attainment - 1 or more years of college (%)
Educational Attainment - Associate degree (%)
Educational Attainment - Bachelor's degree (%)
Educational Attainment - Master's degree (%)
Educational Attainment - Professional school degree (%)
Educational Attainment - Doctorate degree (%)
School Enrollment - Nursery, preschool (%)
School Enrollment - Kindergarten (%)
School Enrollment - Grade 1 to 4 (%)
School Enrollment - Grade 5 to 8 (%)
School Enrollment - Grade 9 to 12 (%)
School Enrollment - College undergrad (%)
School Enrollment - Graduate or professional (%)
School Enrollment - Not enrolled in school (%)
School enrollment - Public schools (%)
School enrollment - Private schools (%)
School enrollment - Not enrolled (%)
Median number of rooms in houses and condos
Median number of rooms in apartments
Housing units lacking complete plumbing facilities (%)
Housing units lacking complete kitchen facilities (%)
Density of houses
Urban houses (%)
Rural houses (%)
Households with people 60 years and over (%)
Households with people 65 years and over (%)
Households with people 75 years and over (%)
Households with one or more nonrelatives (%)
Households with no nonrelatives (%)
Population in households (%)
Family households (%)
Nonfamily households (%)
Population in families (%)
Family households with own children (%)
Median number of bedrooms in owner occupied houses
Mean number of bedrooms in owner occupied houses
Median number of bedrooms in renter occupied houses
Mean number of bedrooms in renter occupied houses
Median number of vehichles in owner occupied houses
Mean number of vehichles in owner occupied houses
Median number of vehichles in renter occupied houses
Mean number of vehichles in renter occupied houses
Mortgage status - with mortgage (%)
Mortgage status - with second mortgage (%)
Mortgage status - with home equity loan (%)
Mortgage status - with both second mortgage and home equity loan (%)
Mortgage status - without a mortgage (%)
Average family size
Average family size - White
Average family size - Black or African American
Average family size - Asian
Average family size - Hispanic or Latino
Average family size - American Indian and Alaska Native
Average family size - Multirace
Average family size - Other Race
Geographical mobility - Same house 1 year ago (%)
Geographical mobility - Moved within same county (%)
Geographical mobility - Moved from different county within same state (%)
Geographical mobility - Moved from different state (%)
Geographical mobility - Moved from abroad (%)
Place of birth - Born in state of residence (%)
Place of birth - Born in other state (%)
Place of birth - Native, outside of US (%)
Place of birth - Foreign born (%)
Housing units in structures - 1, detached (%)
Housing units in structures - 1, attached (%)
Housing units in structures - 2 (%)
Housing units in structures - 3 or 4 (%)
Housing units in structures - 5 to 9 (%)
Housing units in structures - 10 to 19 (%)
Housing units in structures - 20 to 49 (%)
Housing units in structures - 50 or more (%)
Housing units in structures - Mobile home (%)
Housing units in structures - Boat, RV, van, etc. (%)
House/condo owner moved in on average (years ago)
Renter moved in on average (years ago)
Year householder moved into unit - Moved in 1999 to March 2000 (%)
Year householder moved into unit - Moved in 1995 to 1998 (%)
Year householder moved into unit - Moved in 1990 to 1994 (%)
Year householder moved into unit - Moved in 1980 to 1989 (%)
Year householder moved into unit - Moved in 1970 to 1979 (%)
Year householder moved into unit - Moved in 1969 or earlier (%)
Means of transportation to work - Drove car alone (%)
Means of transportation to work - Carpooled (%)
Means of transportation to work - Public transportation (%)
Means of transportation to work - Bus or trolley bus (%)
Means of transportation to work - Streetcar or trolley car (%)
Means of transportation to work - Subway or elevated (%)
Means of transportation to work - Railroad (%)
Means of transportation to work - Ferryboat (%)
Means of transportation to work - Taxicab (%)
Means of transportation to work - Motorcycle (%)
Means of transportation to work - Bicycle (%)
Means of transportation to work - Walked (%)
Means of transportation to work - Other means (%)
Working at home (%)
Industry diversity
Most Common Industries - Agriculture, forestry, fishing and hunting, and mining (%)
Most Common Industries - Agriculture, forestry, fishing and hunting (%)
Most Common Industries - Mining, quarrying, and oil and gas extraction (%)
Most Common Industries - Construction (%)
Most Common Industries - Manufacturing (%)
Most Common Industries - Wholesale trade (%)
Most Common Industries - Retail trade (%)
Most Common Industries - Transportation and warehousing, and utilities (%)
Most Common Industries - Transportation and warehousing (%)
Most Common Industries - Utilities (%)
Most Common Industries - Information (%)
Most Common Industries - Finance and insurance, and real estate and rental and leasing (%)
Most Common Industries - Finance and insurance (%)
Most Common Industries - Real estate and rental and leasing (%)
Most Common Industries - Professional, scientific, and management, and administrative and waste management services (%)
Most Common Industries - Professional, scientific, and technical services (%)
Most Common Industries - Management of companies and enterprises (%)
Most Common Industries - Administrative and support and waste management services (%)
Most Common Industries - Educational services, and health care and social assistance (%)
Most Common Industries - Educational services (%)
Most Common Industries - Health care and social assistance (%)
Most Common Industries - Arts, entertainment, and recreation, and accommodation and food services (%)
Most Common Industries - Arts, entertainment, and recreation (%)
Most Common Industries - Accommodation and food services (%)
Most Common Industries - Other services, except public administration (%)
Most Common Industries - Public administration (%)
Occupation diversity
Most Common Occupations - Management, business, science, and arts occupations (%)
Most Common Occupations - Management, business, and financial occupations (%)
Most Common Occupations - Management occupations (%)
Most Common Occupations - Business and financial operations occupations (%)
Most Common Occupations - Computer, engineering, and science occupations (%)
Most Common Occupations - Computer and mathematical occupations (%)
Most Common Occupations - Architecture and engineering occupations (%)
Most Common Occupations - Life, physical, and social science occupations (%)
Most Common Occupations - Education, legal, community service, arts, and media occupations (%)
Most Common Occupations - Community and social service occupations (%)
Most Common Occupations - Legal occupations (%)
Most Common Occupations - Education, training, and library occupations (%)
Most Common Occupations - Arts, design, entertainment, sports, and media occupations (%)
Most Common Occupations - Healthcare practitioners and technical occupations (%)
Most Common Occupations - Health diagnosing and treating practitioners and other technical occupations (%)
Most Common Occupations - Health technologists and technicians (%)
Most Common Occupations - Service occupations (%)
Most Common Occupations - Healthcare support occupations (%)
Most Common Occupations - Protective service occupations (%)
Most Common Occupations - Fire fighting and prevention, and other protective service workers including supervisors (%)
Most Common Occupations - Law enforcement workers including supervisors (%)
Most Common Occupations - Food preparation and serving related occupations (%)
Most Common Occupations - Building and grounds cleaning and maintenance occupations (%)
Most Common Occupations - Personal care and service occupations (%)
Most Common Occupations - Sales and office occupations (%)
Most Common Occupations - Sales and related occupations (%)
Most Common Occupations - Office and administrative support occupations (%)
Most Common Occupations - Natural resources, construction, and maintenance occupations (%)
Most Common Occupations - Farming, fishing, and forestry occupations (%)
Most Common Occupations - Construction and extraction occupations (%)
Most Common Occupations - Installation, maintenance, and repair occupations (%)
Most Common Occupations - Production, transportation, and material moving occupations (%)
Most Common Occupations - Production occupations (%)
Most Common Occupations - Transportation occupations (%)
Most Common Occupations - Material moving occupations (%)
People in Group quarters - Institutionalized population (%)
People in Group quarters - Correctional institutions (%)
People in Group quarters - Federal prisons and detention centers (%)
People in Group quarters - Halfway houses (%)
People in Group quarters - Local jails and other confinement facilities (including police lockups) (%)
People in Group quarters - Military disciplinary barracks (%)
People in Group quarters - State prisons (%)
People in Group quarters - Other types of correctional institutions (%)
People in Group quarters - Nursing homes (%)
People in Group quarters - Hospitals/wards, hospices, and schools for the handicapped (%)
People in Group quarters - Hospitals/wards and hospices for chronically ill (%)
People in Group quarters - Hospices or homes for chronically ill (%)
People in Group quarters - Military hospitals or wards for chronically ill (%)
People in Group quarters - Other hospitals or wards for chronically ill (%)
People in Group quarters - Hospitals or wards for drug/alcohol abuse (%)
People in Group quarters - Mental (Psychiatric) hospitals or wards (%)
People in Group quarters - Schools, hospitals, or wards for the mentally retarded (%)
People in Group quarters - Schools, hospitals, or wards for the physically handicapped (%)
People in Group quarters - Institutions for the deaf (%)
People in Group quarters - Institutions for the blind (%)
People in Group quarters - Orthopedic wards and institutions for the physically handicapped (%)
People in Group quarters - Wards in general hospitals for patients who have no usual home elsewhere (%)
People in Group quarters - Wards in military hospitals for patients who have no usual home elsewhere (%)
People in Group quarters - Juvenile institutions (%)
People in Group quarters - Long-term care (%)
People in Group quarters - Homes for abused, dependent, and neglected children (%)
People in Group quarters - Residential treatment centers for emotionally disturbed children (%)
People in Group quarters - Training schools for juvenile delinquents (%)
People in Group quarters - Short-term care, detention or diagnostic centers for delinquent children (%)
People in Group quarters - Type of juvenile institution unknown (%)
People in Group quarters - Noninstitutionalized population (%)
People in Group quarters - College dormitories (includes college quarters off campus) (%)
People in Group quarters - Military quarters (%)
People in Group quarters - On base (%)
People in Group quarters - Barracks, unaccompanied personnel housing (UPH), (Enlisted/Officer), ;and similar group living quarters for military personnel (%)
People in Group quarters - Transient quarters for temporary residents (%)
People in Group quarters - Military ships (%)
People in Group quarters - Group homes (%)
People in Group quarters - Homes or halfway houses for drug/alcohol abuse (%)
People in Group quarters - Homes for the mentally ill (%)
People in Group quarters - Homes for the mentally retarded (%)
People in Group quarters - Homes for the physically handicapped (%)
People in Group quarters - Other group homes (%)
People in Group quarters - Religious group quarters (%)
People in Group quarters - Dormitories (%)
People in Group quarters - Agriculture workers' dormitories on farms (%)
People in Group quarters - Job Corps and vocational training facilities (%)
People in Group quarters - Other workers' dormitories (%)
People in Group quarters - Crews of maritime vessels (%)
People in Group quarters - Other nonhousehold living situations (%)
People in Group quarters - Other noninstitutional group quarters (%)
Residents speaking English at home (%)
Residents speaking English at home - Born in the United States (%)
Residents speaking English at home - Native, born elsewhere (%)
Residents speaking English at home - Foreign born (%)
Residents speaking Spanish at home (%)
Residents speaking Spanish at home - Born in the United States (%)
Residents speaking Spanish at home - Native, born elsewhere (%)
Residents speaking Spanish at home - Foreign born (%)
Residents speaking other language at home (%)
Residents speaking other language at home - Born in the United States (%)
Residents speaking other language at home - Native, born elsewhere (%)
Residents speaking other language at home - Foreign born (%)
Class of Workers - Employee of private company (%)
Class of Workers - Self-employed in own incorporated business (%)
Class of Workers - Private not-for-profit wage and salary workers (%)
Class of Workers - Local government workers (%)
Class of Workers - State government workers (%)
Class of Workers - Federal government workers (%)
Class of Workers - Self-employed workers in own not incorporated business and Unpaid family workers (%)
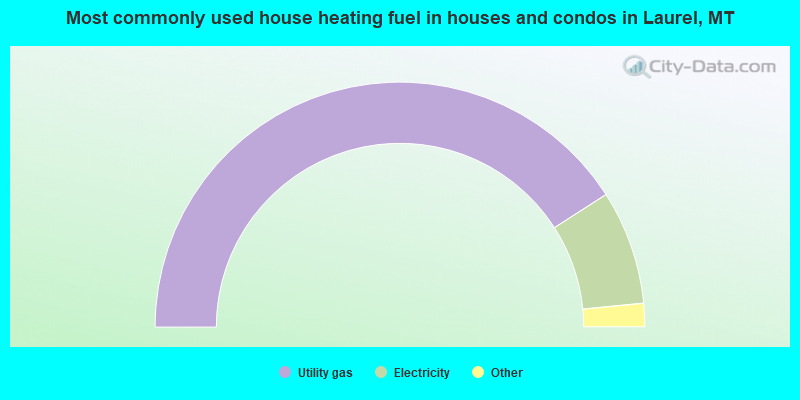
House heating fuel used in houses and condos - Utility gas (%)
House heating fuel used in houses and condos - Bottled, tank, or LP gas (%)
House heating fuel used in houses and condos - Electricity (%)
House heating fuel used in houses and condos - Fuel oil, kerosene, etc. (%)
House heating fuel used in houses and condos - Coal or coke (%)
House heating fuel used in houses and condos - Wood (%)
House heating fuel used in houses and condos - Solar energy (%)
House heating fuel used in houses and condos - Other fuel (%)
House heating fuel used in houses and condos - No fuel used (%)
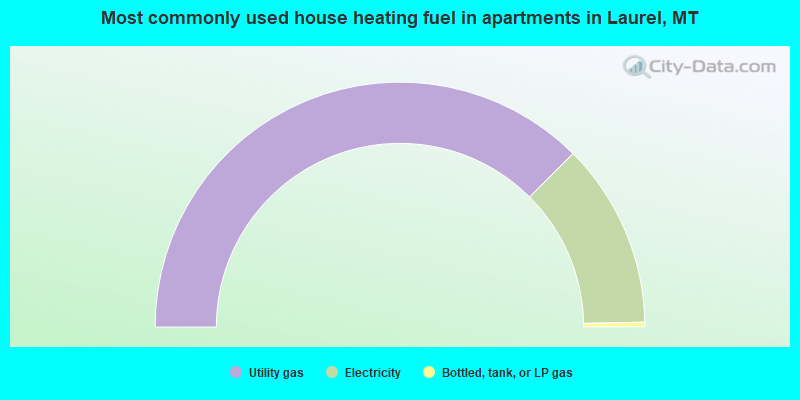
House heating fuel used in apartments - Utility gas (%)
House heating fuel used in apartments - Bottled, tank, or LP gas (%)
House heating fuel used in apartments - Electricity (%)
House heating fuel used in apartments - Fuel oil, kerosene, etc. (%)
House heating fuel used in apartments - Coal or coke (%)
House heating fuel used in apartments - Wood (%)
House heating fuel used in apartments - Solar energy (%)
House heating fuel used in apartments - Other fuel (%)
House heating fuel used in apartments - No fuel used (%)
Armed forces status - In Armed Forces (%)
Armed forces status - Civilian (%)
Armed forces status - Civilian - Veteran (%)
Armed forces status - Civilian - Nonveteran (%)
Fatal accidents locations in years 2005-2021
Fatal accidents locations in 2005
Fatal accidents locations in 2006
Fatal accidents locations in 2007
Fatal accidents locations in 2008
Fatal accidents locations in 2009
Fatal accidents locations in 2010
Fatal accidents locations in 2011
Fatal accidents locations in 2012
Fatal accidents locations in 2013
Fatal accidents locations in 2014
Fatal accidents locations in 2015
Fatal accidents locations in 2016
Fatal accidents locations in 2017
Fatal accidents locations in 2018
Fatal accidents locations in 2019
Fatal accidents locations in 2020
Fatal accidents locations in 2021
Alcohol use - People drinking some alcohol every month (%)
Alcohol use - People not drinking at all (%)
Alcohol use - Average days/month drinking alcohol
Alcohol use - Average drinks/week
Alcohol use - Average days/year people drink much
Audiometry - Average condition of hearing (%)
Audiometry - People that can hear a whisper from across a quiet room (%)
Audiometry - People that can hear normal voice from across a quiet room (%)
Audiometry - Ears ringing, roaring, buzzing (%)
Audiometry - Had a job exposure to loud noise (%)
Audiometry - Had off-work exposure to loud noise (%)
Blood Pressure & Cholesterol - Has high blood pressure (%)
Blood Pressure & Cholesterol - Checking blood pressure at home (%)
Blood Pressure & Cholesterol - Frequently checking blood cholesterol (%)
Blood Pressure & Cholesterol - Has high cholesterol level (%)
Consumer Behavior - Money monthly spent on food at supermarket/grocery store
Consumer Behavior - Money monthly spent on food at other stores
Consumer Behavior - Money monthly spent on eating out
Consumer Behavior - Money monthly spent on carryout/delivered foods
Consumer Behavior - Income spent on food at supermarket/grocery store (%)
Consumer Behavior - Income spent on food at other stores (%)
Consumer Behavior - Income spent on eating out (%)
Consumer Behavior - Income spent on carryout/delivered foods (%)
Current Health Status - General health condition (%)
Current Health Status - Blood donors (%)
Current Health Status - Has blood ever tested for HIV virus (%)
Current Health Status - Left-handed people (%)
Dermatology - People using sunscreen (%)
Diabetes - Diabetics (%)
Diabetes - Had a blood test for high blood sugar (%)
Diabetes - People taking insulin (%)
Diet Behavior & Nutrition - Diet health (%)
Diet Behavior & Nutrition - Milk product consumption (# of products/month)
Diet Behavior & Nutrition - Meals not home prepared (#/week)
Diet Behavior & Nutrition - Meals from fast food or pizza place (#/week)
Diet Behavior & Nutrition - Ready-to-eat foods (#/month)
Diet Behavior & Nutrition - Frozen meals/pizza (#/month)
Drug Use - People that ever used marijuana or hashish (%)
Drug Use - Ever used hard drugs (%)
Drug Use - Ever used any form of cocaine (%)
Drug Use - Ever used heroin (%)
Drug Use - Ever used methamphetamine (%)
Health Insurance - People covered by health insurance (%)
Kidney Conditions-Urology - Avg. # of times urinating at night
Medical Conditions - People with asthma (%)
Medical Conditions - People with anemia (%)
Medical Conditions - People with psoriasis (%)
Medical Conditions - People with overweight (%)
Medical Conditions - Elderly people having difficulties in thinking or remembering (%)
Medical Conditions - People who ever received blood transfusion (%)
Medical Conditions - People having trouble seeing even with glass/contacts (%)
Medical Conditions - People with arthritis (%)
Medical Conditions - People with gout (%)
Medical Conditions - People with congestive heart failure (%)
Medical Conditions - People with coronary heart disease (%)
Medical Conditions - People with angina pectoris (%)
Medical Conditions - People who ever had heart attack (%)
Medical Conditions - People who ever had stroke (%)
Medical Conditions - People with emphysema (%)
Medical Conditions - People with thyroid problem (%)
Medical Conditions - People with chronic bronchitis (%)
Medical Conditions - People with any liver condition (%)
Medical Conditions - People who ever had cancer or malignancy (%)
Mental Health - People who have little interest in doing things (%)
Mental Health - People feeling down, depressed, or hopeless (%)
Mental Health - People who have trouble sleeping or sleeping too much (%)
Mental Health - People feeling tired or having little energy (%)
Mental Health - People with poor appetite or overeating (%)
Mental Health - People feeling bad about themself (%)
Mental Health - People who have trouble concentrating on things (%)
Mental Health - People moving or speaking slowly or too fast (%)
Mental Health - People having thoughts they would be better off dead (%)
Oral Health - Average years since last visit a dentist
Oral Health - People embarrassed because of mouth (%)
Oral Health - People with gum disease (%)
Oral Health - General health of teeth and gums (%)
Oral Health - Average days a week using dental floss/device
Oral Health - Average days a week using mouthwash for dental problem
Oral Health - Average number of teeth
Pesticide Use - Households using pesticides to control insects (%)
Pesticide Use - Households using pesticides to kill weeds (%)
Physical Activity - People doing vigorous-intensity work activities (%)
Physical Activity - People doing moderate-intensity work activities (%)
Physical Activity - People walking or bicycling (%)
Physical Activity - People doing vigorous-intensity recreational activities (%)
Physical Activity - People doing moderate-intensity recreational activities (%)
Physical Activity - Average hours a day doing sedentary activities
Physical Activity - Average hours a day watching TV or videos
Physical Activity - Average hours a day using computer
Physical Functioning - People having limitations keeping them from working (%)
Physical Functioning - People limited in amount of work they can do (%)
Physical Functioning - People that need special equipment to walk (%)
Physical Functioning - People experiencing confusion/memory problems (%)
Physical Functioning - People requiring special healthcare equipment (%)
Prescription Medications - Average number of prescription medicines taking
Preventive Aspirin Use - Adults 40+ taking low-dose aspirin (%)
Reproductive Health - Vaginal deliveries (%)
Reproductive Health - Cesarean deliveries (%)
Reproductive Health - Deliveries resulted in a live birth (%)
Reproductive Health - Pregnancies resulted in a delivery (%)
Reproductive Health - Women breastfeeding newborns (%)
Reproductive Health - Women that had a hysterectomy (%)
Reproductive Health - Women that had both ovaries removed (%)
Reproductive Health - Women that have ever taken birth control pills (%)
Reproductive Health - Women taking birth control pills (%)
Reproductive Health - Women that have ever used Depo-Provera or injectables (%)
Reproductive Health - Women that have ever used female hormones (%)
Sexual Behavior - People 18+ that ever had sex (vaginal, anal, or oral) (%)
Sexual Behavior - Males 18+ that ever had vaginal sex with a woman (%)
Sexual Behavior - Males 18+ that ever performed oral sex on a woman (%)
Sexual Behavior - Males 18+ that ever had anal sex with a woman (%)
Sexual Behavior - Males 18+ that ever had any sex with a man (%)
Sexual Behavior - Females 18+ that ever had vaginal sex with a man (%)
Sexual Behavior - Females 18+ that ever performed oral sex on a man (%)
Sexual Behavior - Females 18+ that ever had anal sex with a man (%)
Sexual Behavior - Females 18+ that ever had any kind of sex with a woman (%)
Sexual Behavior - Average age people first had sex
Sexual Behavior - Average number of female sex partners in lifetime (males 18+)
Sexual Behavior - Average number of female vaginal sex partners in lifetime (males 18+)
Sexual Behavior - Average age people first performed oral sex on a woman (18+)
Sexual Behavior - Average number of woman performed oral sex on in lifetime (18+)
Sexual Behavior - Average number of male sex partners in lifetime (males 18+)
Sexual Behavior - Average number of male anal sex partners in lifetime (males 18+)
Sexual Behavior - Average age people first performed oral sex on a man (18+)
Sexual Behavior - Average number of male oral sex partners in lifetime (18+)
Sexual Behavior - People using protection when performing oral sex (%)
Sexual Behavior - Average number of times people have vaginal or anal sex a year
Sexual Behavior - People having sex without condom (%)
Sexual Behavior - Average number of male sex partners in lifetime (females 18+)
Sexual Behavior - Average number of male vaginal sex partners in lifetime (females 18+)
Sexual Behavior - Average number of female sex partners in lifetime (females 18+)
Sexual Behavior - Circumcised males 18+ (%)
Sleep Disorders - Average hours sleeping at night
Sleep Disorders - People that has trouble sleeping (%)
Smoking-Cigarette Use - People smoking cigarettes (%)
Taste & Smell - People 40+ having problems with smell (%)
Taste & Smell - People 40+ having problems with taste (%)
Taste & Smell - People 40+ that ever had wisdom teeth removed (%)
Taste & Smell - People 40+ that ever had tonsils teeth removed (%)
Taste & Smell - People 40+ that ever had a loss of consciousness because of a head injury (%)
Taste & Smell - People 40+ that ever had a broken nose or other serious injury to face or skull (%)
Taste & Smell - People 40+ that ever had two or more sinus infections (%)
Weight - Average height (inches)
Weight - Average weight (pounds)
Weight - Average BMI
Weight - People that are obese (%)
Weight - People that ever were obese (%)
Weight - People trying to lose weight (%)
Officers per 1,000 residents here:
1.94Montana average:
1.96
Latest news from Laurel, MT collected exclusively by city-data.com from local newspapers, TV, and radio stations
Ancestries: German (43.0%), European (13.3%), American (6.8%), Irish (5.5%), African (5.2%), Norwegian (4.3%).
Current Local Time:
Land area: 1.88 square miles.
Population density: 3,822 people per square mile (average).
85 residents are foreign born
This city:
1.2%Montana:
2.3%
Median real estate property taxes paid for housing units with mortgages in 2022: $1,962 (0.7%)Median real estate property taxes paid for housing units with no mortgage in 2022: $1,419 (0.8%)
Nearest city with pop. 50,000+: Billings, MT
Nearest city with pop. 200,000+: West Adams, CO (444.5 miles
Nearest city with pop. 1,000,000+: Phoenix, AZ
Nearest cities:
Silesia, MT (3.0 miles),
Edgar, MT (3.9 miles),
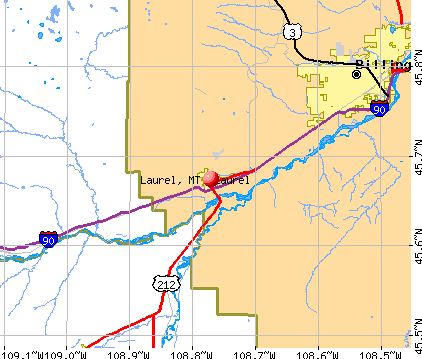
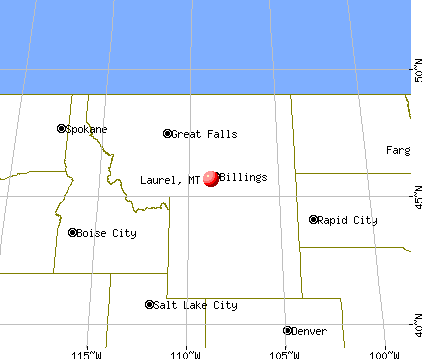
Latitude: 45.67 N, Longitude: 108.77 W
Daytime population change due to commuting: -559 (-7.6%)Workers who live and work in this city: 1,630 (40.6%)
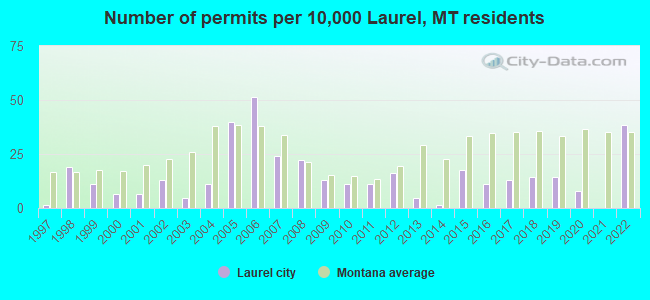
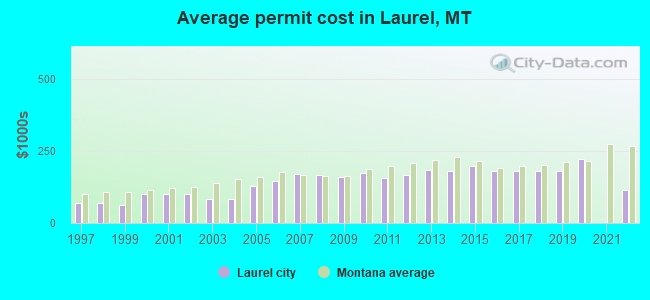
Single-family new house construction building permits:
2022: 24 buildings , average cost: $114,3002020: 5 buildings , average cost: $223,1002019: 9 buildings , average cost: $179,2002018: 9 buildings , average cost: $179,2002017: 8 buildings , average cost: $179,2002016: 7 buildings , average cost: $179,2002015: 11 buildings , average cost: $198,6002014: 1 building , cost: $179,1002013: 3 buildings , average cost: $185,2002012: 10 buildings , average cost: $167,0002011: 7 buildings , average cost: $156,6002010: 7 buildings , average cost: $172,6002009: 8 buildings , average cost: $158,7002008: 14 buildings , average cost: $165,9002007: 15 buildings , average cost: $169,3002006: 32 buildings , average cost: $146,2002005: 25 buildings , average cost: $129,0002004: 7 buildings , average cost: $83,1002003: 3 buildings , average cost: $83,5002002: 8 buildings , average cost: $98,8002001: 4 buildings , average cost: $101,9002000: 4 buildings , average cost: $98,8001999: 7 buildings , average cost: $63,3001998: 12 buildings , average cost: $69,8001997: 1 building , cost: $70,000Unemployment in December 2023:
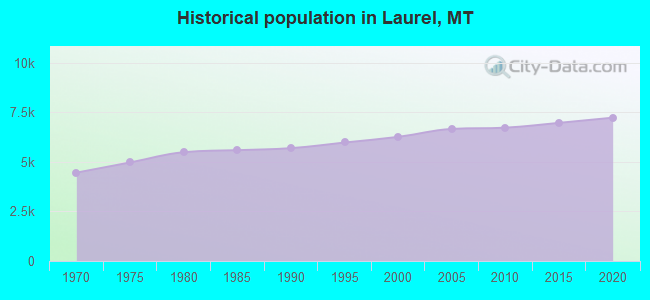
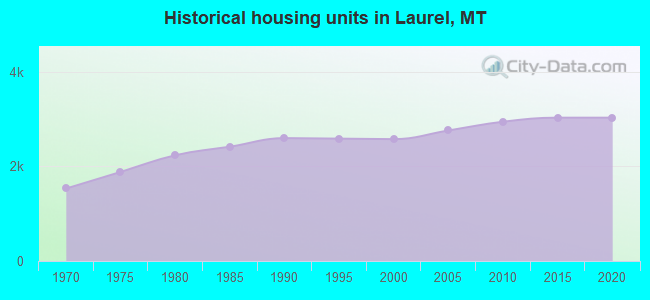
Population change in the 1990s: +385 (+6.6%).
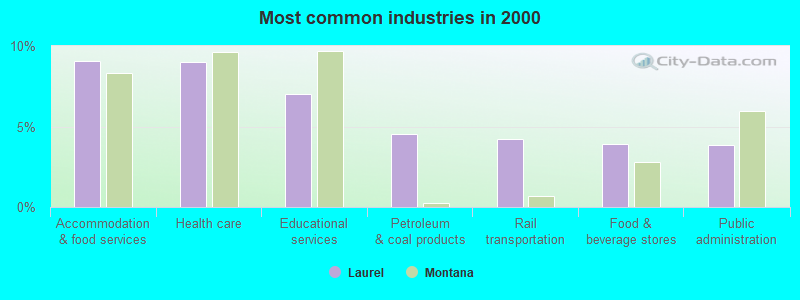
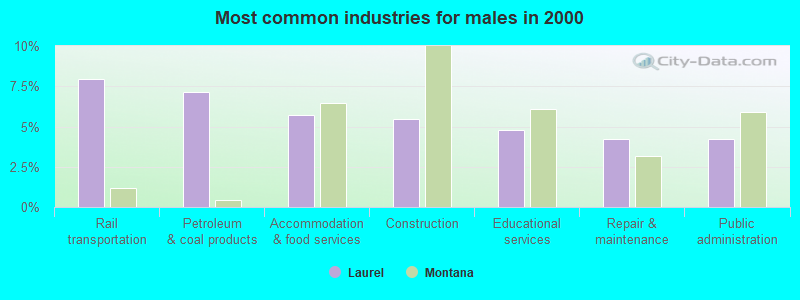
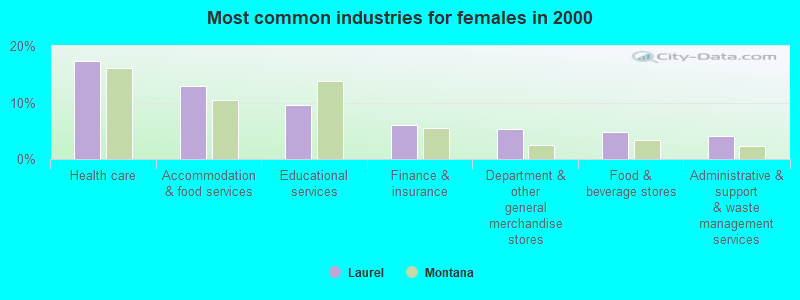
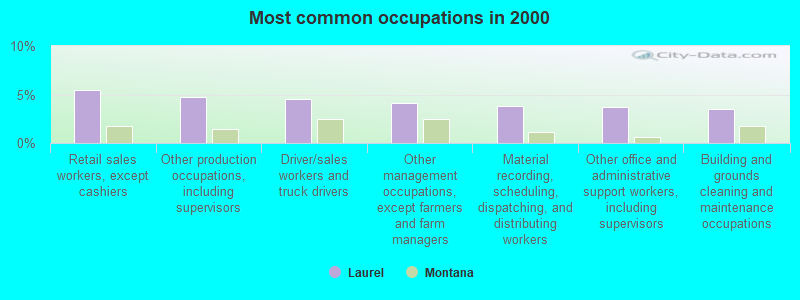
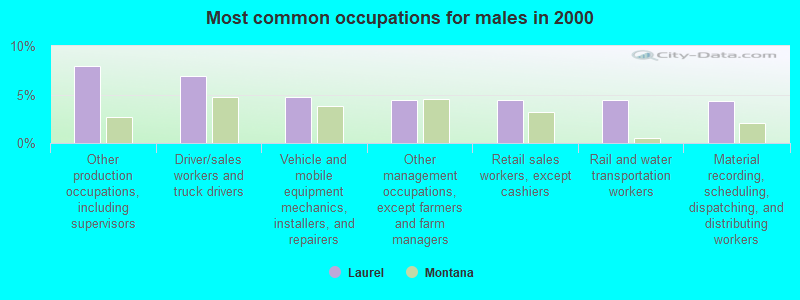
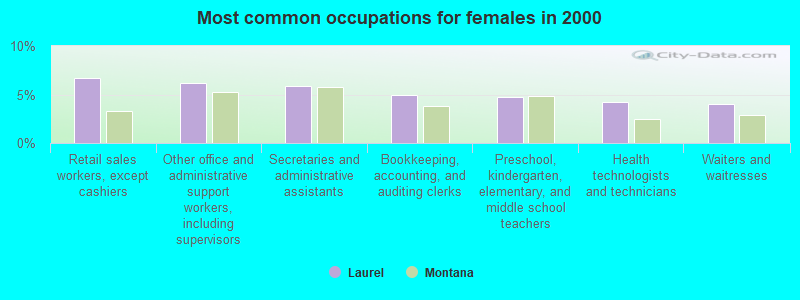
Most common occupations in Laurel, MT (%)
Both Males Females
Retail sales workers, except cashiers (5.5%)
Other production occupations, including supervisors (4.8%)
Driver/sales workers and truck drivers (4.6%)
Other management occupations, except farmers and farm managers (4.1%)
Material recording, scheduling, dispatching, and distributing workers (3.8%)
Other office and administrative support workers, including supervisors (3.7%)
Building and grounds cleaning and maintenance occupations (3.5%)
Other production occupations, including supervisors (7.9%)
Driver/sales workers and truck drivers (6.9%)
Vehicle and mobile equipment mechanics, installers, and repairers (4.7%)
Other management occupations, except farmers and farm managers (4.4%)
Retail sales workers, except cashiers (4.4%)
Rail and water transportation workers (4.4%)
Material recording, scheduling, dispatching, and distributing workers (4.3%)
Retail sales workers, except cashiers (6.7%)
Other office and administrative support workers, including supervisors (6.1%)
Secretaries and administrative assistants (5.8%)
Bookkeeping, accounting, and auditing clerks (5.0%)
Preschool, kindergarten, elementary, and middle school teachers (4.7%)
Health technologists and technicians (4.2%)
Waiters and waitresses (4.0%)
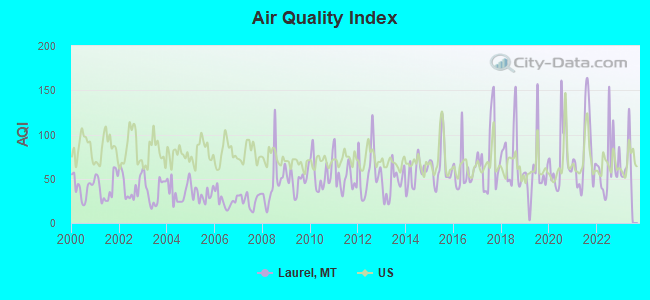
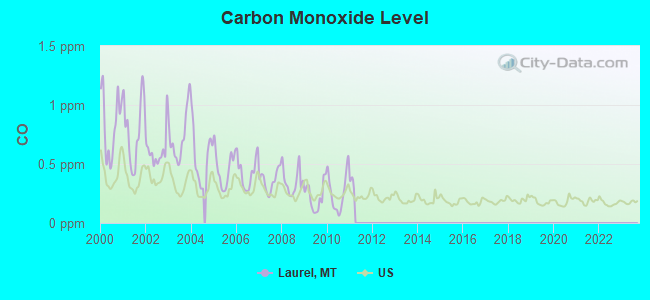
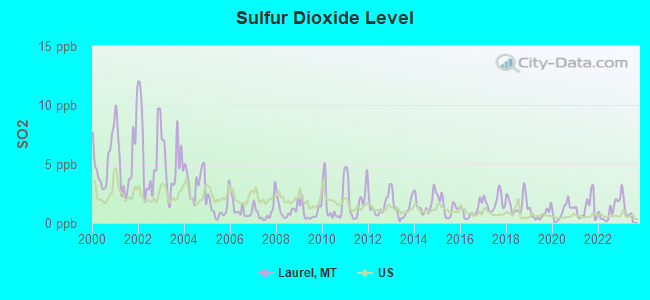
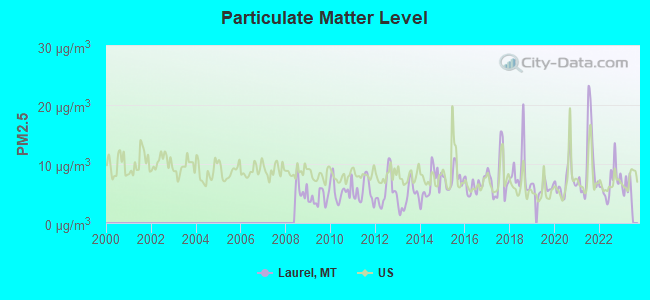
Air pollution and air quality trends(lower is better)
AQI CO SO2 PM2.5
Earthquake activity:
Laurel-area historical earthquake activity is significantly above Montana state average. It is 698% greater than the overall U.S. average. On 8/18/1959 at 06:37:13, a magnitude 7.7 (7.7 UK, Class: Major, Intensity: VIII - XII) earthquake occurred 119.7 miles away from Laurel center, causing $26,000,000 total damage On 10/28/1983 at 14:06:06, a magnitude 7.3 (6.2 MB, 7.3 MS, 7.0 MW) earthquake occurred 270.1 miles away from the city center, causing 2 deaths ( 2 shaking deaths) and 3 injuries, causing $15,000,000 total damage On 6/30/1975 at 18:54:13, a magnitude 6.1 (5.6 MB, 5.9 MS, 6.1 UK, 6.1 ML, Class: Strong, Intensity: VII - IX) earthquake occurred 118.2 miles away from the city center On 3/31/2020 at 23:52:30, a magnitude 6.5 (6.5 MW, Depth: 7.5 mi) earthquake occurred 321.0 miles away from Laurel center On 7/6/2017 at 06:30:17, a magnitude 5.8 (5.8 MW, Depth: 7.6 mi, Class: Moderate, Intensity: VI - VII) earthquake occurred 200.1 miles away from Laurel center On 7/26/2005 at 04:08:37, a magnitude 5.7 (5.7 MB, 5.2 MS, 5.6 MW) earthquake occurred 185.2 miles away from the city center Magnitude types: body-wave magnitude (MB), local magnitude (ML), surface-wave magnitude (MS), moment magnitude (MW) Natural disasters: The number of natural disasters in Yellowstone County (9) is smaller than the US average (15).Major Disasters (Presidential) Declared: 4Emergencies Declared: 1Fires: 4, Floods: 3, Storms: 3, Hurricane: 1, Snow: 1, Other: 1 (Note: some incidents may be assigned to more than one category). Hospitals and medical centers in Laurel: LAUREL HEALTH AND REHABILITATION CENTER (820 3RD AVE)
LAUREL NURSING HOME (421 YELLOWSTONE AVE)
Other hospitals and medical centers near Laurel: ROCKY MOUNTAIN HOME CARE (Home Health Center, about 12 miles away; BILLINGS, MT)
ST JOHN'S LUTHERAN HOME (Nursing Home, about 12 miles away; BILLINGS, MT)
BILLINGS HEALTH AND REHAB COMMUNITY (Nursing Home, about 12 miles away; BILLINGS, MT)
HEALTHY AT HOME CARE SERVICES (Home Health Center, about 13 miles away; BILLINGS, MT)
VALLEY HEALTH CARE CENTER (Nursing Home, about 13 miles away; BILLINGS, MT)
RIVERSTONE HEALTH (Home Health Center, about 14 miles away; BILLINGS, MT)
DCI BILLINGS (Dialysis Facility, about 14 miles away; BILLINGS, MT)
Colleges/universities with over 2000 students nearest to Laurel:
Montana State University-Billings (about 15 miles; Billings, MT ; Full-time enrollment: 4,319)
Sheridan College (about 110 miles; Sheridan, WY ; FT enrollment: 2,070)
Montana State University (about 111 miles; Bozeman, MT ; FT enrollment: 12,942)
Brigham Young University-Idaho (about 197 miles; Rexburg, ID ; FT enrollment: 30,522)
Casper College (about 231 miles; Casper, WY ; FT enrollment: 2,770)
Black Hills State University (about 253 miles; Spearfish, SD ; FT enrollment: 3,166)
The University of Montana (about 263 miles; Missoula, MT ; FT enrollment: 13,602)
Public high school in Laurel:
Public elementary/middle schools in Laurel:
See full list of schools located in Laurel Library in Laurel: LAUREL PUBLIC LIBRARY Operating income: $170,752; Location: 720 WEST 3RD ST; 20,959 books ; 9,111 e-books ; 644 audio materials ; 968 video materials ; 3 local licensed databases ; 56 state licensed databases ; 1 other licensed databases ; 25 print serial subscriptions )
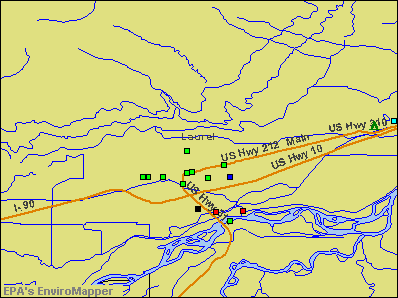
Notable locations in Laurel: (A) , City of Laurel Ambulance Service (B) , Laurel Volunteer Fire Department (C) . Display/hide their locations on the map
Churches in Laurel include: (A) , Saint Johns Church (B) . Display/hide their locations on the map
Park in Laurel: (1) . Display/hide its location on the map
Hotels:
Court:
Yellowstone County has a predicted average indoor radon screening level between 2 and 4 pCi/L (pico curies per liter) - Moderate Potential Drinking water stations with addresses in Laurel and their reported violations in the past:
LAUREL MUNICIPAL WATER SYSTEM (Population served: 6,339, Surface water):
Past monitoring violations:
Monitoring and Reporting (DBP) - Between OCT-2005 and DEC-2005, Contaminant: Total Haloacetic Acids (HAA5). Follow-up actions: St Public Notif requested (FEB-25-2006), St Violation/Reminder Notice (FEB-25-2006), St Compliance achieved (2 times from APR-03-2006 to NOV-06-2006)
Monitoring and Reporting (DBP) - Between OCT-2005 and DEC-2005, Contaminant: TTHM. Follow-up actions: St Public Notif requested (FEB-25-2006), St Violation/Reminder Notice (FEB-25-2006), St Compliance achieved (2 times from APR-03-2006 to NOV-06-2006)
Monitoring and Reporting (DBP) - Between JAN-2005 and MAR-2005, Contaminant: Total Haloacetic Acids (HAA5). Follow-up actions: St Public Notif requested (FEB-25-2006), St Violation/Reminder Notice (FEB-25-2006), St Compliance achieved (2 times from APR-03-2006 to NOV-06-2006)
Monitoring and Reporting (DBP) - Between JAN-2005 and MAR-2005, Contaminant: TTHM. Follow-up actions: St Public Notif requested (FEB-25-2006), St Violation/Reminder Notice (FEB-25-2006), St Compliance achieved (2 times from APR-03-2006 to NOV-06-2006)
22 regular monitoring violations
Population served: 650, Purch surface water):
Past monitoring violations:
Monitoring and Reporting (DBP) - Between JAN-2014 and MAR-2014, Contaminant: TTHM. Follow-up actions: St Violation/Reminder Notice (APR-14-2014), St Public Notif requested (APR-14-2014)
Monitoring and Reporting (DBP) - Between JAN-2014 and MAR-2014, Contaminant: Total Haloacetic Acids (HAA5). Follow-up actions: St Violation/Reminder Notice (APR-14-2014), St Public Notif requested (APR-14-2014)
Follow-up Or Routine LCR Tap M/R - In OCT-01-2008, Contaminant: Lead and Copper Rule. Follow-up actions: St Compliance achieved (SEP-28-2008), St Public Notif requested (NOV-01-2008), St Violation/Reminder Notice (NOV-01-2008)
Follow-up Or Routine LCR Tap M/R - In OCT-01-2004, Contaminant: Lead and Copper Rule. Follow-up actions: St Public Notif requested (JAN-04-2005), St Violation/Reminder Notice (JAN-04-2005), St Compliance achieved (JUN-06-2007)
Follow-up Or Routine LCR Tap M/R - In OCT-01-2003, Contaminant: Lead and Copper Rule. Follow-up actions: St Compliance achieved (JUN-06-2007)
3 routine major monitoring violations
One regular monitoring violation
Address: 9407 LAUREL AIRPORT RD Population served: 60, Purch surface water):
Past monitoring violations:
Lead Consumer Notice - In JAN-01-2014, Contaminant: Lead and Copper Rule. Follow-up actions: St Violation/Reminder Notice (JAN-23-2014), St Compliance achieved (FEB-04-2014)
Average household size: This city:
2.4 peopleMontana:
2.4 people
Percentage of family households: This city:
63.3%Whole state:
62.8%
Percentage of households with unmarried partners: This city:
6.0%Whole state:
6.7%
Likely homosexual households (counted as self-reported same-sex unmarried-partner households)
Lesbian couples: 0.4% of all households Gay men: 0.1% of all households
71 people in nursing facilities/skilled-nursing facilities in 2010people in nursing homes in 2000people in other group homes in 2000
Banks with branches in Laurel (2011 data):
The Yellowstone Bank: at 12 First Avenue, branch established on 1926/05/26; Drive-In at 12 First Street, branch established on 1972/03/20. Info updated 2006/11/03: Bank assets: $437.3 mil, Deposits: $347.2 mil, local headquarters , positive income , Commercial Lending Specialization, 8 total offices , Holding Company: Yellowstone Holding Company
Western Security Bank: Laurel Branch at 20 Montana Avenue, branch established on 1972/04/17. Info updated 2011/06/20: Bank assets: $807.6 mil, Deposits: $550.7 mil, headquarters in Billings, MT, positive income , 8 total offices , Holding Company: Glacier Bancorp, Inc.
United Bank: 401 Se 4th Street Branch at 401 Se 4th Street, P.O. Box 457, branch established on 2007/06/18. Info updated 2012/01/10: Bank assets: $69.2 mil, Deposits: $57.3 mil, headquarters in Absarokee, MT, positive income , Agricultural Specialization, 3 total offices , Holding Company: Absarokee Bancorporation, Inc.
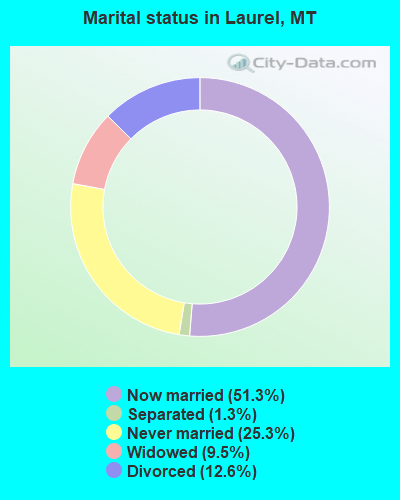
For population 15 years and over in Laurel:
Never married: 25.3%Now married: 51.3%Separated: 1.3%Widowed: 9.5%Divorced: 12.6% For population 25 years and over in Laurel:
High school or higher: 94.3%Bachelor's degree or higher: 15.9%Graduate or professional degree: 3.0%Unemployed: 5.7%Mean travel time to work (commute): 20.1 minutes
Education Gini index (Inequality in education) Here:
7.4Montana average:
10.0
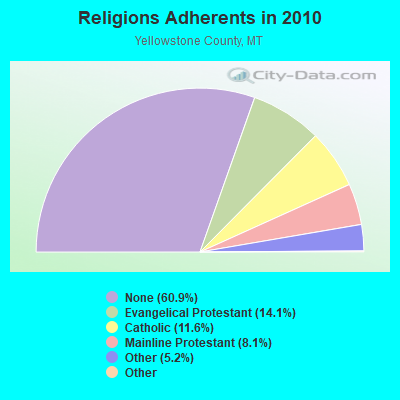
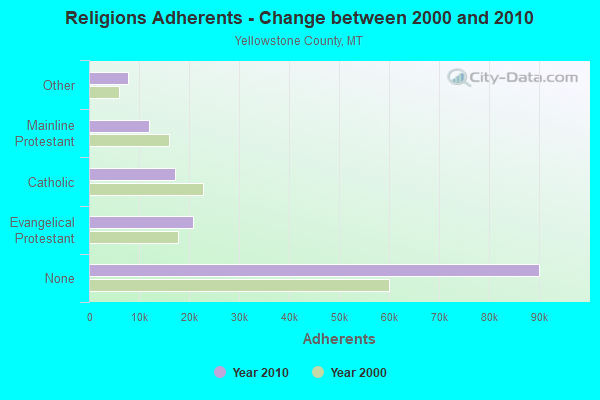
Religion statistics for Laurel, MT (based on Yellowstone County data)
Religion Adherents Congregations Evangelical Protestant 20,845 86 Catholic 17,155 12 Mainline Protestant 11,920 35 Other 7,761 29 Black Protestant 123 1 Orthodox 100 1 None 90,068 -
Source: Clifford Grammich, Kirk Hadaway, Richard Houseal, Dale E.Jones, Alexei Krindatch, Richie Stanley and Richard H.Taylor. 2012. 2010 U.S.Religion Census: Religious Congregations & Membership Study. Association of Statisticians of American Religious Bodies. Jones, Dale E., et al. 2002. Congregations and Membership in the United States 2000. Nashville, TN: Glenmary Research Center. Graphs represent county-level data
Food Environment Statistics: Number of grocery stores : 16Yellowstone County :
1.14 / 10,000 pop.Montana :
2.55 / 10,000 pop.
Number of supercenters and club stores : 3Yellowstone County :
0.21 / 10,000 pop.State :
0.20 / 10,000 pop.
Number of convenience stores (no gas) : 3Yellowstone County :
0.21 / 10,000 pop.Montana :
0.48 / 10,000 pop.
Number of convenience stores (with gas) : 66This county :
4.72 / 10,000 pop.State :
4.69 / 10,000 pop.
Number of full-service restaurants : 102Yellowstone County :
7.30 / 10,000 pop.Montana :
10.38 / 10,000 pop.
Adult diabetes rate : This county :
7.3%Montana :
7.2%
Adult obesity rate : Yellowstone County :
25.7%State :
23.1%
Low-income preschool obesity rate : Yellowstone County :
10.6%State :
10.7%
Health and Nutrition:
Average overall health of teeth and gums : Average BMI : This city:
29.0Montana:
28.6
People feeling badly about themselves : People not drinking alcohol at all : Average hours sleeping at night : Overweight people : This city:
38.0%Montana:
34.8%
General health condition : This city:
57.0%Montana:
58.6%
Average condition of hearing : More about Health and Nutrition of Laurel, MT Residents
Local government employment and payroll (March 2022)
Function
Full-time employees
Monthly full-time payroll
Average yearly full-time wage
Part-time employees
Monthly part-time payroll
Police Protection - Officers
13 $72,043 $66,501 0 $0 Water Supply
9 $46,183 $61,577 0 $0 Other and Unallocable
6 $31,415 $62,830 0 $0 Sewerage
5 $24,223 $58,135 0 $0 Solid Waste Management
5 $21,510 $51,624 0 $0 Financial Administration
4 $18,502 $55,506 1 $3,328 Police - Other
4 $19,057 $57,171 1 $3,829 Other Government Administration
2 $12,105 $72,630 7 $4,619 Streets and Highways
2 $9,624 $57,744 0 $0 Judicial and Legal
1 $3,959 $47,508 3 $10,043 Local Libraries
1 $4,832 $57,984 4 $6,786 Parks and Recreation
1 $4,995 $59,940 0 $0 Health
0 $0 21 $20,518
Totals for Government
53 $268,448 $60,781 37 $49,123
Laurel government finances - Expenditure in 2021 (per resident):
Construction - Water Utilities: $7,961,000 ($1105.23)
Sewerage: $1,712,000 ($237.68)Current Operations - Police Protection: $2,050,000 ($284.60)
Water Utilities: $1,929,000 ($267.81)Regular Highways: $1,354,000 ($187.98)Sewerage: $1,150,000 ($159.66)Solid Waste Management: $934,000 ($129.67)General - Other: $462,000 ($64.14)Judicial and Legal Services: $311,000 ($43.18)Central Staff Services: $304,000 ($42.20)Financial Administration: $304,000 ($42.20)Libraries: $275,000 ($38.18)Local Fire Protection: $240,000 ($33.32)Parks and Recreation: $196,000 ($27.21)Housing and Community Development: $183,000 ($25.41)General Public Buildings: $165,000 ($22.91)Natural Resources - Other: $153,000 ($21.24)Miscellaneous Commercial Activities - Other: $106,000 ($14.72)Protective Inspection and Regulation - Other: $90,000 ($12.49)Transit Utilities: $41,000 ($5.69)General - Interest on Debt: $278,000 ($38.60)
Other Capital Outlay - Solid Waste Management: $322,000 ($44.70)
General - Other: $109,000 ($15.13)Parks and Recreation: $20,000 ($2.78)Total Salaries and Wages: $5,633,000 ($782.04)
Water Utilities - Interest on Debt: $68,000 ($9.44)
Laurel government finances - Revenue in 2021 (per resident):
Charges - Sewerage: $2,141,000 ($297.24)
Other: $1,125,000 ($156.18)Solid Waste Management: $943,000 ($130.92)Parks and Recreation: $14,000 ($1.94)Federal Intergovernmental - Other: $30,000 ($4.16)
Transit Utilities: $21,000 ($2.92)General Local Government Support: $9,000 ($1.25)Miscellaneous - Special Assessments: $3,108,000 ($431.49)
General Revenue - Other: $375,000 ($52.06)Interest Earnings: $178,000 ($24.71)Fines and Forfeits: $111,000 ($15.41)Sale of Property: $65,000 ($9.02)Revenue - Water Utilities: $3,680,000 ($510.90)
Transit Utilities: $4,000 ($0.56)State Intergovernmental - General Local Government Support: $2,066,000 ($286.82)
Highways: $408,000 ($56.64)Other: $74,000 ($10.27)Water Utilities: $26,000 ($3.61)Sewerage: $15,000 ($2.08)Tax - Property: $2,520,000 ($349.85)
Other License: $75,000 ($10.41)Occupation and Business License - Other: $41,000 ($5.69)Alcoholic Beverage License: $8,000 ($1.11)
Laurel government finances - Debt in 2021 (per resident):
Long Term Debt - Beginning Outstanding - Unspecified Public Purpose: $13,677,000 ($1898.79)
Outstanding Unspecified Public Purpose: $12,832,000 ($1781.48)Retired Unspecified Public Purpose: $845,000 ($117.31)
Laurel government finances - Cash and Securities in 2021 (per resident):
Bond Funds - Cash and Securities: $1,125,000 ($156.18)
Other Funds - Cash and Securities: $19,244,000 ($2671.66)
Sinking Funds - Cash and Securities: $310,000 ($43.04)
Businesses in Laurel, MT
Name Count Name Count
Ace Hardware 1 Hardee's 1 Best Western 1 MasterBrand Cabinets 1 Burger King 1 McDonald's 1 CVS 1 Nike 1 Chevrolet 1 Pizza Hut 1 FedEx 1 Subway 2 Ford 1 UPS 1 H&R Block 1 Walmart 1
Strongest AM radio stations in Laurel:
KBSR (1490 AM; 1 kW; LAUREL, MT; Owner: SUN MOUNTAIN, INC.)
KGHL (790 AM; 5 kW; BILLINGS, MT; Owner: NEW NORTHWEST BROADCASTERS, LLC)
KBUL (970 AM; 5 kW; BILLINGS, MT; Owner: CAPSTAR TX LIMITED PARTNERSHIP)
KURL (730 AM; 5 kW; BILLINGS, MT; Owner: ELENBAAS MEDIA, INC.)
KBLG (910 AM; 1 kW; BILLINGS, MT; Owner: FISHER RADIO REGIONAL GROUP, INC.)
KMZK (1240 AM; 1 kW; BILLINGS, MT; Owner: ELENBAAS MEDIA, INC.)
KGVW (640 AM; 10 kW; BELGRADE, MT; Owner: GALLATIN VALLEY WITNESS, INC.)
KZMQ (1140 AM; daytime; 10 kW; GREYBULL, WY; Owner: LEGEND COMMUNICATIONS OF WYOMING LLC)
KTWO (1030 AM; 50 kW; CASPER, WY; Owner: CITICASTERS LICENSES, L.P.)
KPOW (1260 AM; 5 kW; POWELL, WY; Owner: CHAPARRAL BROADCASTING, INC.)
KERR (750 AM; 50 kW; POLSON, MT; Owner: ANDERSON RADIO BROADCASTING, INC.)
KUYO (830 AM; daytime; 25 kW; EVANSVILLE, WY; Owner: WYOMING CHRISTIAN BROADCASTING COMPANY)
KATL (770 AM; 10 kW; MILES CITY, MT; Owner: STAR PRINTING COMPANY)
Strongest FM radio stations in Laurel:
KRKX (94.1 FM; BILLINGS, MT; Owner: FISHER RADIO REGIONAL GROUP, INC.)
KEMC (91.7 FM; BILLINGS, MT; Owner: MONTANA STATE UNIVERSITY-BILLINGS)
KZRV (107.5 FM; BILLINGS, MT; Owner: NEW NORTHWEST BROADCASTERS, LLC)
KYYA-FM (93.3 FM; BILLINGS, MT; Owner: FISHER RADIO REGIONAL GROUP, INC.)
KRZN (96.3 FM; BILLINGS, MT; Owner: FISHER RADIO REGIONAL GROUP, INC.)
KMXE (99.3 FM; RED LODGE, MT; Owner: SILVER ROCK COMMUNICATIONS INC.)
KLMT (89.3 FM; BILLINGS, MT; Owner: WESTERN INSPIRATIONAL BROADCASTERS INC)
KCTR-FM (102.9 FM; BILLINGS, MT; Owner: CAPSTAR TX LIMITED PARTNERSHIP)
KBBB (103.7 FM; BILLINGS, MT; Owner: CAPSTAR TX LIMITED PARTNERSHIP)
KRSQ (101.9 FM; LAUREL, MT; Owner: NEW NORTHWEST BROADCASTERS, LLC)
K296EM (107.1 FM; BILLINGS, MT; Owner: WESTERN INSPIRATIONAL BROADCASTERS, INC)
KKBR (97.1 FM; BILLINGS, MT; Owner: CAPSTAR TX LIMITED PARTNERSHIP)
KGHL-FM (98.5 FM; BILLINGS, MT; Owner: NEW NORTHWEST BROADCASTERS, LLC)
K205CL (88.9 FM; SHEPHERD, MT; Owner: FAMILY STATIONS, INC.)
KNDZ (105.1 FM; BILLINGS, MT; Owner: NEW NORTHWEST BROADCASTERS, LLC)
TV broadcast stations around Laurel:
KULR-TV (Channel 8; BILLINGS, MT; Owner: KULR CORPORATION)
KTVQ (Channel 2; BILLINGS, MT; Owner: KTVQ COMMUNICATIONS, INC.)
K25BP (Channel 25; BILLINGS, MT; Owner: QUORUM OF MONTANA LICENSE, LLC)
KSVI (Channel 6; BILLINGS, MT; Owner: QUORUM OF MONTANA LICENSE, LLC)
KHMT (Channel 4; HARDIN, MT; Owner: VHR BROADCASTING OF BILLINGS, LLC)
K36EZ (Channel 36; BILLINGS, MT; Owner: COMANCHE ENTERPRISES)
K14IS (Channel 14; BILLINGS, MT; Owner: YELLOWSTONE VALLEY COMMUNITY TV, IN)
National Bridge Inventory (NBI) Statistics 56 Number of bridges676ft / 206m Total length $1,132,000 Total costs353,612 Total average daily traffic35,028 Total average daily truck traffic
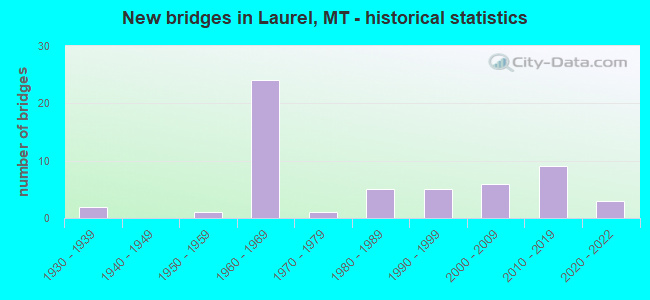
New bridges - historical statistics
2 1930-1939 1 1950-1959 24 1960-1969 1 1970-1979 5 1980-1989 5 1990-1999 6 2000-2009 9 2010-2019 3 2020-2022
See full National Bridge Inventory statistics for Laurel, MT
Home Mortgage Disclosure Act Aggregated Statistics For Year 2009(Based on 1 partial tract) A) FHA, FSA/RHS & VA B) Conventional C) Refinancings D) Home Improvement Loans F) Non-occupant Loans on G) Loans On Manufactured Number Average Value Number Average Value Number Average Value Number Average Value Number Average Value Number Average Value
LOANS ORIGINATED 24 $154,803 19 $160,848 78 $145,586 7 $52,984 5 $110,970 0 $0 APPLICATIONS APPROVED, NOT ACCEPTED 0 $0 1 $186,180 6 $166,743 0 $0 0 $0 0 $0 APPLICATIONS DENIED 2 $151,535 0 $0 13 $126,259 2 $46,855 1 $79,650 1 $40,940 APPLICATIONS WITHDRAWN 3 $149,523 1 $176,070 11 $144,395 1 $133,660 1 $77,430 0 $0 FILES CLOSED FOR INCOMPLETENESS 0 $0 0 $0 1 $166,950 0 $0 0 $0 0 $0
Aggregated Statistics For Year 2008(Based on 1 partial tract) A) FHA, FSA/RHS & VA B) Conventional C) Refinancings D) Home Improvement Loans F) Non-occupant Loans on G) Loans On Manufactured Number Average Value Number Average Value Number Average Value Number Average Value Number Average Value Number Average Value
LOANS ORIGINATED 18 $143,809 21 $146,480 40 $134,872 7 $60,770 9 $87,022 1 $61,650 APPLICATIONS APPROVED, NOT ACCEPTED 1 $98,150 3 $125,437 3 $186,677 0 $0 1 $130,450 0 $0 APPLICATIONS DENIED 1 $195,550 3 $105,133 19 $134,436 3 $73,487 1 $61,900 2 $37,730 APPLICATIONS WITHDRAWN 2 $175,085 2 $168,180 17 $146,611 1 $109,000 0 $0 0 $0 FILES CLOSED FOR INCOMPLETENESS 0 $0 1 $88,280 1 $176,810 0 $0 0 $0 0 $0
Aggregated Statistics For Year 2007(Based on 1 partial tract) A) FHA, FSA/RHS & VA B) Conventional C) Refinancings D) Home Improvement Loans F) Non-occupant Loans on G) Loans On Manufactured Number Average Value Number Average Value Number Average Value Number Average Value Number Average Value Number Average Value
LOANS ORIGINATED 9 $132,890 40 $139,156 36 $106,552 12 $40,422 8 $77,525 1 $40,200 APPLICATIONS APPROVED, NOT ACCEPTED 0 $0 4 $107,332 3 $107,600 2 $20,470 0 $0 1 $72,990 APPLICATIONS DENIED 0 $0 6 $109,408 23 $119,923 5 $58,246 1 $99,630 3 $49,977 APPLICATIONS WITHDRAWN 0 $0 2 $112,695 15 $111,135 4 $64,425 1 $73,730 0 $0 FILES CLOSED FOR INCOMPLETENESS 0 $0 1 $265,590 2 $175,950 0 $0 0 $0 0 $0
Aggregated Statistics For Year 2006(Based on 1 partial tract) A) FHA, FSA/RHS & VA B) Conventional C) Refinancings D) Home Improvement Loans F) Non-occupant Loans on G) Loans On Manufactured Number Average Value Number Average Value Number Average Value Number Average Value Number Average Value Number Average Value
LOANS ORIGINATED 9 $124,780 34 $120,283 36 $90,783 10 $35,436 5 $105,248 1 $53,270 APPLICATIONS APPROVED, NOT ACCEPTED 0 $0 1 $152,400 3 $91,900 1 $33,290 0 $0 1 $24,660 APPLICATIONS DENIED 1 $149,690 6 $83,145 22 $106,856 4 $23,180 1 $47,840 3 $48,497 APPLICATIONS WITHDRAWN 1 $98,150 3 $126,423 15 $114,554 2 $105,175 1 $62,140 1 $46,850 FILES CLOSED FOR INCOMPLETENESS 0 $0 2 $98,885 4 $172,682 0 $0 0 $0 0 $0
Aggregated Statistics For Year 2005(Based on 1 partial tract) A) FHA, FSA/RHS & VA B) Conventional C) Refinancings D) Home Improvement Loans F) Non-occupant Loans on G) Loans On Manufactured Number Average Value Number Average Value Number Average Value Number Average Value Number Average Value Number Average Value
LOANS ORIGINATED 9 $109,518 35 $114,112 39 $99,051 10 $44,561 10 $83,523 3 $30,413 APPLICATIONS APPROVED, NOT ACCEPTED 1 $133,900 3 $93,050 5 $120,736 1 $22,190 0 $0 0 $0 APPLICATIONS DENIED 0 $0 7 $92,580 18 $98,311 3 $44,963 0 $0 2 $67,690 APPLICATIONS WITHDRAWN 0 $0 5 $96,124 13 $108,788 3 $51,950 1 $85,820 0 $0 FILES CLOSED FOR INCOMPLETENESS 0 $0 1 $130,450 4 $138,158 0 $0 0 $0 0 $0
Aggregated Statistics For Year 2004(Based on 1 partial tract) A) FHA, FSA/RHS & VA B) Conventional C) Refinancings D) Home Improvement Loans F) Non-occupant Loans on G) Loans On Manufactured Number Average Value Number Average Value Number Average Value Number Average Value Number Average Value Number Average Value
LOANS ORIGINATED 15 $100,169 30 $108,216 45 $98,602 10 $29,493 6 $64,403 3 $85,653 APPLICATIONS APPROVED, NOT ACCEPTED 0 $0 3 $78,993 7 $73,910 1 $10,600 0 $0 1 $31,810 APPLICATIONS DENIED 1 $66,830 5 $73,142 18 $76,898 5 $29,740 1 $36,250 2 $51,170 APPLICATIONS WITHDRAWN 0 $0 6 $80,392 15 $86,606 1 $92,230 1 $80,640 0 $0 FILES CLOSED FOR INCOMPLETENESS 0 $0 0 $0 2 $86,185 0 $0 0 $0 0 $0
Aggregated Statistics For Year 2003(Based on 1 partial tract) A) FHA, FSA/RHS & VA B) Conventional C) Refinancings D) Home Improvement Loans F) Non-occupant Loans on Number Average Value Number Average Value Number Average Value Number Average Value Number Average Value
LOANS ORIGINATED 12 $82,447 25 $99,173 76 $89,162 16 $28,128 6 $61,732 APPLICATIONS APPROVED, NOT ACCEPTED 2 $74,845 3 $82,940 11 $89,202 0 $0 0 $0 APPLICATIONS DENIED 1 $103,820 4 $102,400 26 $81,293 3 $13,893 1 $100,370 APPLICATIONS WITHDRAWN 2 $72,375 3 $98,310 19 $94,565 2 $36,375 0 $0 FILES CLOSED FOR INCOMPLETENESS 0 $0 1 $76,690 2 $98,885 0 $0 0 $0
Aggregated Statistics For Year 2002(Based on 1 partial tract) A) FHA, FSA/RHS & VA B) Conventional C) Refinancings D) Home Improvement Loans F) Non-occupant Loans on Number Average Value Number Average Value Number Average Value Number Average Value Number Average Value
LOANS ORIGINATED 11 $95,815 18 $89,201 67 $82,858 15 $23,213 4 $44,635 APPLICATIONS APPROVED, NOT ACCEPTED 0 $0 2 $67,445 7 $73,980 1 $21,450 1 $56,960 APPLICATIONS DENIED 1 $105,300 6 $40,565 18 $71,719 2 $8,880 0 $0 APPLICATIONS WITHDRAWN 1 $110,230 2 $80,020 15 $78,320 0 $0 1 $38,220 FILES CLOSED FOR INCOMPLETENESS 0 $0 0 $0 3 $53,100 0 $0 0 $0
Aggregated Statistics For Year 2001(Based on 1 partial tract) A) FHA, FSA/RHS & VA B) Conventional C) Refinancings D) Home Improvement Loans F) Non-occupant Loans on Number Average Value Number Average Value Number Average Value Number Average Value Number Average Value
LOANS ORIGINATED 15 $75,180 22 $78,374 39 $71,489 9 $21,399 3 $77,843 APPLICATIONS APPROVED, NOT ACCEPTED 0 $0 2 $43,650 5 $63,622 0 $0 0 $0 APPLICATIONS DENIED 1 $127,000 11 $39,120 19 $61,235 3 $24,250 0 $0 APPLICATIONS WITHDRAWN 1 $143,270 2 $93,710 14 $83,139 2 $25,645 0 $0 FILES CLOSED FOR INCOMPLETENESS 0 $0 0 $0 1 $162,760 0 $0 0 $0
Aggregated Statistics For Year 2000(Based on 1 partial tract) A) FHA, FSA/RHS & VA B) Conventional C) Refinancings D) Home Improvement Loans F) Non-occupant Loans on Number Average Value Number Average Value Number Average Value Number Average Value Number Average Value
LOANS ORIGINATED 11 $80,638 26 $66,345 19 $55,965 13 $20,222 3 $52,607 APPLICATIONS APPROVED, NOT ACCEPTED 0 $0 7 $47,629 3 $61,157 1 $16,030 0 $0 APPLICATIONS DENIED 0 $0 20 $43,846 12 $42,457 4 $12,082 1 $74,470 APPLICATIONS WITHDRAWN 1 $56,960 1 $76,450 6 $60,952 0 $0 0 $0 FILES CLOSED FOR INCOMPLETENESS 0 $0 0 $0 1 $160,780 0 $0 0 $0
Aggregated Statistics For Year 1999(Based on 1 partial tract) A) FHA, FSA/RHS & VA B) Conventional C) Refinancings D) Home Improvement Loans F) Non-occupant Loans on Number Average Value Number Average Value Number Average Value Number Average Value Number Average Value
LOANS ORIGINATED 15 $78,958 21 $65,235 27 $64,179 12 $20,328 4 $55,952 APPLICATIONS APPROVED, NOT ACCEPTED 0 $0 8 $49,835 5 $57,976 2 $14,530 0 $0 APPLICATIONS DENIED 1 $36,020 21 $43,624 16 $43,905 4 $22,605 2 $41,730 APPLICATIONS WITHDRAWN 2 $54,275 3 $70,630 4 $67,938 1 $32,290 0 $0 FILES CLOSED FOR INCOMPLETENESS 0 $0 0 $0 2 $49,305 0 $0 0 $0
Detailed HMDA statistics for the following Tracts:
0019.00
Private Mortgage Insurance Companies Aggregated Statistics For Year 2009(Based on 1 partial tract) A) Conventional B) Refinancings Number Average Value Number Average Value
LOANS ORIGINATED 2 $220,830 3 $161,523 APPLICATIONS APPROVED, NOT ACCEPTED 1 $201,720 0 $0 APPLICATIONS DENIED 0 $0 0 $0 APPLICATIONS WITHDRAWN 0 $0 0 $0 FILES CLOSED FOR INCOMPLETENESS 0 $0 0 $0
Aggregated Statistics For Year 2008(Based on 1 partial tract) A) Conventional B) Refinancings Number Average Value Number Average Value
LOANS ORIGINATED 7 $181,497 4 $173,482 APPLICATIONS APPROVED, NOT ACCEPTED 2 $151,535 0 $0 APPLICATIONS DENIED 0 $0 0 $0 APPLICATIONS WITHDRAWN 0 $0 0 $0 FILES CLOSED FOR INCOMPLETENESS 0 $0 0 $0
Aggregated Statistics For Year 2007(Based on 1 partial tract) A) Conventional B) Refinancings C) Non-occupant Loans on Number Average Value Number Average Value Number Average Value
LOANS ORIGINATED 12 $151,228 3 $143,687 1 $62,390 APPLICATIONS APPROVED, NOT ACCEPTED 1 $137,360 0 $0 0 $0 APPLICATIONS DENIED 0 $0 0 $0 0 $0 APPLICATIONS WITHDRAWN 0 $0 0 $0 0 $0 FILES CLOSED FOR INCOMPLETENESS 0 $0 0 $0 0 $0
Aggregated Statistics For Year 2006(Based on 1 partial tract) A) Conventional B) Refinancings C) Non-occupant Loans on Number Average Value Number Average Value Number Average Value
LOANS ORIGINATED 6 $135,095 1 $164,240 1 $64,360 APPLICATIONS APPROVED, NOT ACCEPTED 0 $0 1 $136,620 0 $0 APPLICATIONS DENIED 0 $0 0 $0 0 $0 APPLICATIONS WITHDRAWN 0 $0 0 $0 0 $0 FILES CLOSED FOR INCOMPLETENESS 0 $0 0 $0 0 $0
Aggregated Statistics For Year 2005(Based on 1 partial tract) A) Conventional B) Refinancings C) Non-occupant Loans on Number Average Value Number Average Value Number Average Value
LOANS ORIGINATED 9 $128,561 7 $112,731 1 $90,010 APPLICATIONS APPROVED, NOT ACCEPTED 0 $0 0 $0 0 $0 APPLICATIONS DENIED 1 $43,160 0 $0 0 $0 APPLICATIONS WITHDRAWN 0 $0 0 $0 0 $0 FILES CLOSED FOR INCOMPLETENESS 0 $0 0 $0 0 $0
Aggregated Statistics For Year 2004(Based on 1 partial tract) A) Conventional B) Refinancings Number Average Value Number Average Value
LOANS ORIGINATED 5 $144,704 4 $113,868 APPLICATIONS APPROVED, NOT ACCEPTED 0 $0 1 $172,370 APPLICATIONS DENIED 0 $0 0 $0 APPLICATIONS WITHDRAWN 0 $0 0 $0 FILES CLOSED FOR INCOMPLETENESS 0 $0 0 $0
Aggregated Statistics For Year 2003(Based on 1 partial tract) A) Conventional B) Refinancings C) Non-occupant Loans on Number Average Value Number Average Value Number Average Value
LOANS ORIGINATED 10 $117,110 11 $101,622 1 $41,430 APPLICATIONS APPROVED, NOT ACCEPTED 0 $0 2 $76,940 0 $0 APPLICATIONS DENIED 0 $0 0 $0 0 $0 APPLICATIONS WITHDRAWN 0 $0 0 $0 0 $0 FILES CLOSED FOR INCOMPLETENESS 0 $0 0 $0 0 $0
Aggregated Statistics For Year 2002(Based on 1 partial tract) A) Conventional B) Refinancings Number Average Value Number Average Value
LOANS ORIGINATED 4 $99,442 6 $112,943 APPLICATIONS APPROVED, NOT ACCEPTED 0 $0 1 $65,100 APPLICATIONS DENIED 0 $0 0 $0 APPLICATIONS WITHDRAWN 0 $0 0 $0 FILES CLOSED FOR INCOMPLETENESS 0 $0 0 $0
Aggregated Statistics For Year 2001(Based on 1 partial tract) A) Conventional B) Refinancings C) Non-occupant Loans on Number Average Value Number Average Value Number Average Value
LOANS ORIGINATED 5 $89,368 4 $103,018 1 $73,730 APPLICATIONS APPROVED, NOT ACCEPTED 0 $0 0 $0 0 $0 APPLICATIONS DENIED 0 $0 0 $0 0 $0 APPLICATIONS WITHDRAWN 0 $0 0 $0 0 $0 FILES CLOSED FOR INCOMPLETENESS 0 $0 0 $0 0 $0
Aggregated Statistics For Year 2000(Based on 1 partial tract) A) Conventional B) Refinancings Number Average Value Number Average Value
LOANS ORIGINATED 3 $98,887 1 $152,890 APPLICATIONS APPROVED, NOT ACCEPTED 0 $0 0 $0 APPLICATIONS DENIED 0 $0 0 $0 APPLICATIONS WITHDRAWN 0 $0 0 $0 FILES CLOSED FOR INCOMPLETENESS 0 $0 0 $0
Aggregated Statistics For Year 1999(Based on 1 partial tract) A) Conventional B) Refinancings Number Average Value Number Average Value
LOANS ORIGINATED 4 $94,640 1 $129,660 APPLICATIONS APPROVED, NOT ACCEPTED 0 $0 0 $0 APPLICATIONS DENIED 0 $0 0 $0 APPLICATIONS WITHDRAWN 0 $0 0 $0 FILES CLOSED FOR INCOMPLETENESS 0 $0 0 $0
Detailed PMIC statistics for the following Tracts:
0019.00
Fire-safe hotels and motels in Laurel, Montana:
Best Western Locomotive Inn, 310 S First, Laurel, Montana 59044 Phone: (406) 628-8281
Best Western Yellowstone Crossing, 205 SE 4th St, Laurel, Montana 59044 Phone: (406) 628-6888, Fax: (406) 628-6888
All 2 fire-safe hotels and motels in Laurel, Montana
Most common first names in Laurel, MT among deceased individuals Name Count Lived (average)
John 42 76.8 years George 39 76.4 years Robert 37 67.3 years Mary 30 76.8 years Henry 29 81.4 years Helen 29 82.1 years James 27 76.8 years William 26 78.0 years Margaret 24 80.2 years Charles 20 78.8 years
Most common last names in Laurel, MT among deceased individuals Last name Count Lived (average)
Frank 21 74.6 years Reiter 13 82.1 years Nelson 13 69.1 years Johnson 12 82.8 years Fox 10 81.1 years Williams 10 81.1 years Anderson 9 81.0 years Ward 9 80.1 years Miller 8 75.0 years Smith 8 82.3 years
Laurel compared to Montana state average:
Unemployed percentage below state average. Black race population percentage above state average. Hispanic race population percentage above state average. Foreign-born population percentage below state average. Length of stay since moving in above state average. Percentage of population with a bachelor's degree or higher below state average.
Top Patent Applicants
Mark Rapkoch (2)
Derek L. Hansen (2)
John Becker (2)
Zachariah Bentley Roth (1)
Michael J. Mccoy (1)
Total of 8 patent applications in 2008-2024.


 Recent articles from our blog. Our writers, many of them Ph.D. graduates or candidates, create easy-to-read articles on a wide variety of topics.

 (13.7 miles
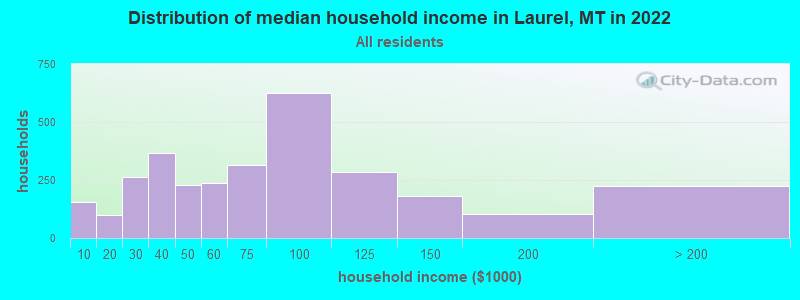


 Based on the data from the years 2002 - 2018 the average number of fire incidents per year is 23. The highest number of reported fire incidents - 68 took place in 2016, and the least - 0 in 2004. The data has a growing trend.
 When looking into fire subcategories, the most incidents belonged to: Outside Fires (60.8%), and Structure Fires (24.4%).