Goldsboro: Fire Incidents, North Carolina (NC)
Where are fire incidents reported in Goldsboro, NC
Something went wrong! Please refresh the page.
|
| |||||||||||||||||||||||||||||||||||||||||||||||||||||||||||||||||||||||||||||||||||||||||||||||||||||||||||||
| Other | 1,787 | |||||||||||||||||||||||||||||||||||||||||||||||||||||||||||||||||||||||||||||||||||||||||||||||||||||||||||||
2002 - 2018 National Fire Incident Reporting System (NFIRS) incidents
- Incident types reported to NFIRS in Goldsboro, NC
- 7,02032.2%Rescue & EMS
- 5,36924.6%Fire
- 3,45915.9%Hazardous Condition
- 2,69112.3%False Alarm
- 2,30310.6%Good Intent Call
- 7713.5%Service Call
- 1320.6%Overpressure Rupture
- 450.2%Special Incident
- 240.1%Severe Weather
- Fire incident types reported to NFIRS in Goldsboro, NC
- 2,34643.7%Structure Fires
- 2,08738.9%Outside Fires
- 71213.3%Mobile Property/Vehicle Fires
- 2244.2%Other
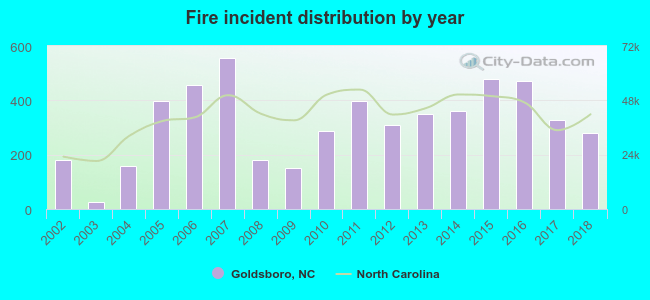 Based on the data from the years 2002 - 2018 the average number of fires per year is 316. The highest number of reported fire incidents - 554 took place in 2007, and the least - 27 in 2003. The data has a rising trend.
The average number of yearly fire incidents per 10k residents in Goldsboro, NC compared to nearest cities:
(Note: Based on data for the last 3 years, including only cities with population 5,000 and above)
| Goldsboro: | 99.6 |
| Selma: | 204.6 |
| Smithfield: | 152.5 |
| Kinston: | 81.3 |
| Wilson: | 51.0 |
| Ayden: | 102.1 |
| Clayton: | 129.0 |
| Clinton: | 126.3 |
| Winterville: | 89.7 |
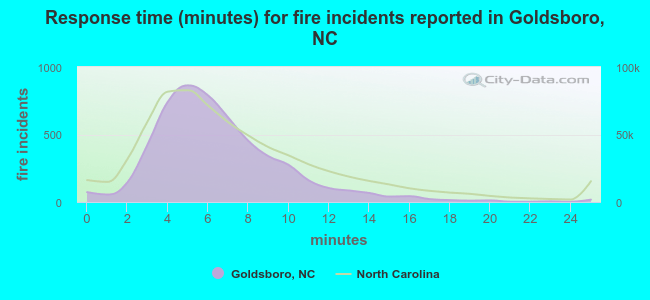 The median response time based on all reported fire incidents is 6 minutes. This is similar to the state median value.
The median response time in Goldsboro, NC compared to nearest cities:
(Note: Based on data for all years, including only cities with at least 500 fire incidents)
| Goldsboro: | 6 minutes |
| Pikeville: | 7 minutes |
| La Grange: | 7 minutes |
| Princeton: | 8 minutes |
| Mount Olive: | 8 minutes |
| Kenly: | 8 minutes |
| Snow Hill: | 8 minutes |
| Selma: | 8 minutes |
| Faison: | 11 minutes |
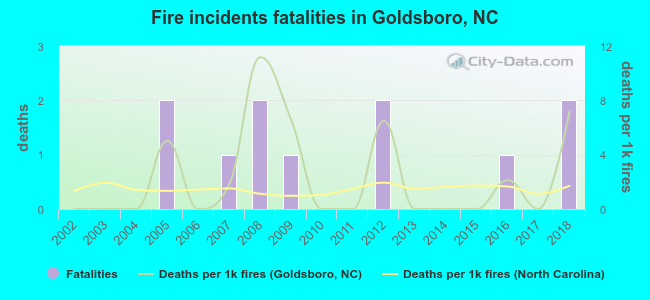 According to the data from the years 2002 - 2018 the average number of fire-related yearly deaths is 1. The highest number of deaths - 2 took place in 2005, and the lowest - 0 in 2002. The data has an increasing trend.
The average number of deaths per 1,000 fire incidents is 2. This indicator was the highest - 11 in 2008, and the lowest 0 in 2002. The trend for fatalities per 1,000 fire incidents is rising. Compared to the state value the number of deaths per 1,000 fires is higher.
According to the data from the years 2002 - 2018 the average number of fire-related yearly deaths is 1. The highest number of deaths - 2 took place in 2005, and the lowest - 0 in 2002. The data has an increasing trend.
The average number of deaths per 1,000 fire incidents is 2. This indicator was the highest - 11 in 2008, and the lowest 0 in 2002. The trend for fatalities per 1,000 fire incidents is rising. Compared to the state value the number of deaths per 1,000 fires is higher.Deaths per 1,000 incidents in Goldsboro, NC compared to nearest cities:
(Note: Based on data for all years, including only cities with at least 2,500 fire incidents)
| Goldsboro: | 2.0 |
| Kinston: | 1.6 |
| Wilson: | 1.9 |
| Clayton: | 0.0 |
| Dunn: | 1.5 |
| Greenville: | 1.8 |
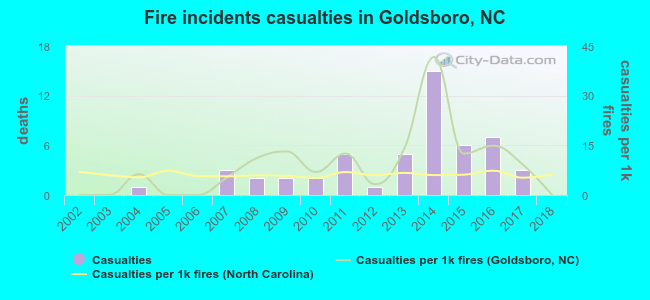 Based on the data from the years 2002 - 2018 the average number of fire-related yearly casualties is 3. The highest number of reported injuries - 15 took place in 2014, and the lowest - 0 in 2002. The data has a constant trend.
The average number of injuries per 1,000 fire incidents is 9. This indicator was the highest - 42 in 2014, and the lowest 0 in 2002. The trend for injuries per 1,000 fires is decreasing. Compared to the North Carolina value the number of injuries per 1,000 fires is higher.
Based on the data from the years 2002 - 2018 the average number of fire-related yearly casualties is 3. The highest number of reported injuries - 15 took place in 2014, and the lowest - 0 in 2002. The data has a constant trend.
The average number of injuries per 1,000 fire incidents is 9. This indicator was the highest - 42 in 2014, and the lowest 0 in 2002. The trend for injuries per 1,000 fires is decreasing. Compared to the North Carolina value the number of injuries per 1,000 fires is higher.
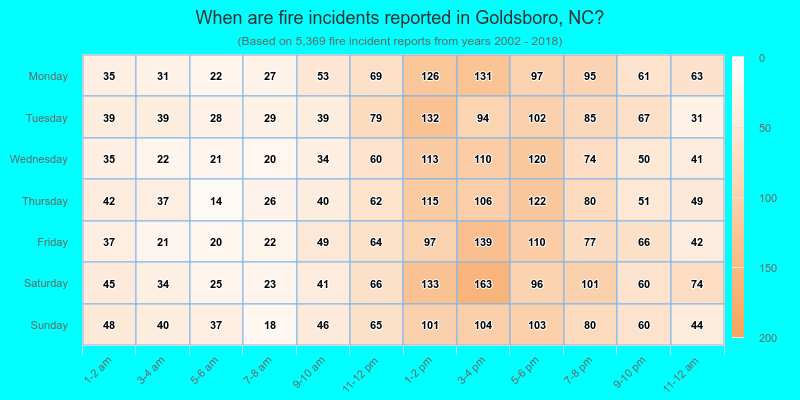
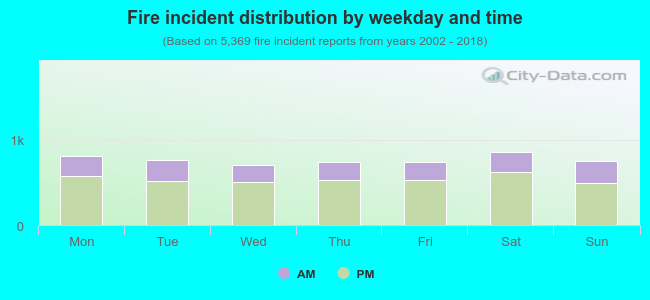 29.9% incidents where reported in the morning and 70.1% in the evening. The most fires (16.0%) took place on Saturday, and the least (13.0%) on Wednesday.
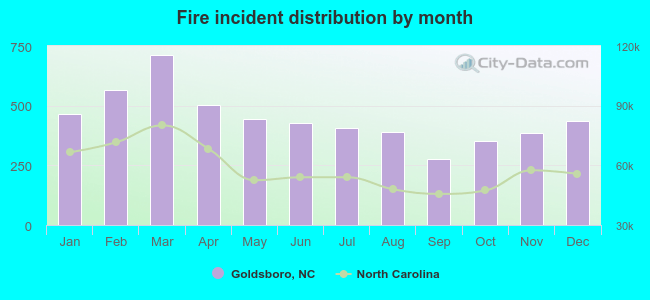 Based on the 5,369 fires from years 2002 - 2018 most fires (13.3%) took place during March, and the least (5.2%) in September.
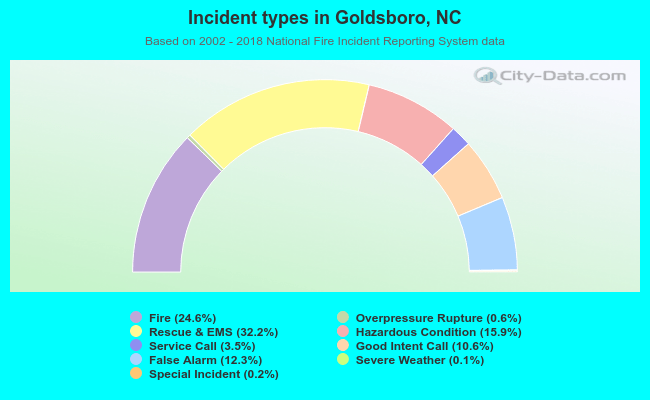 Out of all 21,814 cases reported during the years 2002 - 2018, the most belonged to the categories: Rescue & EMS (32.2%), Fire (24.6%), and Hazardous Condition (15.9%).
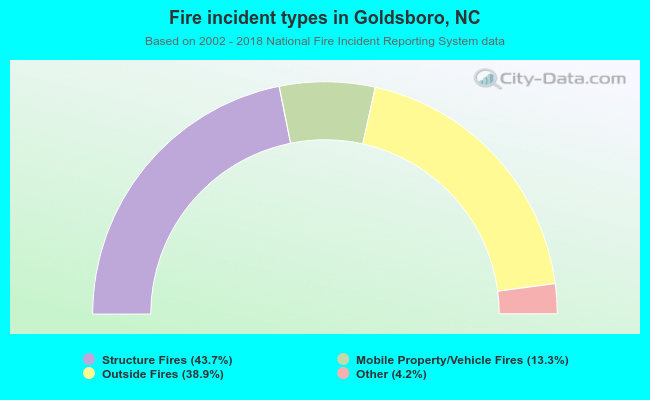 When looking into fire subcategories, the most reports belonged to: Structure Fires (43.7%), and Outside Fires (38.9%).