Smithfield: Fire Incidents, North Carolina (NC)
Where are fire incidents reported in Smithfield, NC
Something went wrong! Please refresh the page.
| Fire incidents reported | |
|---|---|
| Sreet name | Count |
| BRIGHTLEAF BLVD | 312 |
| NC 210 HWY | 140 |
| MARKET ST | 136 |
| SWIFT CREEK RD | 96 |
| BROGDEN RD | 90 |
| US 70 BUS HWY | 80 |
| US 70 HWY | 76 |
| CLEVELAND RD | 72 |
| I-95 HWY | 64 |
| THIRD ST | 64 |
| BUFFALO RD | 60 |
| MALLARD RD | 60 |
| YELVERTON GROVE RD | 58 |
| PACKING PLANT RD | 56 |
| INDUSTRIAL PARK DR | 52 |
| CRANTOCK RD | 46 |
| BARBOUR RD | 44 |
| FIFTH ST | 44 |
| WALL PAT RD | 44 |
| BOOKER DAIRY RD | 42 |
| SEVENTH ST | 42 |
| KAY DR | 36 |
| NORTH ST | 36 |
| US 301 HWY | 34 |
| WILSONS MILLS RD | 34 |
| BERKSHIRE RD | 28 |
| GALILEE RD | 28 |
| I-95 | 28 |
| FOURTH ST | 26 |
| RAND ST | 26 |
| Other | 392 |
2002 - 2018 National Fire Incident Reporting System (NFIRS) incidents
- Incident types reported to NFIRS in Smithfield, NC
- 7,47752.6%Rescue & EMS
- 2,34616.5%Fire
- 1,59811.2%Hazardous Condition
- 1,2118.5%False Alarm
- 8856.2%Good Intent Call
- 4753.3%Service Call
- 2111.5%Severe Weather
- Fire incident types reported to NFIRS in Smithfield, NC
- 1,14348.7%Structure Fires
- 77533.0%Outside Fires
- 34914.9%Mobile Property/Vehicle Fires
- 793.4%Other
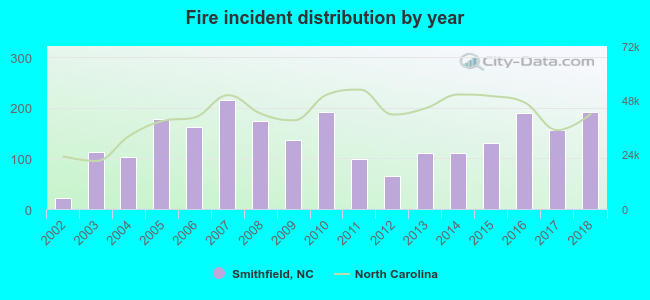 Based on the data from the years 2002 - 2018 the average number of fires per year is 138. The highest number of reported fire incidents - 215 took place in 2007, and the least - 21 in 2002. The data has a growing trend.
The average number of yearly fire incidents per 10k residents in Smithfield, NC compared to nearest cities:
(Note: Based on data for the last 3 years, including only cities with population 5,000 and above)
| Smithfield: | 152.5 |
| Selma: | 204.6 |
| Clayton: | 129.0 |
| Wendell: | 196.8 |
| Dunn: | 217.0 |
| Garner: | 53.3 |
| Knightdale: | 119.9 |
| Goldsboro: | 99.6 |
| Raleigh: | 24.8 |
 The median response time based on all reported fire incidents is 7 minutes. This is close to the state median value.
The median response time in Smithfield, NC compared to nearest cities:
(Note: Based on data for all years, including only cities with at least 500 fire incidents)
| Smithfield: | 7 minutes |
| Selma: | 8 minutes |
| Four Oaks: | 9 minutes |
| Princeton: | 8 minutes |
| Clayton: | 8 minutes |
| Kenly: | 8 minutes |
| Benson: | 9 minutes |
| Newton Grove: | 10 minutes |
| Wendell: | 6 minutes |
 Based on the reports from the years 2002 - 2018 the average number of fire-related yearly casualties is 1. The highest number of injuries - 3 took place in 2009, and the lowest - 0 in 2002. The data has a constant trend.
The average number of casualties per 1,000 fire incidents is 4. This indicator was the highest - 22 in 2009, and the lowest 0 in 2002. The trend for injuries per 1,000 fire incidents is constant. Compared to the state value the number of casualties per 1,000 incidents is lower.
Based on the reports from the years 2002 - 2018 the average number of fire-related yearly casualties is 1. The highest number of injuries - 3 took place in 2009, and the lowest - 0 in 2002. The data has a constant trend.
The average number of casualties per 1,000 fire incidents is 4. This indicator was the highest - 22 in 2009, and the lowest 0 in 2002. The trend for injuries per 1,000 fire incidents is constant. Compared to the state value the number of casualties per 1,000 incidents is lower.
 29.1% incidents where reported in the morning and 70.9% in the evening. The most fires (17.7%) took place on Saturday, and the least (12.4%) on Sunday.
 Based on the 2,346 fires from years 2002 - 2018 most fires (10.5%) took place during February, and the least (6.6%) in May.
 Out of all 14,218 cases reported during the years 2002 - 2018, the most belonged to the categories: Rescue & EMS (52.6%), Fire (16.5%), and Hazardous Condition (11.2%).
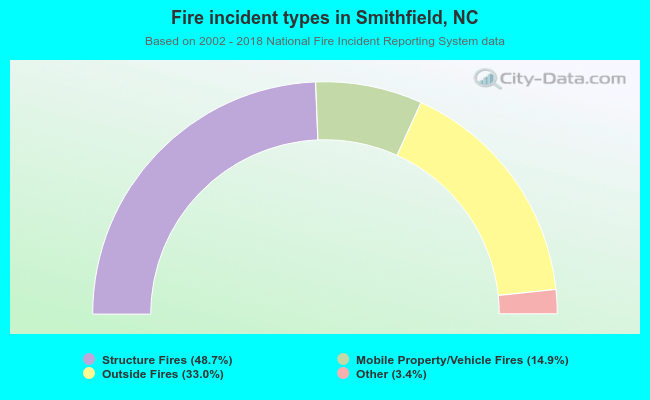 When looking into fire subcategories, the most reports belonged to: Structure Fires (48.7%), and Outside Fires (33.0%).