Clinton: Fire Incidents, North Carolina (NC)
Where are fire incidents reported in Clinton, NC
Something went wrong! Please refresh the page.
| Fire incidents reported | |
|---|---|
| Sreet name | Count |
| SOUTHEAST BLVD | 100 |
| TAYLORS BRIDGE HWY | 76 |
| HOBBTON HWY | 72 |
| SUNSET AVE | 66 |
| GARLAND HWY | 56 |
| ROSEBORO HWY | 54 |
| TURKEY HWY | 42 |
| RAILROAD ST | 38 |
| REEDSFORD RD | 38 |
| BOYKIN BRIDGE RD | 36 |
| FIVE BRIDGE RD | 36 |
| OLD US 701 HWY | 36 |
| HOBBTON HWY | 34 |
| US 421 HWY | 34 |
| ROYAL LN | 32 |
| WARSAW RD | 32 |
| SAMPSON ST | 30 |
| INDUSTRIAL DR | 28 |
| LISBON ST | 26 |
| NORTH BLVD | 26 |
| SUNSET AVENUE | 26 |
| BARDEN ST | 24 |
| BEAMAN WOODS RD | 24 |
| BOYKIN BRIDGE ROAD | 24 |
| BROWNS CHURCH RD | 24 |
| FAISON HWY | 24 |
| OLD WARSAW RD | 24 |
| BEAMAN ST | 22 |
| BIG PINEY GROVE RD | 22 |
| CARTERTOWN RD | 22 |
| Other | 1,199 |
2005 - 2018 National Fire Incident Reporting System (NFIRS) incidents
- Incident types reported to NFIRS in Clinton, NC
- 2,32739.0%Fire
- 1,24320.8%Hazardous Condition
- 87714.7%Rescue & EMS
- 79213.3%Good Intent Call
- 4557.6%False Alarm
- 2303.9%Service Call
- 310.5%Severe Weather
- 100.2%Overpressure Rupture
- 60.1%Special Incident
- Fire incident types reported to NFIRS in Clinton, NC
- 1,32056.7%Structure Fires
- 72331.1%Outside Fires
- 24010.3%Mobile Property/Vehicle Fires
- 441.9%Other
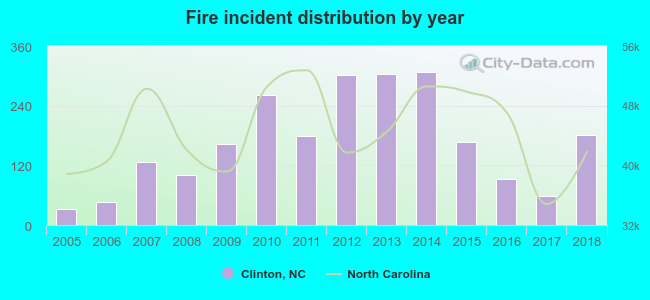 According to the data from the years 2005 - 2018 the average number of fires per year is 166. The highest number of reported fire incidents - 307 took place in 2014, and the least - 32 in 2005. The data has an increasing trend.
The average number of yearly fire incidents per 10k residents in Clinton, NC compared to nearest cities:
(Note: Based on data for the last 3 years, including only cities with population 5,000 and above)
| Clinton: | 126.3 |
| Dunn: | 217.0 |
| Goldsboro: | 99.6 |
| Fayetteville: | 65.8 |
| Smithfield: | 152.5 |
| Hope Mills: | 205.7 |
| Selma: | 204.6 |
| Spring Lake: | 144.1 |
| Fort Bragg: | 0.3 |
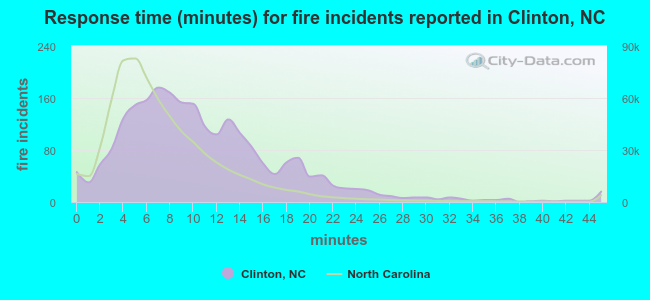 The median response time based on all reported fire incidents is 10 minutes. This is higher compared to the North Carolina median value.
The median response time in Clinton, NC compared to nearest cities:
(Note: Based on data for all years, including only cities with at least 500 fire incidents)
| Clinton: | 10 minutes |
| Salemburg: | 11 minutes |
| Roseboro: | 10 minutes |
| Faison: | 11 minutes |
| Warsaw: | 12 minutes |
| Garland: | 12 minutes |
| Newton Grove: | 10 minutes |
| Autryville: | 12 minutes |
| Mount Olive: | 8 minutes |
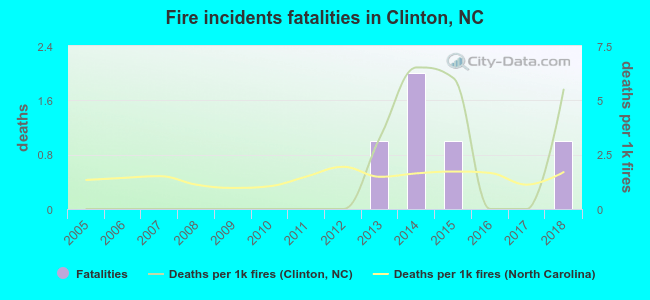 Based on the data from the years 2005 - 2018 the average number of fire-related yearly deaths is 0. The highest number of reported deaths - 2 took place in 2014, and the lowest - 0 in 2005. The data has an increasing trend.
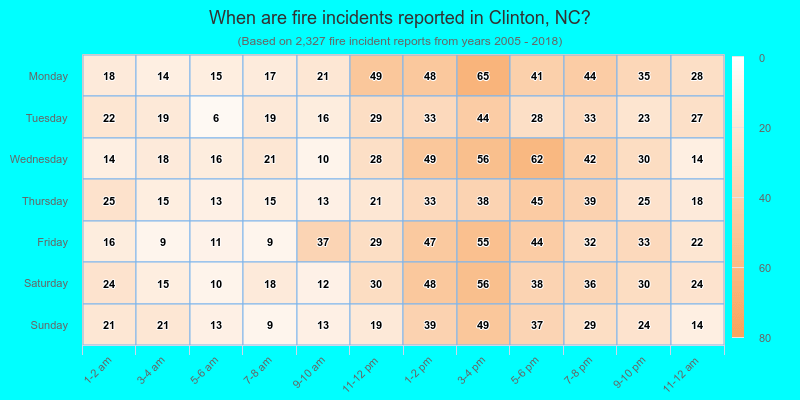
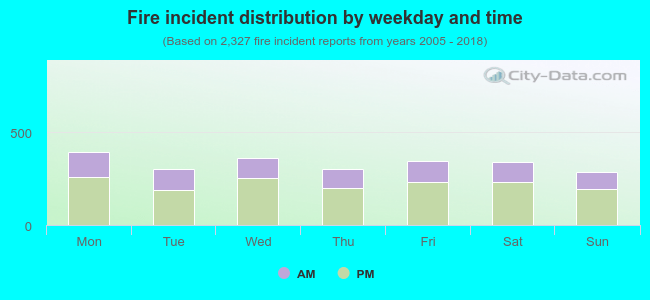 33.1% incidents where reported in the morning and 66.9% in the evening. The most fires (17.0%) took place on Monday, and the least (12.4%) on Sunday.
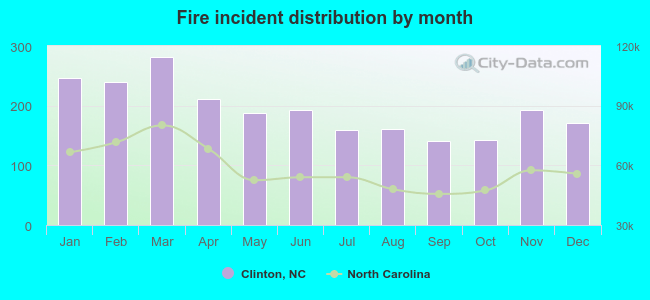 According to the 2,327 fire incident reports from years 2005 - 2018 most fires (12.1%) took place during March, and the least (6.0%) in September.
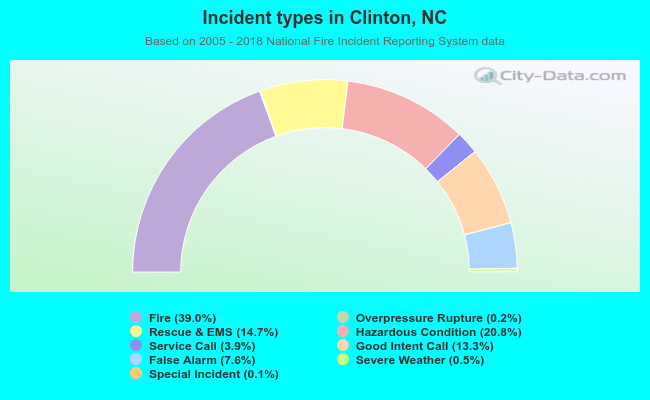 Out of all 5,971 cases reported during the years 2005 - 2018, the most belonged to the categories: Fire (39.0%), Hazardous Condition (20.8%), and Rescue & EMS (14.7%).
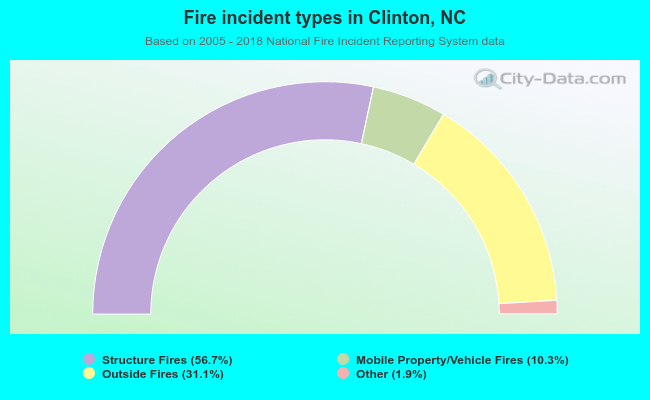 When looking into fire subcategories, the most incidents belonged to: Structure Fires (56.7%), and Outside Fires (31.1%).