Wilson: Fire Incidents, North Carolina (NC)
Where are fire incidents reported in Wilson, NC
Something went wrong! Please refresh the page.
| Fire incidents reported | |
|---|---|
| Sreet name | Count |
| WARD BLVD | 318 |
| NASH ST | 244 |
| FOREST HILLS RD | 200 |
| RALEIGH ROAD PKWY | 180 |
| TARBORO ST | 162 |
| GOLDSBORO ST | 156 |
| LIPSCOMB RD | 112 |
| GOLD ST | 90 |
| US 301 | 78 |
| BLACK CREEK RD | 76 |
| VANCE ST | 76 |
| PARK AVE | 74 |
| HINES ST | 72 |
| PENDER ST | 70 |
| WEAVER RD | 70 |
| GREEN ST | 64 |
| WILCO BLVD | 64 |
| HERRING AVE | 62 |
| DOWNING ST | 58 |
| KENAN ST | 56 |
| US 264 HWY | 56 |
| TILGHMAN RD | 52 |
| WALNUT ST | 52 |
| MANCHESTER ST | 50 |
| CORBETT AVE | 46 |
| MARTIN LUTHER KING JR PKWY | 46 |
| RAILROAD ST | 46 |
| STANTONSBURG RD | 46 |
| LEE ST | 44 |
| BELMONT AVE | 42 |
| Other | 2,008 |
2002 - 2018 National Fire Incident Reporting System (NFIRS) incidents
- Incident types reported to NFIRS in Wilson, NC
- 12,49839.5%Rescue & EMS
- 5,31616.8%Hazardous Condition
- 4,77015.1%Fire
- 3,70211.7%Good Intent Call
- 3,65011.5%False Alarm
- 1,5945.0%Service Call
- 340.1%Severe Weather
- Fire incident types reported to NFIRS in Wilson, NC
- 2,19646.0%Structure Fires
- 1,39529.2%Outside Fires
- 83917.6%Mobile Property/Vehicle Fires
- 3407.1%Other
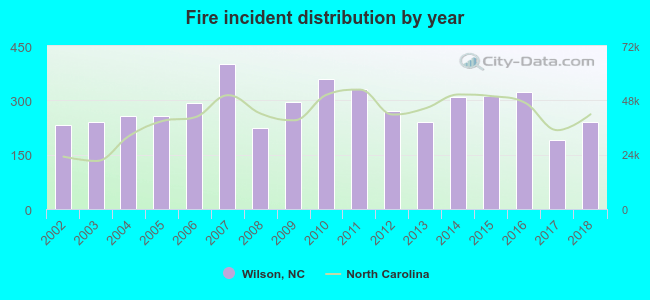 According to the data from the years 2002 - 2018 the average number of fires per year is 281. The highest number of fires - 399 took place in 2007, and the least - 191 in 2017. The data has an increasing trend.
The average number of yearly fire incidents per 10k residents in Wilson, NC compared to nearest cities:
(Note: Based on data for the last 3 years, including only cities with population 5,000 and above)
| Wilson: | 51.0 |
| Nashville: | 157.4 |
| Rocky Mount: | 52.5 |
| Tarboro: | 72.2 |
| Selma: | 204.6 |
| Goldsboro: | 99.6 |
| Wendell: | 196.8 |
| Smithfield: | 152.5 |
| Clayton: | 129.0 |
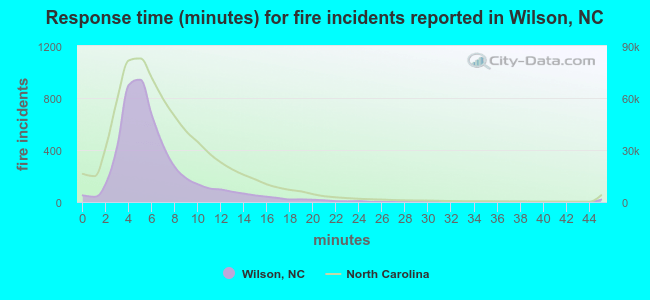 The median response time based on all reported fire incidents is 5 minutes. This is lower compared to the state median value.
The median response time in Wilson, NC compared to nearest cities:
(Note: Based on data for all years, including only cities with at least 500 fire incidents)
| Wilson: | 5 minutes |
| Elm City: | 11 minutes |
| Bailey: | 10 minutes |
| Kenly: | 8 minutes |
| Middlesex: | 9 minutes |
| Pikeville: | 7 minutes |
| Nashville: | 9 minutes |
| Rocky Mount: | 5 minutes |
| Spring Hope: | 11 minutes |
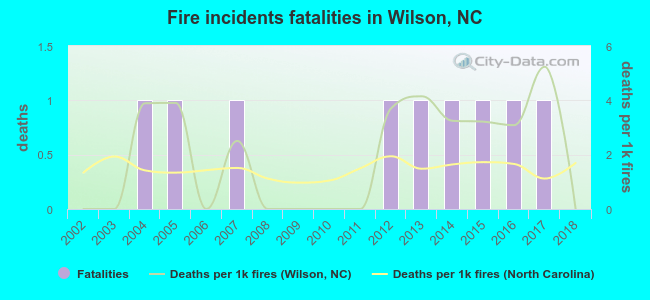 According to the reports from the years 2002 - 2018 the average number of fire-related fatalities per year is 1. The highest number of reported deaths - 1 took place in 2004, and the lowest - 0 in 2002. The data has a constant trend.
The average number of fatalities per 1,000 fires is 2. This indicator was the highest - 5 in 2017, and the lowest 0 in 2002. The trend for deaths per 1,000 fire incidents is constant. Compared to the North Carolina value the number of fatalities per 1,000 fire incidents is higher.
According to the reports from the years 2002 - 2018 the average number of fire-related fatalities per year is 1. The highest number of reported deaths - 1 took place in 2004, and the lowest - 0 in 2002. The data has a constant trend.
The average number of fatalities per 1,000 fires is 2. This indicator was the highest - 5 in 2017, and the lowest 0 in 2002. The trend for deaths per 1,000 fire incidents is constant. Compared to the North Carolina value the number of fatalities per 1,000 fire incidents is higher.Deaths per 1,000 incidents in Wilson, NC compared to nearest cities:
(Note: Based on data for all years, including only cities with at least 2,500 fire incidents)
| Wilson: | 1.9 |
| Rocky Mount: | 1.7 |
| Goldsboro: | 2.0 |
| Clayton: | 0.0 |
| Greenville: | 1.8 |
| Kinston: | 1.6 |
| Wake Forest: | 0.0 |
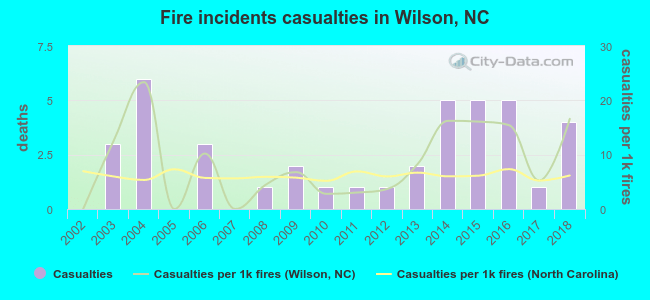 Based on the data from the years 2002 - 2018 the average number of fire-related yearly casualties is 2. The highest number of reported injuries - 6 took place in 2004, and the lowest - 0 in 2002. The data has a growing trend.
The average number of casualties per 1,000 fires is 9. This indicator was the highest - 23 in 2004, and the lowest 0 in 2002. The trend for casualties per 1,000 incidents is growing. Compared to the state value the number of injuries per 1,000 incidents is higher.
Based on the data from the years 2002 - 2018 the average number of fire-related yearly casualties is 2. The highest number of reported injuries - 6 took place in 2004, and the lowest - 0 in 2002. The data has a growing trend.
The average number of casualties per 1,000 fires is 9. This indicator was the highest - 23 in 2004, and the lowest 0 in 2002. The trend for casualties per 1,000 incidents is growing. Compared to the state value the number of injuries per 1,000 incidents is higher.Casualties per 1,000 incidents in Wilson, NC compared to nearest cities:
(Note: Based on data for all years, including only cities with at least 500 fire incidents)
| Wilson: | 8.4 |
| Elm City: | 1.3 |
| Bailey: | 1.5 |
| Kenly: | 12.3 |
| Middlesex: | 0.0 |
| Pikeville: | 2.6 |
| Nashville: | 5.6 |
| Rocky Mount: | 10.3 |
| Spring Hope: | 6.2 |
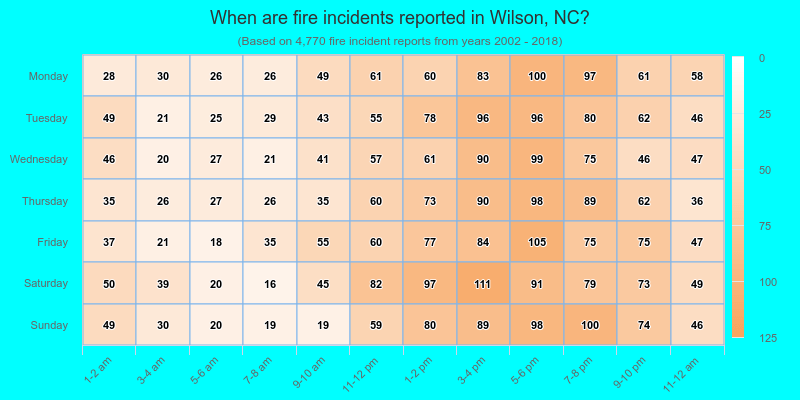
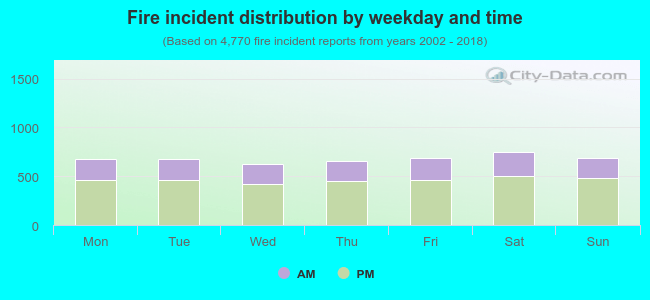 32.2% incidents where reported in the morning and 67.8% in the evening. The most fires (15.8%) took place on Saturday, and the least (13.2%) on Wednesday.
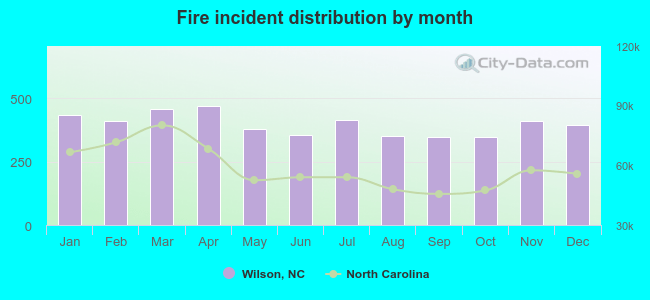 Based on the 4,770 fire incidents from years 2002 - 2018 most fires (9.9%) took place during April, and the least (7.3%) in September.
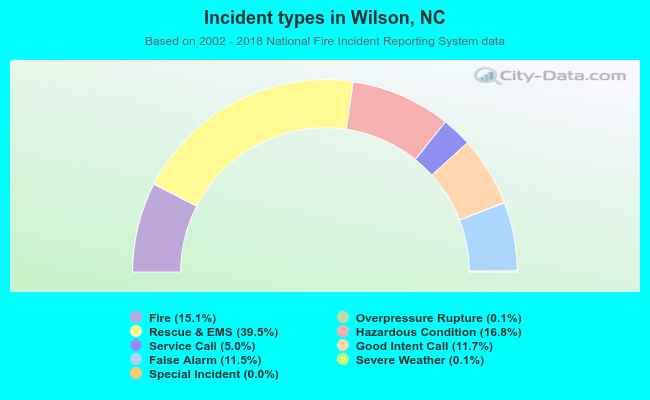 Out of all 31,602 cases reported during the years 2002 - 2018, the most belonged to the categories: Rescue & EMS (39.5%), Hazardous Condition (16.8%), and Fire (15.1%).
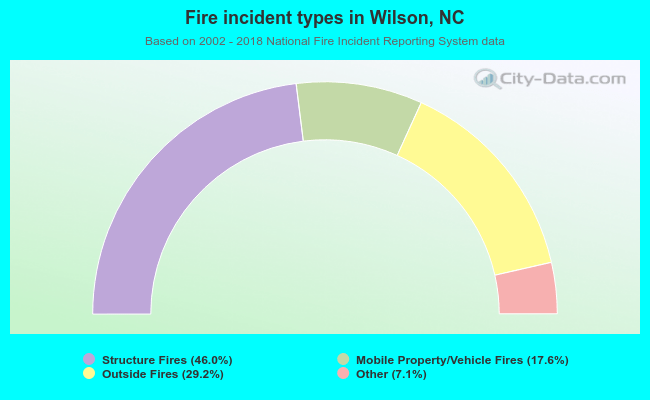 When looking into fire subcategories, the most reports belonged to: Structure Fires (46.0%), and Outside Fires (29.2%).