Fridley: Fire Incidents, Minnesota (MN)
Where are fire incidents reported in Fridley, MN
Something went wrong! Please refresh the page.
| Fire incidents reported | |
|---|---|
| Sreet name | Count |
| E RIVER RD | 344 |
| UNIVERSITY AVE | 256 |
| CENTRAL AVE | 172 |
| EAST RIVER RD | 140 |
| HWY 65 | 134 |
| OSBORNE RD | 134 |
| MAIN ST | 128 |
| MUTUAL AID | 118 |
| 73RD AVE | 110 |
| 5TH ST | 100 |
| 3RD ST | 98 |
| I694 | 92 |
| MISSISSIPPI ST | 92 |
| 83RD AVE | 76 |
| 7TH ST | 66 |
| INDUSTRIAL BLVD | 52 |
| 4TH ST | 48 |
| 2ND ST | 44 |
| 68TH AVE | 44 |
| ABLE ST | 40 |
| 52ND AVE | 38 |
| MUTUAL AID FRIDLEY | 38 |
| CHANNEL RD | 36 |
| 57TH AVE | 34 |
| CHERI LN | 34 |
| INTERSTATE 694 | 34 |
| BAKER AVE | 32 |
| CHARLES ST | 28 |
| POLK ST | 26 |
| 44TH AVE | 24 |
2002 - 2018 National Fire Incident Reporting System (NFIRS) incidents
- Incident types reported to NFIRS in Fridley, MN
- 11,76855.3%Rescue & EMS
- 2,23010.5%Fire
- 2,18110.2%Hazardous Condition
- 2,0199.5%Good Intent Call
- 1,5867.4%Service Call
- 1,4696.9%False Alarm
- 270.1%Overpressure Rupture
- Fire incident types reported to NFIRS in Fridley, MN
- 1,27157.0%Structure Fires
- 49522.2%Outside Fires
- 40017.9%Mobile Property/Vehicle Fires
- 642.9%Other
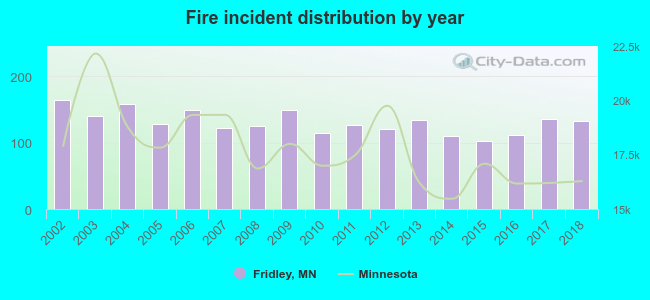 According to the data from the years 2002 - 2018 the average number of fires per year is 131. The highest number of fires - 164 took place in 2002, and the least - 103 in 2015. The data has a dropping trend.
The average number of yearly fire incidents per 10k residents in Fridley, MN compared to nearest cities:
(Note: Based on data for the last 3 years, including only cities with population 5,000 and above)
| Fridley: | 45.8 |
| Spring Lake Park: | 22.7 |
| Columbia Heights: | 33.0 |
| Brooklyn Center: | 38.6 |
| Mounds View: | 19.2 |
| New Brighton: | 30.8 |
| Brooklyn Park: | 30.2 |
| Arden Hills: | 20.6 |
| Blaine: | 16.9 |
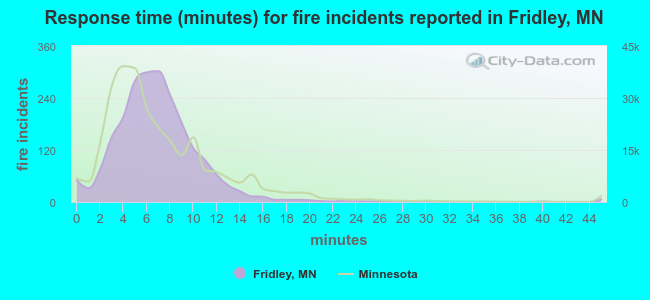 The median response time based on all reported fire incidents is 7 minutes. This is similar to the state median value.
The median response time in Fridley, MN compared to nearest cities:
(Note: Based on data for all years, including only cities with at least 500 fire incidents)
| Fridley: | 7 minutes |
| Columbia Heights: | 5 minutes |
| Brooklyn Center: | 6 minutes |
| Mounds View: | 7 minutes |
| New Brighton: | 4 minutes |
| Brooklyn Park: | 5 minutes |
| Blaine: | 7 minutes |
| Robbinsdale: | 6 minutes |
| Crystal: | 5 minutes |
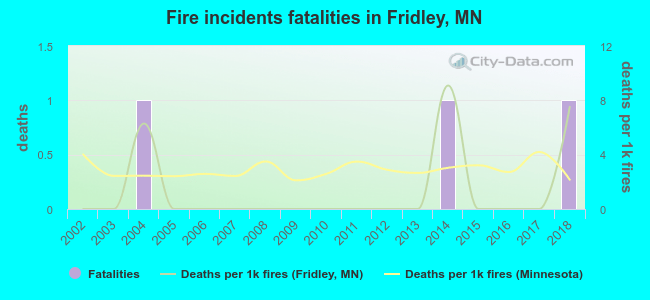 Based on the reports from the years 2002 - 2018 the average number of fire-related fatalities per year is 0. The highest number of reported deaths - 1 took place in 2004, and the lowest - 0 in 2002. The data has an increasing trend.
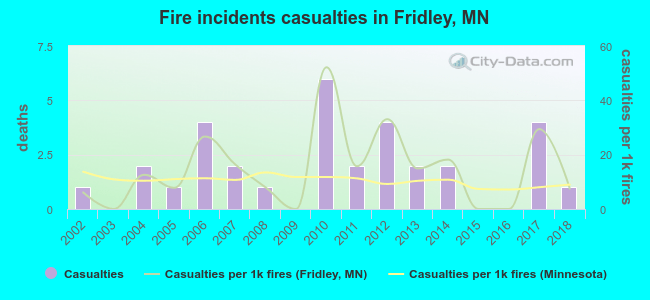 Based on the data from the years 2002 - 2018 the average number of fire-related yearly casualties is 2. The highest number of reported injuries - 6 took place in 2010, and the lowest - 0 in 2003. The data has a constant trend.
The average number of injuries per 1,000 fires is 15. This indicator was the highest - 52 in 2010, and the lowest 0 in 2003. The trend for injuries per 1,000 incidents is increasing. Compared to the Minnesota value the number of casualties per 1,000 fire incidents is higher.
Based on the data from the years 2002 - 2018 the average number of fire-related yearly casualties is 2. The highest number of reported injuries - 6 took place in 2010, and the lowest - 0 in 2003. The data has a constant trend.
The average number of injuries per 1,000 fires is 15. This indicator was the highest - 52 in 2010, and the lowest 0 in 2003. The trend for injuries per 1,000 incidents is increasing. Compared to the Minnesota value the number of casualties per 1,000 fire incidents is higher.Casualties per 1,000 incidents in Fridley, MN compared to nearest cities:
(Note: Based on data for all years, including only cities with at least 500 fire incidents)
| Fridley: | 14.3 |
| Columbia Heights: | 28.5 |
| Brooklyn Center: | 6.3 |
| Mounds View: | 25.0 |
| New Brighton: | 25.8 |
| Brooklyn Park: | 11.2 |
| Blaine: | 22.3 |
| Robbinsdale: | 1.7 |
| Crystal: | 13.1 |
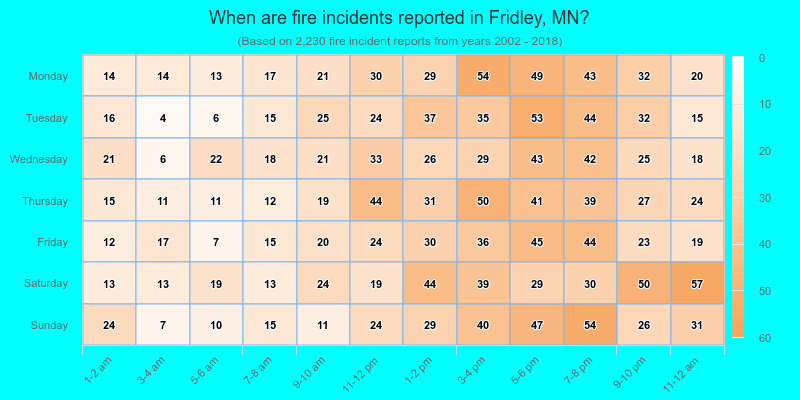
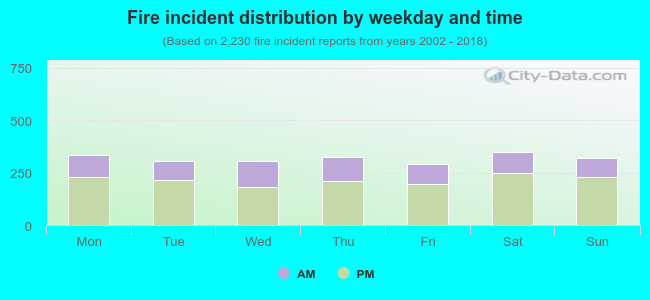 32.2% incidents where reported in the morning and 67.8% in the evening. The most fires (15.7%) took place on Saturday, and the least (13.1%) on Friday.
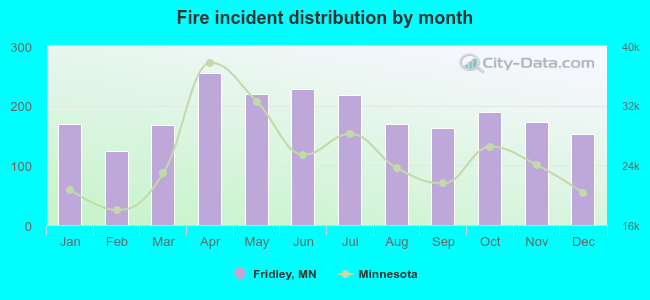 According to the 2,230 reports from years 2002 - 2018 most fires (11.4%) took place during April, and the least (5.6%) in February.
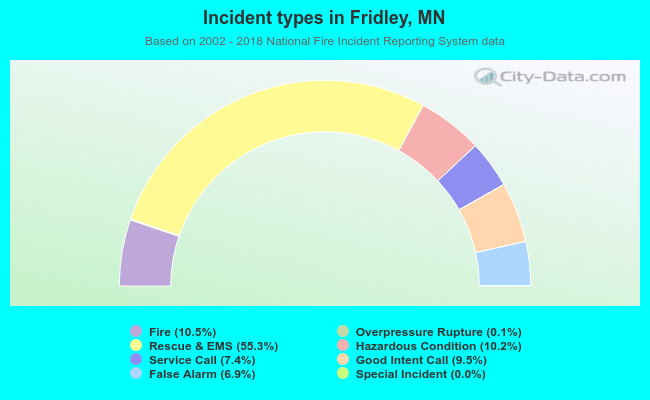 Out of all 21,290 cases reported during the years 2002 - 2018, the most belonged to the categories: Rescue & EMS (55.3%), Fire (10.5%), and Hazardous Condition (10.2%).
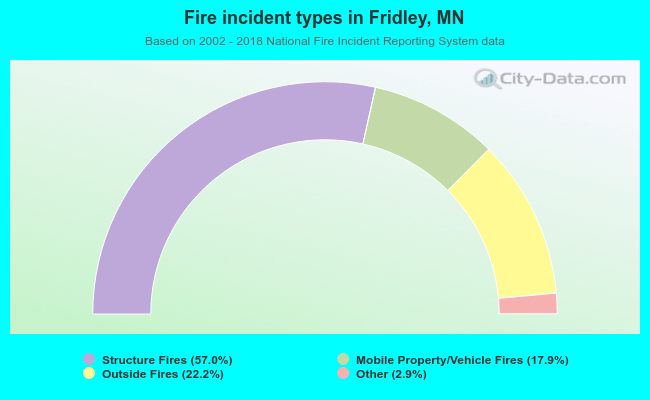 When looking into fire subcategories, the most reports belonged to: Structure Fires (57.0%), and Outside Fires (22.2%).