New Brighton: Fire Incidents, Minnesota (MN)
Where are fire incidents reported in New Brighton, MN
Something went wrong! Please refresh the page.
| Fire incidents reported | |
|---|---|
| Sreet name | Count |
| 10TH ST | 224 |
| OLD HIGHWAY 8 | 146 |
| SILVER LAKE RD | 122 |
| COUNTY ROAD D | 88 |
| 7TH ST | 86 |
| OLD 8 HWY | 78 |
| 5TH ST | 68 |
| LONG LAKE RD | 60 |
| COUNTY ROAD E | 52 |
| 1ST AVE | 42 |
| 10TH | 36 |
| CLEVELAND AVE | 30 |
| BLACK OAK DR | 26 |
| COUNTY D RD | 26 |
| 10 ST | 24 |
| 14TH ST | 24 |
| 5TH AVE | 24 |
| 17TH AVE | 22 |
| RICE CREEK RD | 22 |
| SILVER LAKE | 22 |
| W COUNTY ROAD D | 22 |
| 20TH AVE | 20 |
| 23RD AVE | 20 |
| 694 HWY | 20 |
| W COUNTY ROAD E | 20 |
| 2ND AVE | 18 |
| EB I 694 | 18 |
| THORNDALE AVE | 18 |
| 1ST ST | 16 |
| 29TH AVE | 16 |
2002 - 2018 National Fire Incident Reporting System (NFIRS) incidents
- Incident types reported to NFIRS in New Brighton, MN
- 1,23936.1%Fire
- 1,00229.2%Hazardous Condition
- 70620.6%False Alarm
- 2136.2%Service Call
- 1895.5%Good Intent Call
- 661.9%Rescue & EMS
- 160.5%Overpressure Rupture
- Fire incident types reported to NFIRS in New Brighton, MN
- 74259.9%Structure Fires
- 24820.0%Outside Fires
- 23318.8%Mobile Property/Vehicle Fires
- 161.3%Other
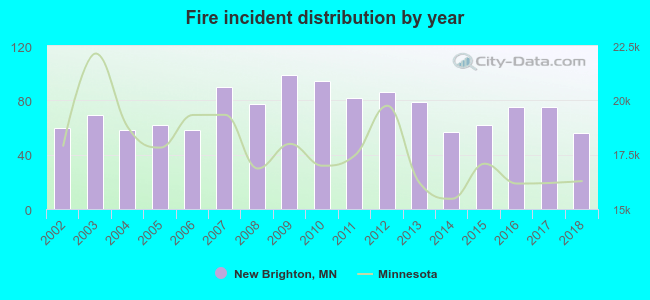 Based on the data from the years 2002 - 2018 the average number of fires per year is 73. The highest number of reported fires - 99 took place in 2009, and the least - 56 in 2018. The data has a declining trend.
The average number of yearly fire incidents per 10k residents in New Brighton, MN compared to nearest cities:
(Note: Based on data for the last 3 years, including only cities with population 5,000 and above)
| New Brighton: | 30.8 |
| Arden Hills: | 20.6 |
| Columbia Heights: | 33.0 |
| Mounds View: | 19.2 |
| Fridley: | 45.8 |
| Shoreview: | 11.8 |
| Spring Lake Park: | 22.7 |
| Roseville: | 26.0 |
| Brooklyn Center: | 38.6 |
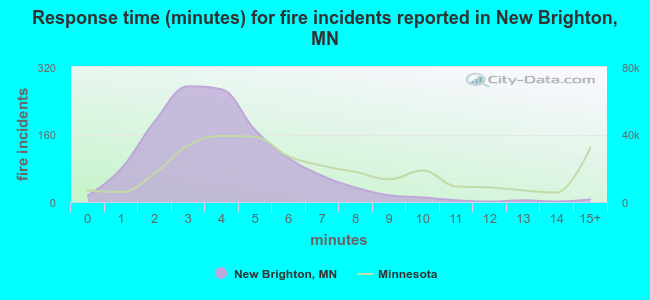 The median response time based on all reported fire incidents is 4 minutes. This is lower compared to the state median value.
The median response time in New Brighton, MN compared to nearest cities:
(Note: Based on data for all years, including only cities with at least 500 fire incidents)
| New Brighton: | 4 minutes |
| Columbia Heights: | 5 minutes |
| Mounds View: | 7 minutes |
| Fridley: | 7 minutes |
| Shoreview: | 6 minutes |
| Roseville: | 5 minutes |
| Brooklyn Center: | 6 minutes |
| Little Canada: | 3 minutes |
| Vadnais Heights: | 6 minutes |
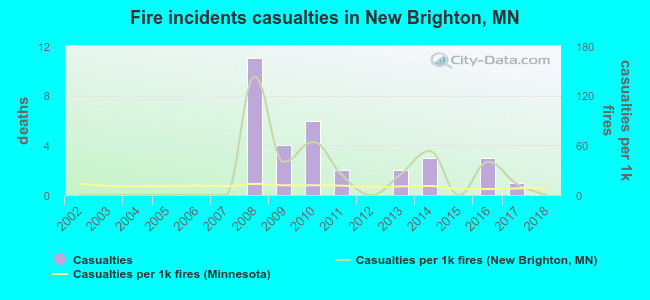 Based on the reports from the years 2002 - 2018 the average number of fire-related yearly casualties is 2. The highest number of reported casualties - 11 took place in 2008, and the lowest - 0 in 2002. The data has a constant trend.
The average number of casualties per 1,000 fire incidents is 24. This indicator was the highest - 143 in 2008, and the lowest 0 in 2002. The trend for casualties per 1,000 fire incidents is constant. Compared to the state value the number of injuries per 1,000 fires is much higher.
Based on the reports from the years 2002 - 2018 the average number of fire-related yearly casualties is 2. The highest number of reported casualties - 11 took place in 2008, and the lowest - 0 in 2002. The data has a constant trend.
The average number of casualties per 1,000 fire incidents is 24. This indicator was the highest - 143 in 2008, and the lowest 0 in 2002. The trend for casualties per 1,000 fire incidents is constant. Compared to the state value the number of injuries per 1,000 fires is much higher.Casualties per 1,000 incidents in New Brighton, MN compared to nearest cities:
(Note: Based on data for all years, including only cities with at least 500 fire incidents)
| New Brighton: | 25.8 |
| Columbia Heights: | 28.5 |
| Mounds View: | 25.0 |
| Fridley: | 14.3 |
| Shoreview: | 14.0 |
| Roseville: | 15.3 |
| Brooklyn Center: | 6.3 |
| Little Canada: | 2.6 |
| Vadnais Heights: | 5.9 |
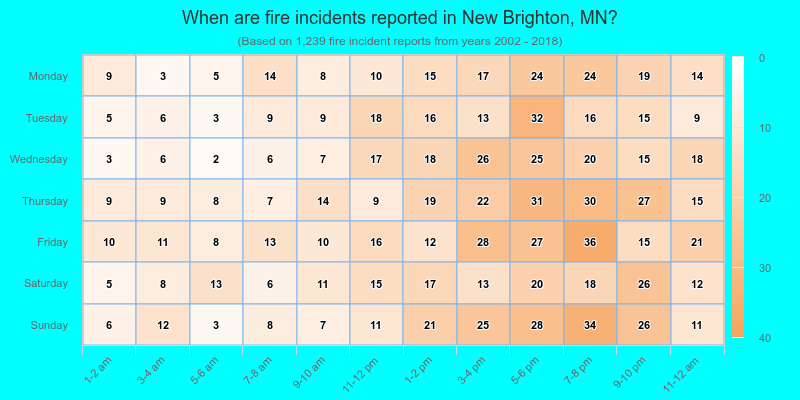
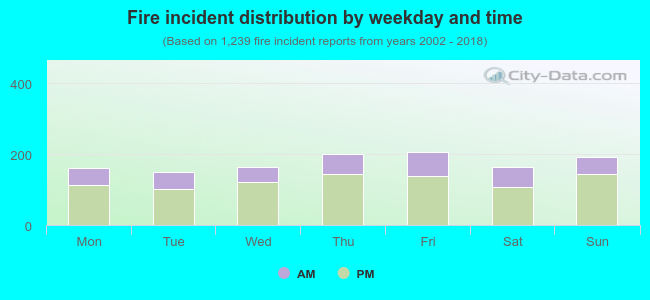 29.8% incidents where reported in the morning and 70.2% in the evening. The most fires (16.7%) took place on Friday, and the least (12.2%) on Tuesday.
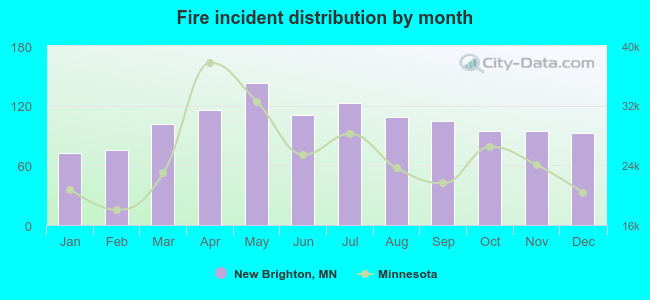 Based on the 1,239 incident reports from years 2002 - 2018 most fires (11.5%) took place during May, and the least (5.8%) in January.
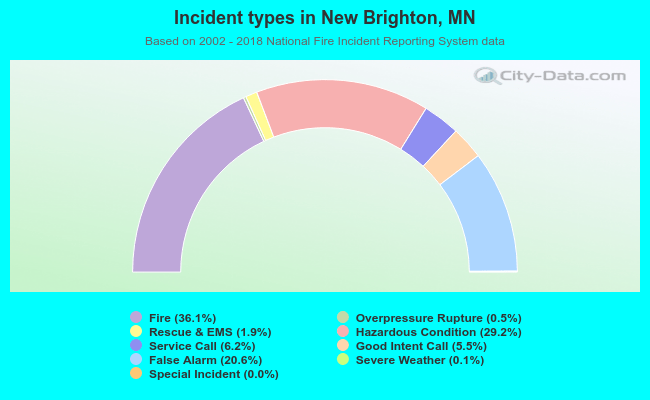 Out of all 3,435 cases reported during the years 2002 - 2018, the most belonged to the categories: Fire (36.1%), Hazardous Condition (29.2%), and False Alarm (20.6%).
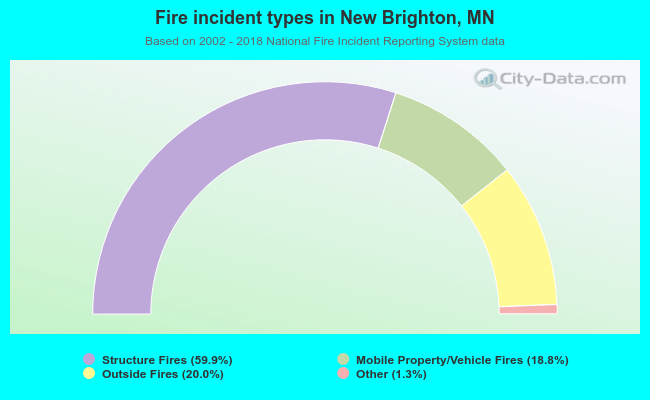 When looking into fire subcategories, the most reports belonged to: Structure Fires (59.9%), and Outside Fires (20.0%).