Robbinsdale: Fire Incidents, Minnesota (MN)
Where are fire incidents reported in Robbinsdale, MN
Something went wrong! Please refresh the page.
| Fire incidents reported | |
|---|---|
| Sreet name | Count |
| OAKDALE AVE | 172 |
| WEST BROADWAY AVE | 172 |
| GRIMES AVE | 116 |
| BROADWAY AVE | 110 |
| HUBBARD AVE | 78 |
| 37TH AVE | 76 |
| ABBOTT AVE | 76 |
| ZENITH AVE | 70 |
| HALIFAX AVE | 66 |
| REGENT AVE | 62 |
| 46TH AVE | 58 |
| FRANCE AVE | 58 |
| LAKELAND AVE | 56 |
| 42ND AVE | 54 |
| LAKE DR | 48 |
| PERRY AVE | 42 |
| 45TH AVE | 40 |
| BEARD AVE | 40 |
| DREW AVE | 36 |
| YORK AVE | 36 |
| QUAIL AVE | 32 |
| LEE AVE | 28 |
| COUNTY ROAD 81 | 24 |
| ROBBINS LNDG | 24 |
| SCOTT AVE | 24 |
| VERA CRUZ AVE | 22 |
| 36TH AVE | 20 |
| 40TH AVE | 20 |
| CHOWEN AVE | 20 |
| MAJOR AVE | 20 |
2002 - 2018 National Fire Incident Reporting System (NFIRS) incidents
- Incident types reported to NFIRS in Robbinsdale, MN
- 1,58238.9%Hazardous Condition
- 1,17829.0%Fire
- 66216.3%False Alarm
- 2907.1%Service Call
- 2225.5%Good Intent Call
- 1253.1%Rescue & EMS
- Fire incident types reported to NFIRS in Robbinsdale, MN
- 82269.8%Structure Fires
- 21318.1%Outside Fires
- 12310.4%Mobile Property/Vehicle Fires
- 201.7%Other
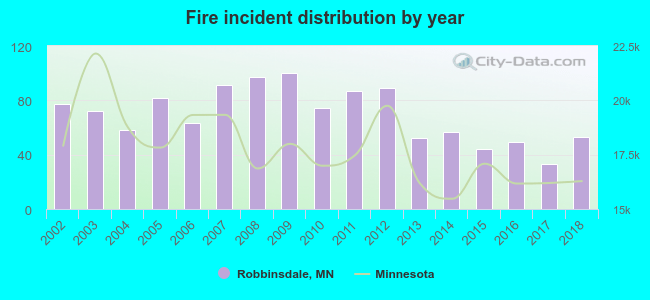 According to the data from the years 2002 - 2018 the average number of fires per year is 69. The highest number of fire incidents - 100 took place in 2009, and the least - 33 in 2017. The data has a decreasing trend.
The average number of yearly fire incidents per 10k residents in Robbinsdale, MN compared to nearest cities:
(Note: Based on data for the last 3 years, including only cities with population 5,000 and above)
| Robbinsdale: | 31.4 |
| Crystal: | 21.8 |
| Golden Valley: | 25.9 |
| New Hope: | 25.3 |
| Brooklyn Center: | 38.6 |
| Columbia Heights: | 33.0 |
| Brooklyn Park: | 30.2 |
| Minneapolis: | 24.5 |
| Fridley: | 45.8 |
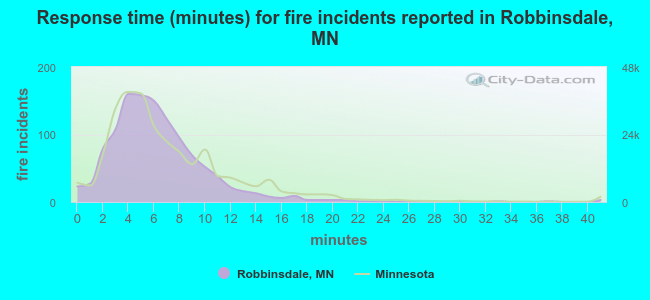 The median response time based on all reported fire incidents is 6 minutes. This is similar to the Minnesota median value.
The median response time in Robbinsdale, MN compared to nearest cities:
(Note: Based on data for all years, including only cities with at least 500 fire incidents)
| Robbinsdale: | 6 minutes |
| Crystal: | 5 minutes |
| Golden Valley: | 7 minutes |
| New Hope: | 5 minutes |
| Brooklyn Center: | 6 minutes |
| Columbia Heights: | 5 minutes |
| Brooklyn Park: | 5 minutes |
| Minneapolis: | 4 minutes |
| Fridley: | 7 minutes |
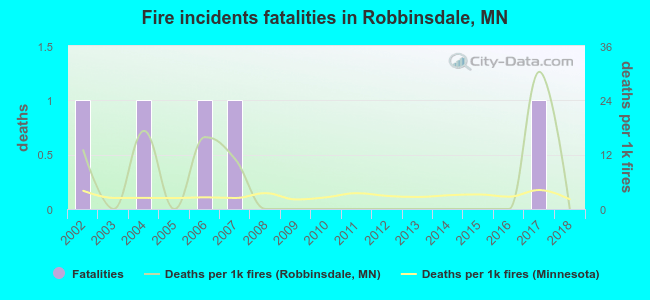 According to the data from the years 2002 - 2018 the average number of fire-related fatalities per year is 0. The highest number of reported deaths - 1 took place in 2002, and the lowest - 0 in 2003. The data has a decreasing trend.
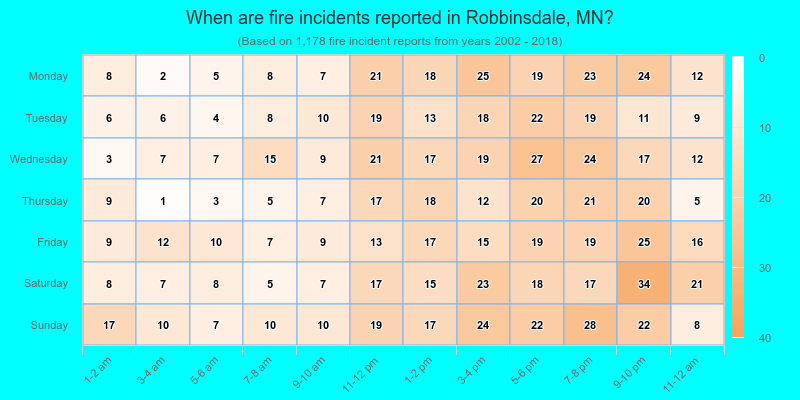
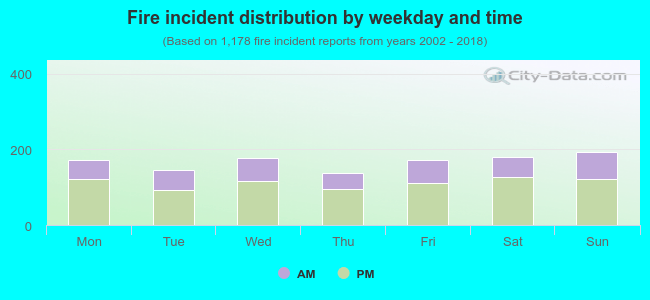 33.4% incidents where reported in the morning and 66.6% in the evening. The most fires (16.5%) took place on Sunday, and the least (11.7%) on Thursday.
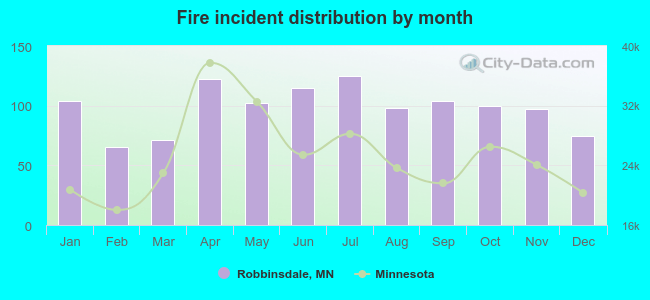 Based on the 1,178 incident reports from years 2002 - 2018 most fires (10.6%) took place during July, and the least (5.5%) in February.
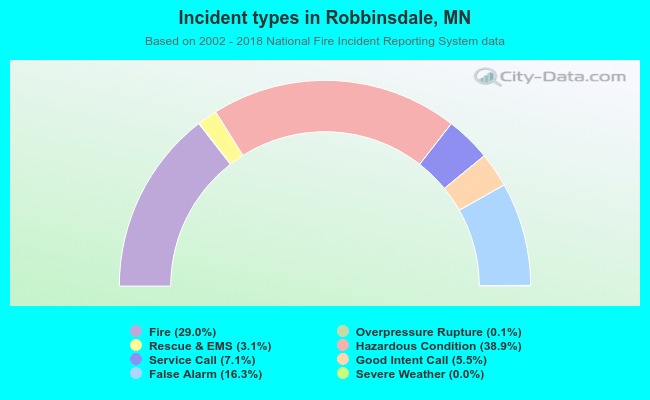 Out of all 4,065 cases reported during the years 2002 - 2018, the most belonged to the categories: Hazardous Condition (38.9%), Fire (29.0%), and False Alarm (16.3%).
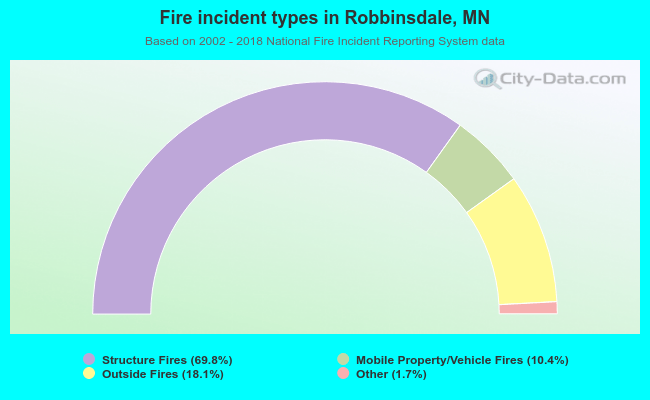 When looking into fire subcategories, the most incidents belonged to: Structure Fires (69.8%), and Outside Fires (18.1%).