Minneapolis: Fire Incidents, Minnesota (MN)
Where are fire incidents reported in Minneapolis, MN
Something went wrong! Please refresh the page.
| Fire incidents reported | |
|---|---|
| Sreet name | Count |
| 6 ST | 712 |
| LAKE ST | 700 |
| 4 ST | 640 |
| LYNDALE AVE | 572 |
| 2 ST | 464 |
| BRYANT AVE | 464 |
| FRANKLIN AVE | 416 |
| FREEWAY | 410 |
| HENNEPIN AVE | 404 |
| 7 ST | 396 |
| FREMONT AVE | 394 |
| PORTLAND AVE | 384 |
| NICOLLET AVE | 382 |
| DUPONT AVE | 378 |
| PENN AVE | 364 |
| ALDRICH AVE | 360 |
| EMERSON AVE | 360 |
| 9 ST | 352 |
| CHICAGO AVE | 336 |
| LYNDALE AV | 316 |
| 3 AVE | 310 |
| COLFAX AVE | 310 |
| 3 ST | 306 |
| 8 ST | 306 |
| WASHINGTON AVE | 306 |
| 2 AVE | 304 |
| DUPONT AV | 300 |
| GIRARD AVE | 296 |
| CEDAR AVE | 294 |
| IRVING AVE | 290 |
| Other | 14,337 |
2002 - 2018 National Fire Incident Reporting System (NFIRS) incidents
- Incident types reported to NFIRS in Minneapolis, MN
- 151,24358.7%Rescue & EMS
- 26,16310.1%Fire
- 25,5819.9%False Alarm
- 22,7988.8%Good Intent Call
- 17,5256.8%Hazardous Condition
- 14,0255.4%Service Call
- 3070.1%Overpressure Rupture
- Fire incident types reported to NFIRS in Minneapolis, MN
- 13,11650.1%Structure Fires
- 8,00930.6%Outside Fires
- 4,97619.0%Mobile Property/Vehicle Fires
- 620.2%Other
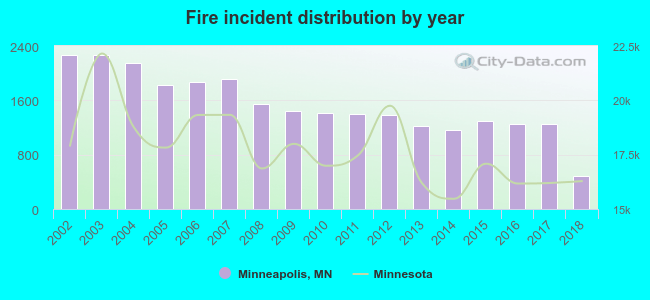 According to the data from the years 2002 - 2018 the average number of fire incidents per year is 1,539. The highest number of fire incidents - 2,269 took place in 2002, and the least - 481 in 2018. The data has a decreasing trend.
The average number of yearly fire incidents per 10k residents in Minneapolis, MN compared to nearest cities:
(Note: Based on data for the last 3 years, including only cities with population 5,000 and above)
| Minneapolis: | 24.5 |
| Golden Valley: | 25.9 |
| Falcon Heights: | 23.6 |
| Robbinsdale: | 31.4 |
| Columbia Heights: | 33.0 |
| Richfield: | 20.8 |
| Edina: | 18.1 |
| Roseville: | 26.0 |
| Crystal: | 21.8 |
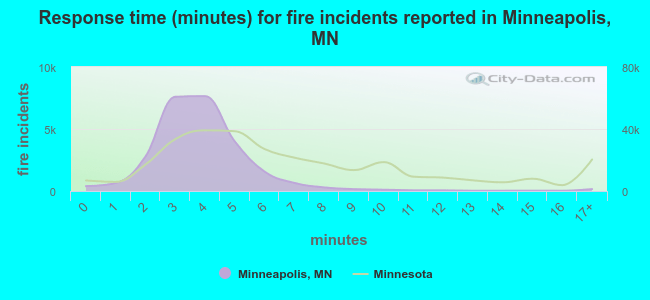 The median response time based on all reported fire incidents is 4 minutes. This is lower than the Minnesota median value.
The median response time in Minneapolis, MN compared to nearest cities:
(Note: Based on data for all years, including only cities with at least 500 fire incidents)
| Minneapolis: | 4 minutes |
| St. Louis Park: | 5 minutes |
| Golden Valley: | 7 minutes |
| Robbinsdale: | 6 minutes |
| Columbia Heights: | 5 minutes |
| Richfield: | 4 minutes |
| Edina: | 5 minutes |
| Roseville: | 5 minutes |
| Crystal: | 5 minutes |
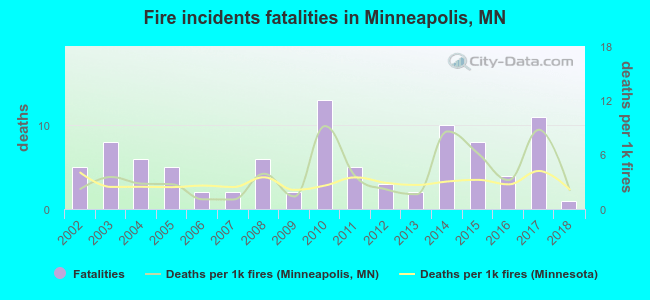 Based on the reports from the years 2002 - 2018 the average number of fire-related fatalities per year is 5. The highest number of deaths - 13 took place in 2010, and the lowest - 1 in 2018. The data has a declining trend.
The average number of deaths per 1,000 fires is 4. This indicator was the highest - 9 in 2010, and the lowest 1 in 2007. The trend for fatalities per 1,000 fire incidents is declining. Compared to the state value the number of deaths per 1,000 fires is higher.
Based on the reports from the years 2002 - 2018 the average number of fire-related fatalities per year is 5. The highest number of deaths - 13 took place in 2010, and the lowest - 1 in 2018. The data has a declining trend.
The average number of deaths per 1,000 fires is 4. This indicator was the highest - 9 in 2010, and the lowest 1 in 2007. The trend for fatalities per 1,000 fire incidents is declining. Compared to the state value the number of deaths per 1,000 fires is higher.Deaths per 1,000 incidents in Minneapolis, MN compared to nearest cities:
(Note: Based on data for all years, including only cities with at least 2,500 fire incidents)
| Minneapolis: | 3.6 |
| Bloomington: | 1.8 |
| Plymouth: | 0.3 |
| Brooklyn Park: | 1.1 |
| Burnsville: | 2.0 |
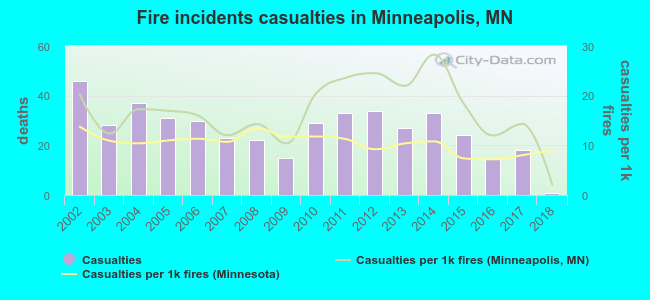 According to the reports from the years 2002 - 2018 the average number of fire-related casualties per year is 26. The highest number of casualties - 46 took place in 2002, and the lowest - 1 in 2018. The data has a decreasing trend.
The average number of casualties per 1,000 fire incidents is 17. This indicator was the highest - 28 in 2014, and the lowest 2 in 2018. The trend for injuries per 1,000 incidents is dropping. Compared to the state value the number of injuries per 1,000 fire incidents is higher.
According to the reports from the years 2002 - 2018 the average number of fire-related casualties per year is 26. The highest number of casualties - 46 took place in 2002, and the lowest - 1 in 2018. The data has a decreasing trend.
The average number of casualties per 1,000 fire incidents is 17. This indicator was the highest - 28 in 2014, and the lowest 2 in 2018. The trend for injuries per 1,000 incidents is dropping. Compared to the state value the number of injuries per 1,000 fire incidents is higher.Casualties per 1,000 incidents in Minneapolis, MN compared to nearest cities:
(Note: Based on data for all years, including only cities with at least 500 fire incidents)
| Minneapolis: | 17.0 |
| St. Louis Park: | 32.2 |
| Golden Valley: | 2.1 |
| Robbinsdale: | 1.7 |
| Columbia Heights: | 28.5 |
| Richfield: | 20.5 |
| Edina: | 40.5 |
| Roseville: | 15.3 |
| Crystal: | 13.1 |
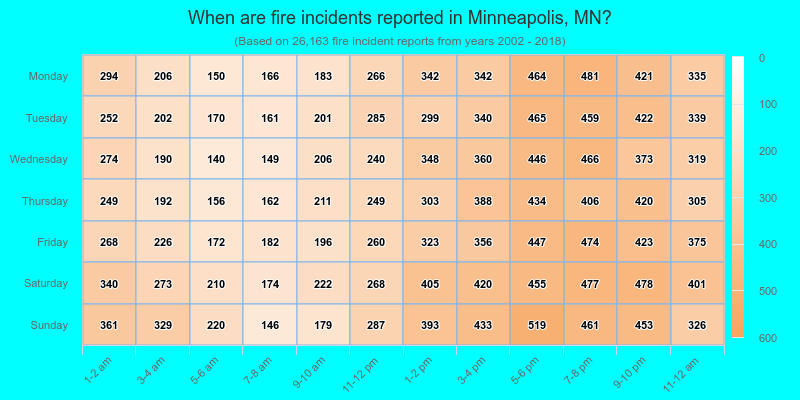
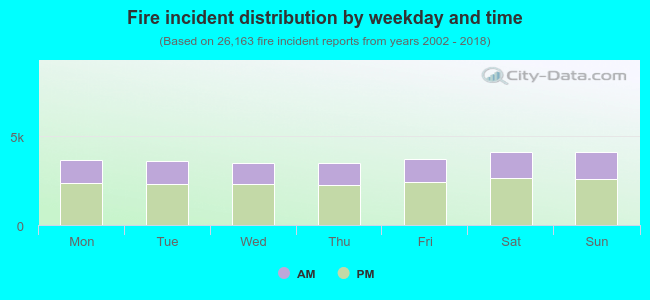 35.4% incidents where reported in the morning and 64.6% in the evening. The most fires (15.8%) took place on Saturday, and the least (13.3%) on Thursday.
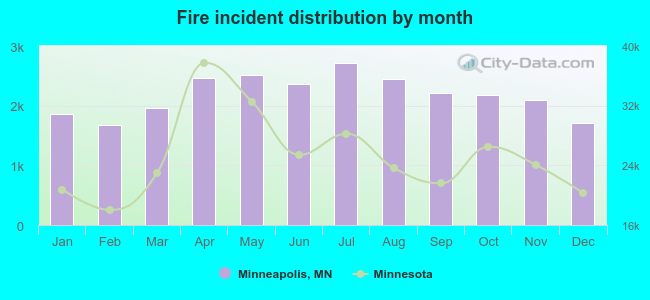 According to the 26,163 reports from years 2002 - 2018 most fires (10.3%) took place during July, and the least (6.4%) in February.
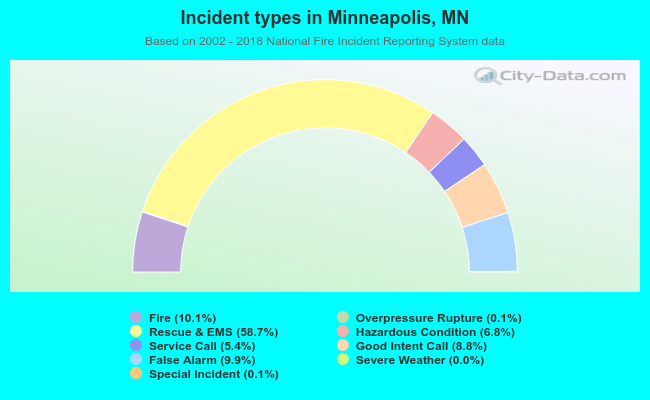 Out of all 257,829 cases reported during the years 2002 - 2018, the most belonged to the categories: Rescue & EMS (58.7%), Fire (10.1%), and False Alarm (9.9%).
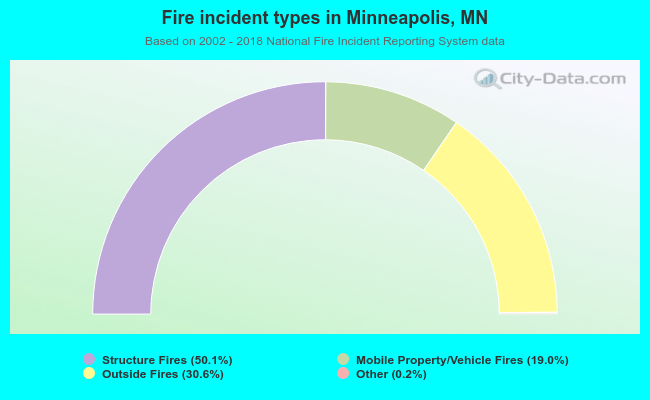 When looking into fire subcategories, the most incidents belonged to: Structure Fires (50.1%), and Outside Fires (30.6%).