Blaine: Fire Incidents, Minnesota (MN)
Where are fire incidents reported in Blaine, MN
Something went wrong! Please refresh the page.
| Fire incidents reported | |
|---|---|
| Sreet name | Count |
| CENTRAL AVE | 168 |
| UNIVERSITY AVE | 110 |
| LEXINGTON AVE | 92 |
| 109TH AVE | 68 |
| JEFFERSON ST | 64 |
| POLK ST | 60 |
| 125TH AVE | 54 |
| BALTIMORE ST | 54 |
| NORTHTOWN DR | 54 |
| PHEASANT RIDGE DR | 54 |
| 7TH ST | 52 |
| 3RD ST | 48 |
| I 35W | 48 |
| ULYSSES ST | 44 |
| 6TH ST | 42 |
| 91ST AVE | 42 |
| ABERDEEN ST | 42 |
| NAPLES ST | 42 |
| OAK PARK BLVD | 40 |
| RADISSON RD | 40 |
| US HIGHWAY 10 | 38 |
| 105TH AVE | 36 |
| 5TH ST | 34 |
| DAVENPORT ST | 34 |
| 93RD AVE | 32 |
| MUTUAL AID BLAINE | 32 |
| 85TH AVE | 30 |
| 89TH AVE | 30 |
| 87TH AVE | 28 |
| BALL RD | 28 |
| Other | 526 |
2002 - 2018 National Fire Incident Reporting System (NFIRS) incidents
- Incident types reported to NFIRS in Blaine, MN
- 2,15925.7%Hazardous Condition
- 2,06624.6%Fire
- 1,33415.9%False Alarm
- 1,25915.0%Rescue & EMS
- 1,01812.1%Good Intent Call
- 4715.6%Service Call
- 460.5%Overpressure Rupture
- 270.3%Severe Weather
- 90.1%Special Incident
- Fire incident types reported to NFIRS in Blaine, MN
- 93145.1%Structure Fires
- 64931.4%Outside Fires
- 47523.0%Mobile Property/Vehicle Fires
- 110.5%Other
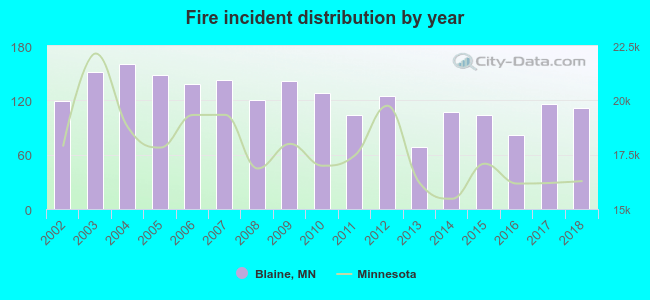 According to the data from the years 2002 - 2018 the average number of fires per year is 122. The highest number of reported fire incidents - 160 took place in 2004, and the least - 69 in 2013. The data has a declining trend.
The average number of yearly fire incidents per 10k residents in Blaine, MN compared to nearest cities:
(Note: Based on data for the last 3 years, including only cities with population 5,000 and above)
| Blaine: | 16.9 |
| Spring Lake Park: | 22.7 |
| Mounds View: | 19.2 |
| Coon Rapids: | 20.4 |
| Fridley: | 45.8 |
| Lino Lakes: | 20.4 |
| New Brighton: | 30.8 |
| Shoreview: | 11.8 |
| Ham Lake: | 25.2 |
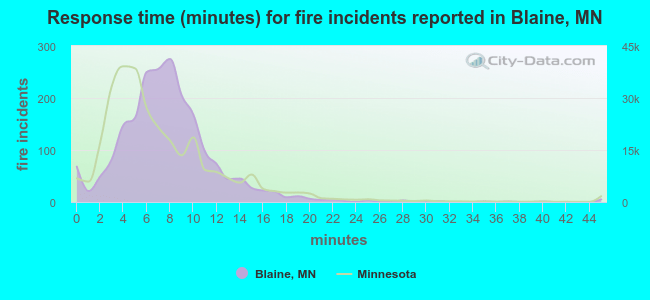 The median response time based on all reported fire incidents is 7 minutes. This is similar to the state median value.
The median response time in Blaine, MN compared to nearest cities:
(Note: Based on data for all years, including only cities with at least 500 fire incidents)
| Blaine: | 7 minutes |
| Mounds View: | 7 minutes |
| Coon Rapids: | 5 minutes |
| Fridley: | 7 minutes |
| Lino Lakes: | 7 minutes |
| New Brighton: | 4 minutes |
| Shoreview: | 6 minutes |
| Ham Lake: | 7 minutes |
| Brooklyn Park: | 5 minutes |
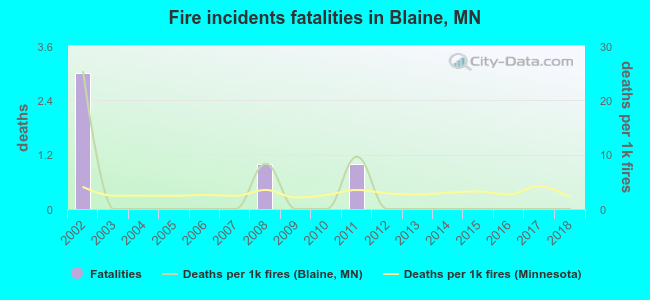 Based on the data from the years 2002 - 2018 the average number of fire-related yearly deaths is 0. The highest number of reported deaths - 3 took place in 2002, and the lowest - 0 in 2003. The data has a dropping trend.
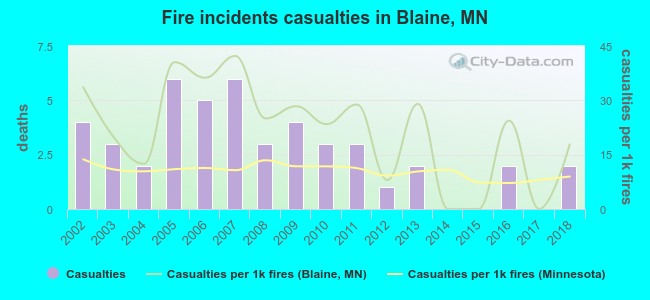 Based on the data from the years 2002 - 2018 the average number of fire-related casualties per year is 3. The highest number of reported injuries - 6 took place in 2005, and the lowest - 0 in 2014. The data has a dropping trend.
The average number of injuries per 1,000 fire incidents is 22. This indicator was the highest - 42 in 2007, and the lowest 0 in 2014. The trend for injuries per 1,000 incidents is decreasing. Compared to the state value the number of casualties per 1,000 incidents is much higher.
Based on the data from the years 2002 - 2018 the average number of fire-related casualties per year is 3. The highest number of reported injuries - 6 took place in 2005, and the lowest - 0 in 2014. The data has a dropping trend.
The average number of injuries per 1,000 fire incidents is 22. This indicator was the highest - 42 in 2007, and the lowest 0 in 2014. The trend for injuries per 1,000 incidents is decreasing. Compared to the state value the number of casualties per 1,000 incidents is much higher.Casualties per 1,000 incidents in Blaine, MN compared to nearest cities:
(Note: Based on data for all years, including only cities with at least 500 fire incidents)
| Blaine: | 22.3 |
| Mounds View: | 25.0 |
| Coon Rapids: | 14.4 |
| Fridley: | 14.3 |
| Lino Lakes: | 3.4 |
| New Brighton: | 25.8 |
| Shoreview: | 14.0 |
| Ham Lake: | 0.0 |
| Brooklyn Park: | 11.2 |
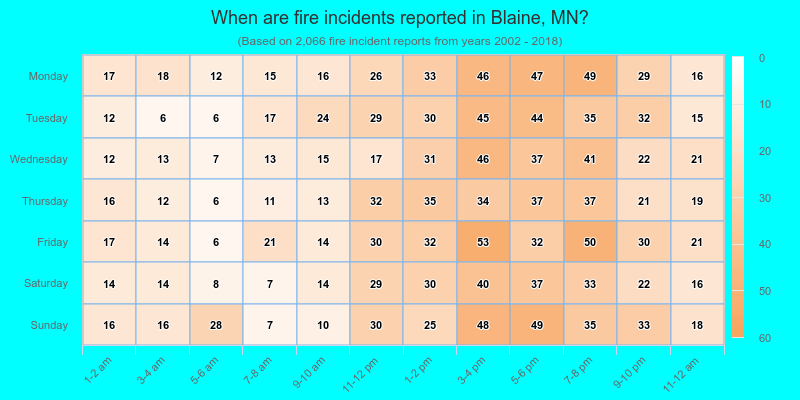
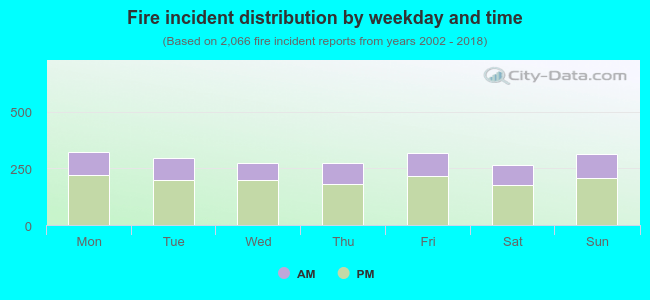 31.9% incidents where reported in the morning and 68.1% in the evening. The most fires (15.7%) took place on Monday, and the least (12.8%) on Saturday.
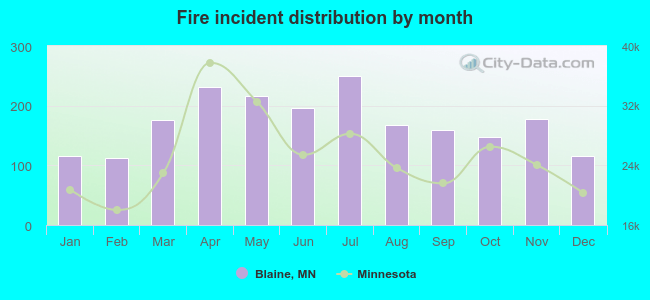 Based on the 2,066 fires from years 2002 - 2018 most fires (12.1%) took place during July, and the least (5.5%) in February.
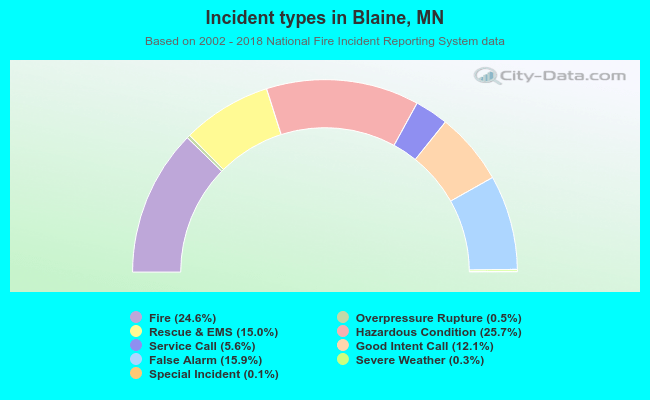 Out of all 8,389 cases reported during the years 2002 - 2018, the most belonged to the categories: Hazardous Condition (25.7%), Fire (24.6%), and False Alarm (15.9%).
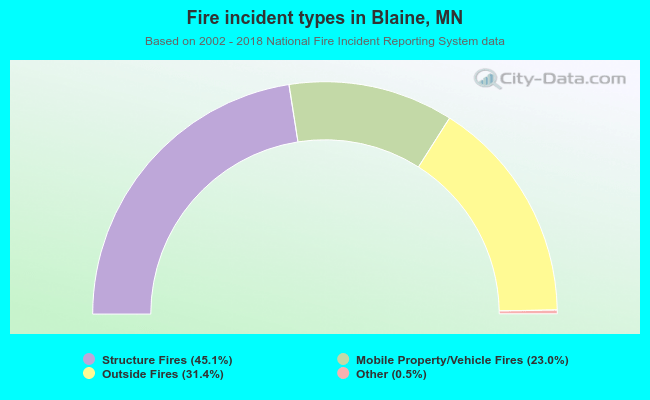 When looking into fire subcategories, the most incidents belonged to: Structure Fires (45.1%), and Outside Fires (31.4%).