Watsonville, California
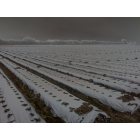
Watsonville: Acres of strawberry fields that surround the town of Watsonville.
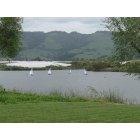
Watsonville: Tyann Lake
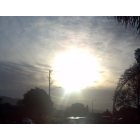
Watsonville: On Riverside and Blackburn st. looking west towards the football field up to the sky.
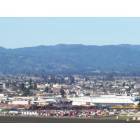
Watsonville: city of watsonville
- add
your
Submit your own pictures of this city and show them to the world
- OSM Map
- General Map
- Google Map
- MSN Map
Population change since 2000: +16.4%
 |
| Males: 25,480 | |
| Females: 26,045 |
| Median resident age: | 33.3 years |
| California median age: | 37.9 years |
Zip codes: 95076.
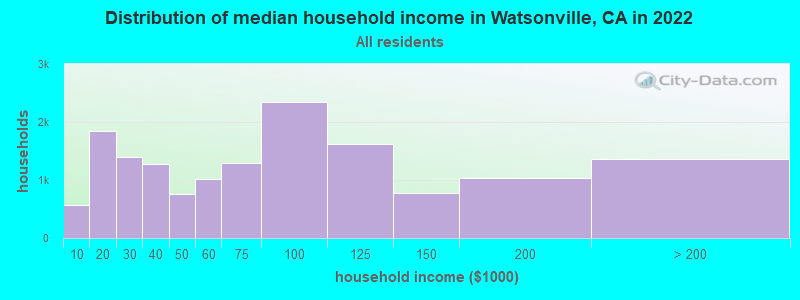
| Watsonville: | $70,728 |
| CA: | $91,551 |
Estimated per capita income in 2022: $26,401 (it was $13,205 in 2000)
Watsonville city income, earnings, and wages data
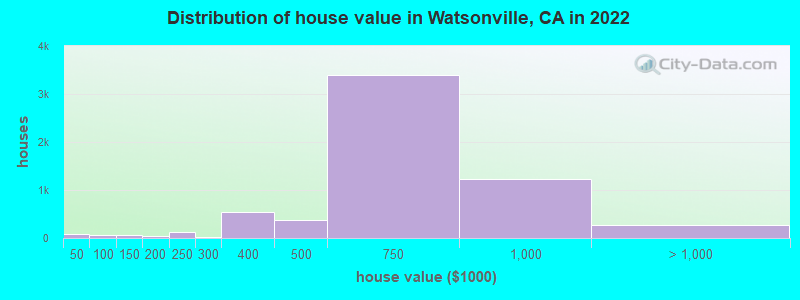
Estimated median house or condo value in 2022: $671,564 (it was $207,300 in 2000)
| Watsonville: | $671,564 |
| CA: | $715,900 |
Mean prices in 2022: all housing units: $709,005; detached houses: $776,477; townhouses or other attached units: $669,413; in 2-unit structures: $405,071; in 3-to-4-unit structures: $484,934; in 5-or-more-unit structures: $328,050; mobile homes: $229,540
Median gross rent in 2022: $1,654.
(19.3% for White Non-Hispanic residents, 1.5% for Black residents, 13.3% for Hispanic or Latino residents, 6.8% for American Indian residents, 14.8% for other race residents, 10.4% for two or more races residents)
Detailed information about poverty and poor residents in Watsonville, CA


Compare current foreclosures in Watsonville, CA:
| Photo | Address | Area | Beds / Baths | Price | Details |
|---|---|---|---|---|---|

|
#1
Enos Ln
Watsonville, CA 95076
|
2,179 sq. feet
|
2 baths 3 beds |
show details | |

|
#2
Alisa Cir
Watsonville, CA 95076
|
1,026 sq. feet
|
1 baths 2 beds |
show details | |

|
#3
Willow Rd
Watsonville, CA 95076
|
1,976 sq. feet
|
1 baths 4 beds |
show details | |

|
#4
Las Lomas Dr
Watsonville, CA 95076
|
1,259 sq. feet
|
2 baths 3 beds |
show details | |

|
#5
Osborn Rd
Watsonville, CA 95076
|
1,228 sq. feet
|
1 baths 3 beds |
show details | |

|
#6
Fruitland Ave
Watsonville, CA 95076
|
2,345 sq. feet
|
2 baths 2 beds |
show details | |

|
#7
Gregory Rd
Watsonville, CA 95076
|
1,619 sq. feet
|
2 baths 4 beds |
show details | |

|
#8
Las Lomas Dr
Watsonville, CA 95076
|
1,120 sq. feet
|
1 baths 3 beds |
show details | |

|
#9
Johnson Rd
Watsonville, CA 95076
|
1,852 sq. feet
|
3 baths 6 beds |
show details | |

|
#10
Gregory Rd
Watsonville, CA 95076
|
1,619 sq. feet
|
2 baths 4 beds |
show details |
| Photo | Address | Area | Beds / Baths | Price | Details |
|---|---|---|---|---|---|

|
#11
Mark Ave
Watsonville, CA 95076
|
- sq. feet
|
2 baths 3 beds |
show details | |

|
#12
Pioneer Rd
Watsonville, CA 95076
|
- sq. feet
|
2 baths 3 beds |
show details | |

|
#13
W 5th St # A
Watsonville, CA 95076
|
- sq. feet
|
1 baths 3 beds |
show details | |

|
#14
Eureka Canyon Rd
Watsonville, CA 95076
|
- sq. feet
|
1 baths 2 beds |
show details | |

|
#15
Packard Ln
Watsonville, CA 95076
|
- sq. feet
|
2 baths 3 beds |
show details | |

|
#16
Joyce Dr
Watsonville, CA 95076
|
- sq. feet
|
2 baths 2 beds |
show details | |

|
#17
Green Valley Rd
Watsonville, CA 95076
|
- sq. feet
|
1 baths 2 beds |
show details | |

|
#18
Morehouse Dr
Watsonville, CA 95076
|
- sq. feet
|
2 baths 5 beds |
show details | |

|
#19
Summit Rd
Watsonville, CA 95076
|
- sq. feet
|
2 baths 4 beds |
show details | |

|
#20
Bronte Ave
Watsonville, CA 95076
|
- sq. feet
|
1 baths 2 beds |
show details |
| Photo | Address | Area | Beds / Baths | Price | Details |
|---|---|---|---|---|---|

|
#21
Lynbrook Ct
Watsonville, CA 95076
|
- sq. feet
|
2 baths 2 beds |
show details | |

|
#22
E Riverside Dr
Watsonville, CA 95076
|
- sq. feet
|
1 baths 3 beds |
show details | |

|
#23
Beverly Dr
Watsonville, CA 95076
|
- sq. feet
|
2 baths 3 beds |
show details | |

|
#24
Bright View Ln
Watsonville, CA 95076
|
- sq. feet
|
2 baths 3 beds |
show details | |

|
#25
Rodriguez St
Watsonville, CA 95076
|
- sq. feet
|
1 baths 1 beds |
show details | |

|
#26
Cutter Dr
Watsonville, CA 95076
|
- sq. feet
|
2 baths 3 beds |
show details | |

|
#27
Shasta St
Watsonville, CA 95076
|
- sq. feet
|
2 baths 3 beds |
show details | |

|
#28
Weeks Dr
Watsonville, CA 95076
|
- sq. feet
|
2 baths 2 beds |
show details | |

|
#29
Green Valley Rd
Watsonville, CA 95076
|
- sq. feet
|
2 baths 3 beds |
show details | |

|
#30
Freedom Blvd # A
Watsonville, CA 95076
|
- sq. feet
|
2 baths 3 beds |
show details |
| Photo | Address | Area | Beds / Baths | Price | Details |
|---|---|---|---|---|---|

|
#31
Freedom Blvd
Watsonville, CA 95076
|
- sq. feet
|
1 baths 2 beds |
show details | |

|
#32
Rialto Dr
Watsonville, CA 95076
|
- sq. feet
|
2 baths 3 beds |
show details | |

|
#33
Oregon St
Watsonville, CA 95076
|
- sq. feet
|
1 baths 2 beds |
show details | |

|
#34
Rainbow Ln
Watsonville, CA 95076
|
- sq. feet
|
2 baths 4 beds |
show details | |

|
#35
Bronson St
Watsonville, CA 95076
|
- sq. feet
|
1 baths 3 beds |
show details | |

|
#36
Vista Verde Cir
Watsonville, CA 95076
|
- sq. feet
|
4 baths 4 beds |
show details | |

|
#37
E Beach St
Watsonville, CA 95076
|
- sq. feet
|
1 baths 3 beds |
show details | |

|
#38
Oakridge Ct
Watsonville, CA 95076
|
- sq. feet
|
2 baths 3 beds |
show details | |

|
#39
Rosewood Dr
Watsonville, CA 95076
|
- sq. feet
|
2 baths 3 beds |
show details | |

|
#40
E High St
Watsonville, CA 95076
|
- sq. feet
|
2 baths 3 beds |
show details |
| Photo | Address | Area | Beds / Baths | Price | Details |
|---|---|---|---|---|---|

|
#41
Shasta St
Watsonville, CA 95076
|
- sq. feet
|
2 baths 3 beds |
show details | |

|
#42
Clifford Ave
Watsonville, CA 95076
|
- sq. feet
|
2 baths 3 beds |
show details | |

|
#43
Vista Pointe Dr
Watsonville, CA 95076
|
- sq. feet
|
2 baths 4 beds |
show details | |

|
#44
Enos Ln
Watsonville, CA 95076
|
- sq. feet
|
- baths - beds |
show details | |

|
#45
Mar Monte Ave
Watsonville, CA 95076
|
- sq. feet
|
- baths - beds |
show details | |

|
#46
Porter Dr
Watsonville, CA 95076
|
- sq. feet
|
1 baths - beds |
show details | |

|
#47
Ortega Dr Apt D
Watsonville, CA 95076
|
- sq. feet
|
- baths - beds |
show details | |

|
#48
Bree Ln
Watsonville, CA 95076
|
- sq. feet
|
- baths - beds |
show details | |

|
#49
Calabasas Rd
Watsonville, CA 95076
|
- sq. feet
|
- baths - beds |
show details | |

|
Check over 1 million property listings on Foreclosure.com!
|
browse all offers | |||


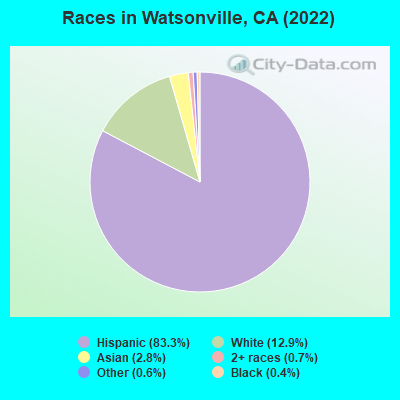
- 42,99583.3%Hispanic
- 6,68612.9%White alone
- 1,4702.8%Asian alone
- 3810.7%Two or more races
- 2910.6%Other race alone
- 1890.4%Black alone
- 400.08%American Indian alone
According to our research of California and other state lists, there were 84 registered sex offenders living in Watsonville, California as of April 27, 2024.
The ratio of all residents to sex offenders in Watsonville is 639 to 1.
The ratio of registered sex offenders to all residents in this city is near the state average.
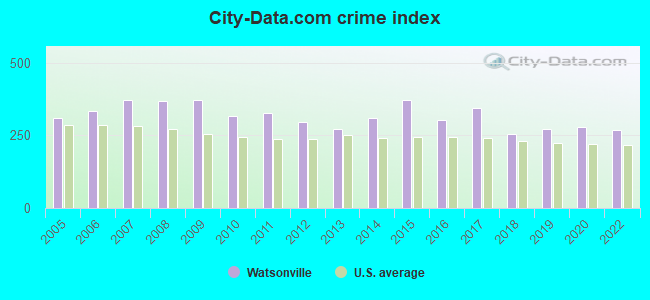
The City-Data.com crime index weighs serious crimes and violent crimes more heavily. Higher means more crime, U.S. average is 246.1. It adjusts for the number of visitors and daily workers commuting into cities.
- means the value is smaller than the state average.- means the value is about the same as the state average.
- means the value is bigger than the state average.
- means the value is much bigger than the state average.
Crime rate in Watsonville detailed stats: murders, rapes, robberies, assaults, burglaries, thefts, arson
Full-time law enforcement employees in 2021, including police officers: 90 (71 officers - 65 male; 6 female).
| Officers per 1,000 residents here: | 1.37 |
| California average: | 2.30 |
 Recent articles from our blog. Our writers, many of them Ph.D. graduates or candidates, create easy-to-read articles on a wide variety of topics.


Latest news from Watsonville, CA collected exclusively by city-data.com from local newspapers, TV, and radio stations
Ancestries: Portuguese (1.9%), American (1.1%).
Current Local Time: PST time zone
Elevation: 29 feet
Land area: 6.35 square miles.
Population density: 8,112 people per square mile (high).
18,568 residents are foreign born (31.9% Latin America).
| This city: | 36.0% |
| California: | 26.5% |
Median real estate property taxes paid for housing units with mortgages in 2022: $4,663 (0.7%)
Median real estate property taxes paid for housing units with no mortgage in 2022: $3,328 (0.5%)
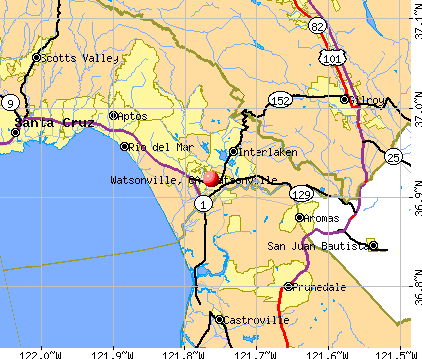
Nearest city with pop. 50,000+: Santa Cruz, CA  (15.0 miles , pop. 54,593).
Nearest city with pop. 200,000+: San Jose, CA (27.2 miles , pop. 894,943).
Nearest city with pop. 1,000,000+: Los Angeles, CA (273.5 miles , pop. 3,694,820).
Nearest cities:
), ), ), ), ), )Latitude: 36.92 N, Longitude: 121.76 W
Daytime population change due to commuting: +1,068 (+2.1%)
Workers who live and work in this city: 9,352 (43.4%)
Area code: 831
Watsonville, California accommodation & food services, waste management - Economy and Business Data
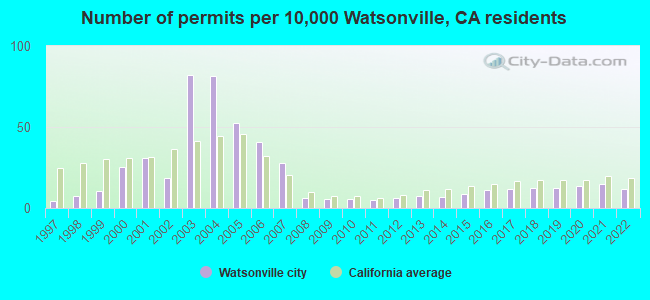
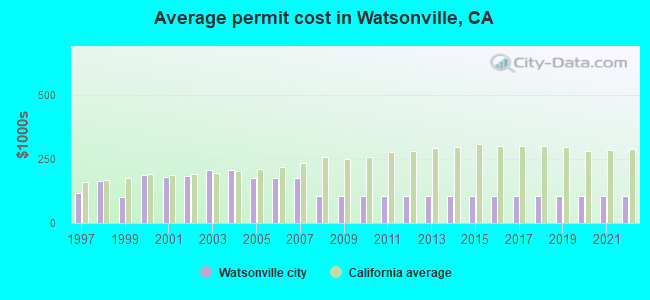
Single-family new house construction building permits:
- 2022: 53 buildings, average cost: $105,500
- 2021: 66 buildings, average cost: $105,500
- 2020: 60 buildings, average cost: $105,500
- 2019: 55 buildings, average cost: $105,500
- 2018: 55 buildings, average cost: $105,500
- 2017: 52 buildings, average cost: $105,500
- 2016: 49 buildings, average cost: $105,500
- 2015: 39 buildings, average cost: $105,500
- 2014: 31 buildings, average cost: $105,500
- 2013: 33 buildings, average cost: $105,500
- 2012: 28 buildings, average cost: $105,500
- 2011: 21 buildings, average cost: $105,500
- 2010: 25 buildings, average cost: $105,500
- 2009: 24 buildings, average cost: $105,500
- 2008: 28 buildings, average cost: $105,500
- 2007: 123 buildings, average cost: $175,600
- 2006: 181 buildings, average cost: $175,600
- 2005: 231 buildings, average cost: $175,600
- 2004: 362 buildings, average cost: $206,600
- 2003: 364 buildings, average cost: $209,200
- 2002: 82 buildings, average cost: $183,700
- 2001: 136 buildings, average cost: $178,500
- 2000: 112 buildings, average cost: $186,600
- 1999: 46 buildings, average cost: $102,800
- 1998: 32 buildings, average cost: $164,500
- 1997: 19 buildings, average cost: $119,100
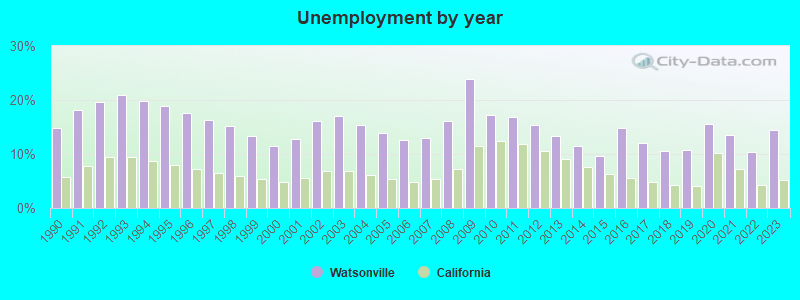
| Here: | 14.5% |
| California: | 5.1% |
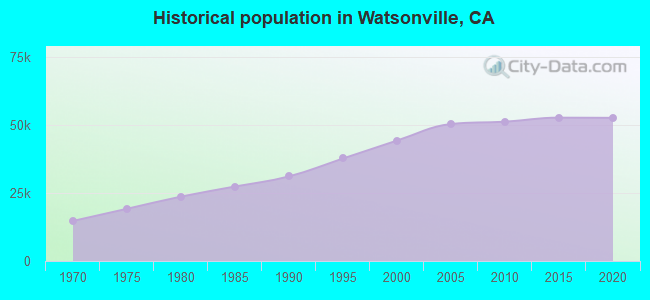
Population change in the 1990s: +10,406 (+30.7%).
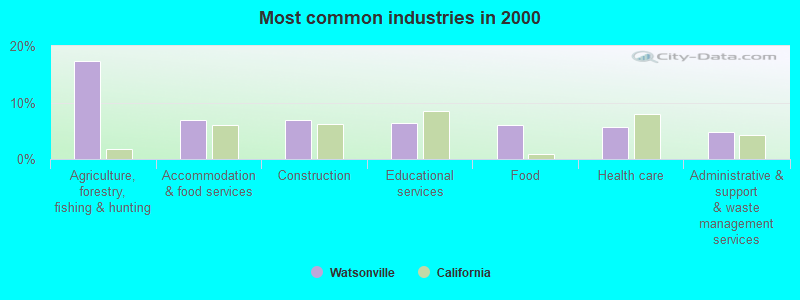
- Agriculture, forestry, fishing & hunting (17.4%)
- Accommodation & food services (6.9%)
- Construction (6.9%)
- Educational services (6.4%)
- Food (6.0%)
- Health care (5.8%)
- Administrative & support & waste management services (4.8%)
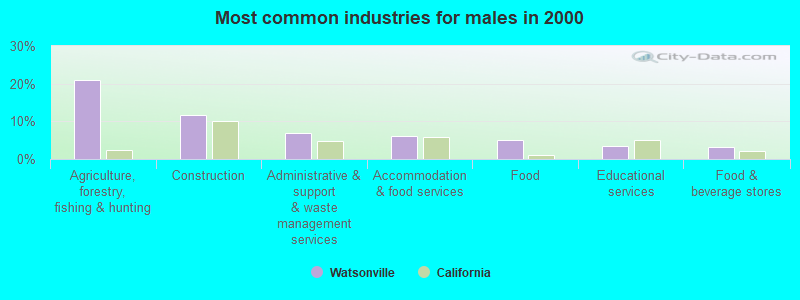
- Agriculture, forestry, fishing & hunting (21.0%)
- Construction (11.6%)
- Administrative & support & waste management services (6.8%)
- Accommodation & food services (6.2%)
- Food (5.1%)
- Educational services (3.5%)
- Food & beverage stores (3.2%)
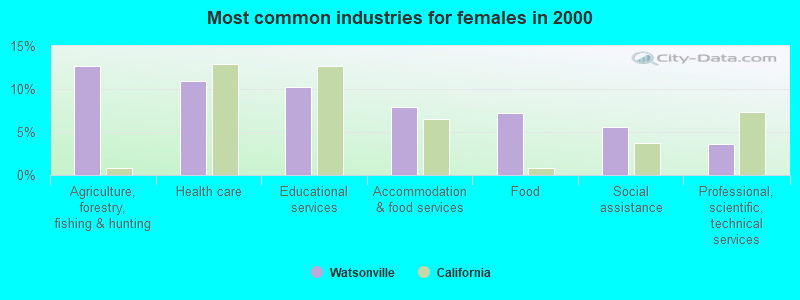
- Agriculture, forestry, fishing & hunting (12.7%)
- Health care (10.9%)
- Educational services (10.3%)
- Accommodation & food services (7.9%)
- Food (7.3%)
- Social assistance (5.6%)
- Professional, scientific, technical services (3.6%)
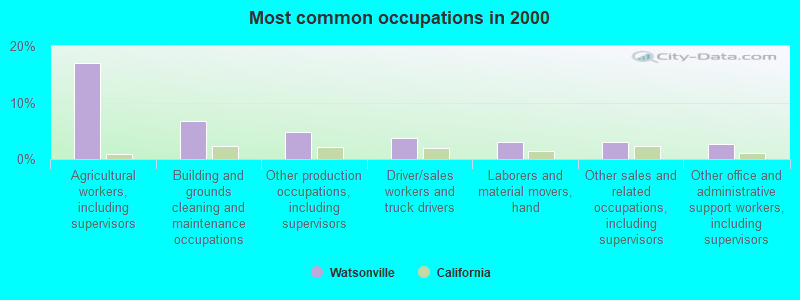
- Agricultural workers, including supervisors (17.0%)
- Building and grounds cleaning and maintenance occupations (6.8%)
- Other production occupations, including supervisors (4.8%)
- Driver/sales workers and truck drivers (3.7%)
- Laborers and material movers, hand (3.1%)
- Other sales and related occupations, including supervisors (3.0%)
- Other office and administrative support workers, including supervisors (2.7%)
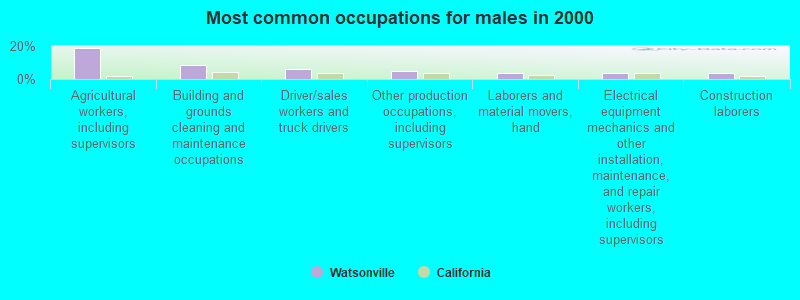
- Agricultural workers, including supervisors (18.6%)
- Building and grounds cleaning and maintenance occupations (8.6%)
- Driver/sales workers and truck drivers (6.2%)
- Other production occupations, including supervisors (4.6%)
- Laborers and material movers, hand (3.8%)
- Electrical equipment mechanics and other installation, maintenance, and repair workers, including supervisors (3.7%)
- Construction laborers (3.3%)
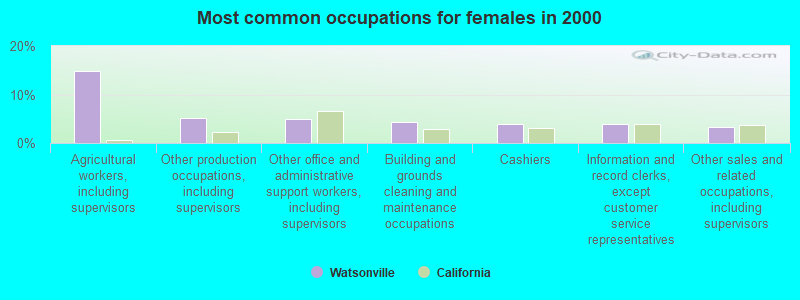
- Agricultural workers, including supervisors (14.8%)
- Other production occupations, including supervisors (5.1%)
- Other office and administrative support workers, including supervisors (4.9%)
- Building and grounds cleaning and maintenance occupations (4.4%)
- Cashiers (3.9%)
- Information and record clerks, except customer service representatives (3.9%)
- Other sales and related occupations, including supervisors (3.3%)
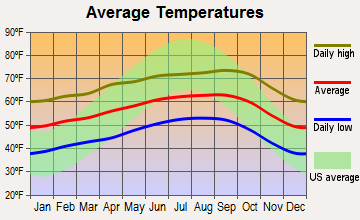
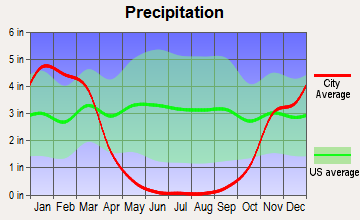
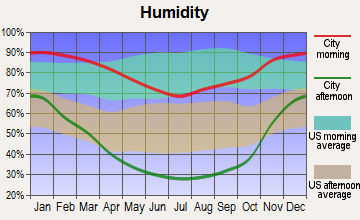
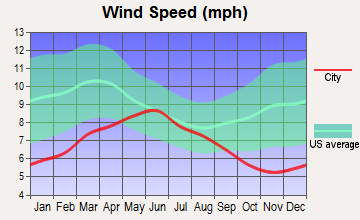
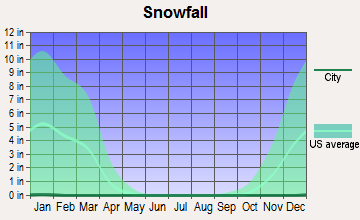
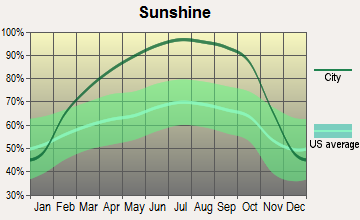
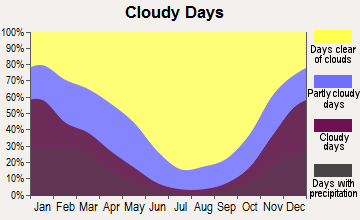
Average climate in Watsonville, California
Based on data reported by over 4,000 weather stations
|
|

(lower is better)
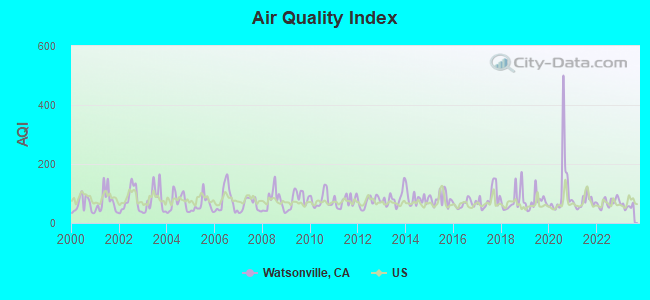
Air Quality Index (AQI) level in 2023 was 57.3. This is better than average.
| City: | 57.3 |
| U.S.: | 72.6 |
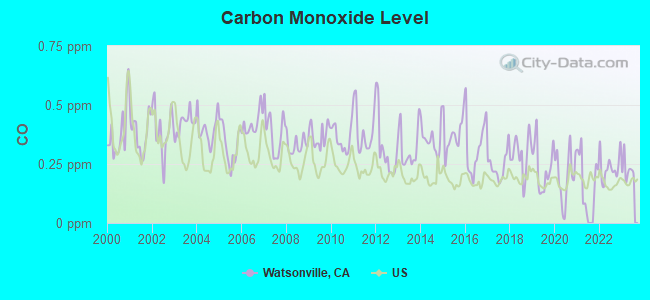
Carbon Monoxide (CO) [ppm] level in 2023 was 0.228. This is about average. Closest monitor was 11.8 miles away from the city center.
| City: | 0.228 |
| U.S.: | 0.251 |
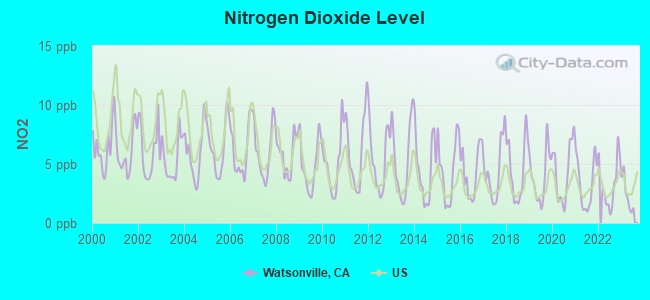
Nitrogen Dioxide (NO2) [ppb] level in 2023 was 2.40. This is significantly better than average. Closest monitor was 10.2 miles away from the city center.
| City: | 2.40 |
| U.S.: | 5.11 |
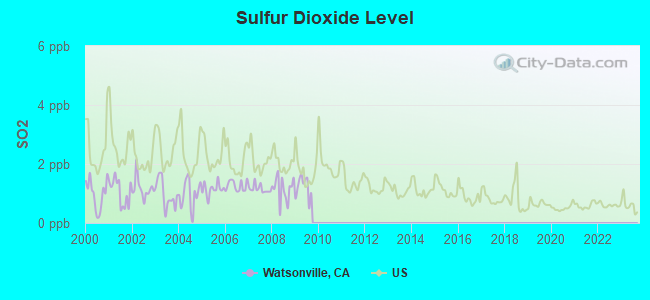
Sulfur Dioxide (SO2) [ppb] level in 2009 was 1.22. This is better than average. Closest monitor was 17.0 miles away from the city center.
| City: | 1.22 |
| U.S.: | 1.51 |
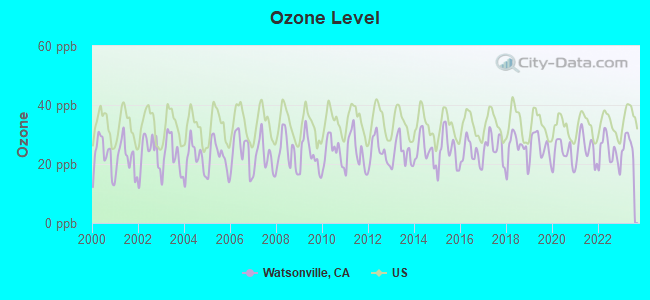
Ozone [ppb] level in 2023 was 26.7. This is better than average. Closest monitor was 2.0 miles away from the city center.
| City: | 26.7 |
| U.S.: | 33.3 |
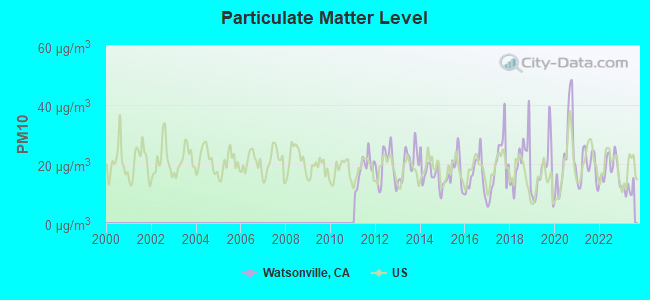
Particulate Matter (PM10) [µg/m3] level in 2023 was 11.7. This is significantly better than average. Closest monitor was 2.0 miles away from the city center.
| City: | 11.7 |
| U.S.: | 19.2 |
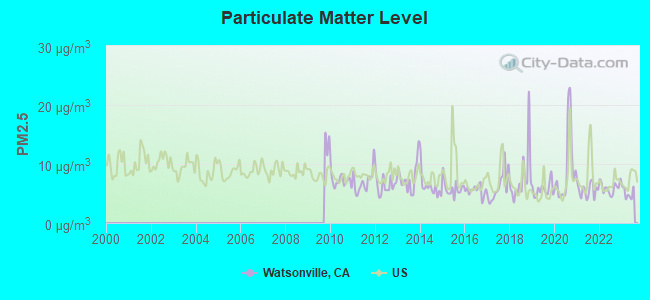
Particulate Matter (PM2.5) [µg/m3] level in 2023 was 5.08. This is significantly better than average. Closest monitor was 11.8 miles away from the city center.
| City: | 5.08 |
| U.S.: | 8.11 |
Earthquake activity:
Watsonville-area historical earthquake activity is significantly above California state average. It is 7631% greater than the overall U.S. average.On 4/18/1906 at 13:12:21, a magnitude 7.9 (7.9 UK, Class: Major, Intensity: VIII - XII) earthquake occurred 100.9 miles away from Watsonville center, causing $524,000,000 total damage
On 10/18/1989 at 00:04:15, a magnitude 7.1 (6.5 MB, 7.1 MS, 6.9 MW, 7.0 ML) earthquake occurred 13.1 miles away from the city center, causing 62 deaths (62 shaking deaths) and 3757 injuries, causing $1,305,032,704 total damage
On 11/4/1927 at 13:51:53, a magnitude 7.5 (7.5 UK) earthquake occurred 144.6 miles away from the city center
On 7/21/1952 at 11:52:14, a magnitude 7.7 (7.7 UK) earthquake occurred 203.9 miles away from Watsonville center, causing $50,000,000 total damage
On 5/2/1983 at 23:42:37, a magnitude 6.7 (6.2 MB, 6.5 MS, 6.5 MW, 6.7 ML, Class: Strong, Intensity: VII - IX) earthquake occurred 94.5 miles away from the city center, causing $31,000,000 total damage
On 12/21/1932 at 06:10:09, a magnitude 7.2 (7.2 UK) earthquake occurred 229.4 miles away from the city center
Magnitude types: body-wave magnitude (MB), local magnitude (ML), surface-wave magnitude (MS), moment magnitude (MW)
Natural disasters:
The number of natural disasters in Santa Cruz County (27) is a lot greater than the US average (15).Major Disasters (Presidential) Declared: 14
Emergencies Declared: 3
Causes of natural disasters: Floods: 13, Fires: 8, Mudslides: 7, Storms: 7, Winter Storms: 6, Landslides: 4, Drought: 1, Earthquake: 1, Freeze: 1, Hurricane: 1, Tornado: 1, Tsunami Wave: 1, Other: 1 (Note: some incidents may be assigned to more than one category).
Main business address for: WEST MARINE INC (RETAIL-AUTO DEALERS & GASOLINE STATIONS), GRANITE CONSTRUCTION INC (HEAVY CONSTRUCTION OTHER THAN BUILDING CONST - CONTRACTORS).
Hospitals and medical centers in Watsonville:
Airports and heliports located in Watsonville:
- Watsonville Municipal Airport (WVI) (Runways: 2, Itinerant Ops: 22,100, Local Ops: 42,900, Military Ops: 100)
- Alta Vista Heliport (CA65)
- Watsonville Community Hospital Heliport (CL99)
College/University in Watsonville:
Colleges/universities with over 2000 students nearest to Watsonville:
- Cabrillo College (about 11 miles; Aptos, CA; Full-time enrollment: 7,729)
- Gavilan College (about 12 miles; Gilroy, CA; FT enrollment: 3,327)
- University of California-Santa Cruz (about 18 miles; Santa Cruz, CA; FT enrollment: 17,751)
- Hartnell College (about 18 miles; Salinas, CA; FT enrollment: 5,506)
- California State University-Monterey Bay (about 19 miles; Seaside, CA; FT enrollment: 5,125)
- Naval Postgraduate School (about 24 miles; Monterey, CA; FT enrollment: 4,951)
- Monterey Peninsula College (about 24 miles; Monterey, CA; FT enrollment: 4,588)
Public high schools in Watsonville:
- WATSONVILLE HIGH (Students: 1,452, Location: 250 E. BEACH ST., Grades: 9-12)
- PAJARO VALLEY HIGH (Students: 1,087, Location: 500 HARKINS SLOUGH RD., Grades: 9-12)
- CEIBA COLLEGE PREPARATORY ACADEMY (Students: 136, Location: 260 W. RIVERSIDE DR., Grades: 6-12, Charter school)
- PACIFIC COAST CHARTER (Students: 115, Location: 294 GREEN VALLEY RD., Grades: KG-12, Charter school)
- ACADEMIC/VOCATIONAL CHARTER INSTITUTE (Students: 23, Location: 112 DIAMOND DR., Grades: 11-12, Charter school)
- NEW SCHOOL COMMUNITY DAY (Students: 13, Location: 165 HARKINS SLOUGH RD., Grades: 7-12)
Private high schools in Watsonville:
- MONTE VISTA CHRISTIAN SCHOOL (Students: 845, Location: 2 SCHOOL WAY, Grades: 6-12)
- GREEN VALLEY CHRISTIAN SCHOOL (Students: 290, Location: 376 S GREEN VALLEY RD, Grades: PK-12)
- ST FRANCIS CENTRAL COAST CATHOLIC HIGH SCHOOL (Students: 216, Location: 2400 E LAKE AVE, Grades: 9-12)
- MOUNT MADONNA SCHOOL (Students: 200, Location: 445 SUMMIT RD, Grades: PK-12)
- POTTER'S HOUSE COMMUNITY CHRISTIAN SCHOOL (Students: 7, Location: 113 E FRONT ST, Grades: 8-12)
Biggest public elementary/middle schools in Watsonville:
- E. A. HALL MIDDLE (Students: 558, Location: 201 BREWINGTON AVE., Grades: 6-8)
- CESAR E. CHAVEZ MIDDLE (Students: 530, Location: 440 ARTHUR RD., Grades: 6-8)
- PAJARO MIDDLE (Students: 396, Location: 250 SALINAS RD., Grades: 6-8)
- ALIANZA CHARTER (Students: 386, Location: 115 CASSERLY RD., Grades: KG-8, Charter school)
- AMESTI ELEMENTARY (Students: 370, Location: 25 AMESTI RD., Grades: KG-5)
- T. S. MACQUIDDY ELEMENTARY (Students: 365, Location: 330 MARTINELLI ST., Grades: KG-5)
- CALABASAS ELEMENTARY (Students: 361, Location: 202 CALABASAS RD., Grades: KG-6)
- ANN SOLDO ELEMENTARY (Students: 355, Location: 1140 MENASCO DR., Grades: KG-5)
- LANDMARK ELEMENTARY (Students: 354, Location: 235 OHLONE PKWY., Grades: KG-5)
- H. A. HYDE ELEMENTARY (Students: 350, Location: 125 ALTA VISTA ST., Grades: KG-5)
Private elementary/middle school in Watsonville:
User-submitted facts and corrections:
- Waynes Beauty College is no longer functional.
added by Jean Scollard
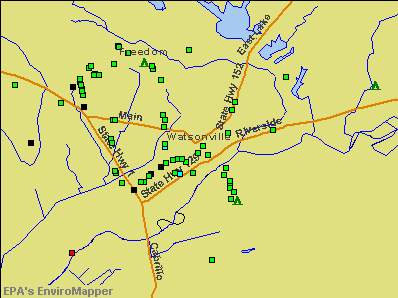
Points of interest:
Notable locations in Watsonville: William H Volck Museum Library (A), William H Volck Museum (B), Watsonville Public Library (C), Watsonville Chamber of Commerce (D), Santa Cruz County Court House Annex (E), Watsonville Auditorium (F), Veterans Memorial Building (G), Freedom Branch Santa Cruz City-County Library (H), Watsonville Fire Department Station 1 (I), American Medical Response Santa Cruz Division (J), Watsonville Fire Department Station 2 (K). Display/hide their locations on the map
Shopping Centers: East Lake Village Shopping Center (1), Crestview Shopping Center (2), Alta Vista Shopping Center (3), Watsonville Square Shopping Center (4), Town and Country Shopping Center (5). Display/hide their locations on the map
Main business address in Watsonville include: WEST MARINE INC (A), GRANITE CONSTRUCTION INC (B). Display/hide their locations on the map
Churches in Watsonville include: All Saints Episcopal Church (A), Bethel Tabernacle (B), Chapel Hill United Presbyterian Church (C), Church of Christ (D), Church of God (E), The Church of Jesus Christ of Latter Day Saints (F), Church of the Nazarene (G), First Baptist Church (H), First Christian Church (I). Display/hide their locations on the map
Cemeteries: Pioneer Cemetery (1), Independent Order of Oddfellows Cemetery (2). Display/hide their locations on the map
Reservoir: Pinto Lake (A). Display/hide its location on the map
Streams, rivers, and creeks: Struve Slough (A), Salsipuedes Creek (B). Display/hide their locations on the map
Parks in Watsonville include: Callaghan Park (1), Crestview Park (2), Flodberg Park (3), Pinto Lake City Park (4), Second Street Playground (5), Watsonville Plaza (6), Atri Park (7), Linear Park (8), Ramsay Park (9). Display/hide their locations on the map
Tourist attractions: Agricultural History Project Museum (2601 East Lake Avenue), Action Fun Jumps (Amusement & Theme Parks; 1459 Freedom Boulevard # B).
Hotels: Best Value Inn (781 Freedom Boulevard), Best Western Rose Garden Inn (740 Freedom Boulevard), Best Western Inn (740 Freedom Boulevard).
Birthplace of: Frank Post - Bicycle motocross rider, Charlene Pryer - Baseball player, John Sipin - Baseball player, Luis Alejo - Politician, Lee Tung Foo - Actor, Todd Souza - Busch series NASCAR driver (born: Dec 13, 1964), Francisco Gomez - Major League Soccer player (Chivas USA, born: Jan 25, 1979), Joel Fabiani - Film and television actor, Josh Taves - Football player, Ken Sears - Basketball player.
Drinking water stations with addresses in Watsonville and their reported violations in the past:
ELKHORN SLOUGH RESERVE WATER SYSTEM (Population served: 1,500, Groundwater):Past health violations:VAJRAYANA FOUNDATION (Population served: 200, Groundwater):Past monitoring violations:
- MCL, Monthly (TCR) - In AUG-2005, Contaminant: Coliform. Follow-up actions: St AO (w/o penalty) issued (SEP-21-2005), St Compliance achieved (SEP-21-2005)
- One routine major monitoring violation
- One minor monitoring violation
Past monitoring violations:KOINONIA CONFERENCE GROUNDS (Population served: 150, Groundwater):
- 2 routine major monitoring violations
Past monitoring violations:MT MADONNA INN RESTAURANT (Population served: 100, Groundwater):
- 11 routine major monitoring violations
Past monitoring violations:COAST GALLERY WS (Population served: 100, Surface water):
- 6 routine major monitoring violations
Past monitoring violations:SPRING HILLS GOLF COURSE (Population served: 55, Groundwater):
- Monitoring of Treatment (SWTR-Filter) - In SEP-01-2005. Follow-up actions: St Violation/Reminder Notice (OCT-19-2005), St Public Notif requested (OCT-19-2005)
- 4 routine major monitoring violations
- 2 minor monitoring violations
Past monitoring violations:APTOS RIDGE MUTUAL WATER CO (Population served: 50, Groundwater):
- Monitoring, Repeat Major (TCR) - In MAY-2005, Contaminant: Coliform (TCR). Follow-up actions: St Public Notif requested (JUN-16-2005), St Violation/Reminder Notice (JUN-16-2005)
- Monitoring, Repeat Major (TCR) - In MAY-2005, Contaminant: Coliform (TCR). Follow-up actions: St Public Notif requested (JUN-16-2005), St Violation/Reminder Notice (JUN-16-2005)
- 6 routine major monitoring violations
Past health violations:APTOS HILLS MUTUAL WATER CO (Population served: 38, Groundwater):Past monitoring violations:
- MCL, Monthly (TCR) - In AUG-2007, Contaminant: Coliform. Follow-up actions: St Violation/Reminder Notice (SEP-14-2007), St Public Notif requested (SEP-14-2007)
- MCL, Monthly (TCR) - In AUG-2007, Contaminant: Coliform. Follow-up actions: St Violation/Reminder Notice (SEP-14-2007), St Public Notif requested (SEP-14-2007)
- Monitoring, Repeat Major (TCR) - In APR-2012, Contaminant: Coliform (TCR). Follow-up actions: St Violation/Reminder Notice (MAY-18-2012), St Public Notif requested (MAY-18-2012)
Past health violations:Past monitoring violations:
- MCL, Monthly (TCR) - Between JAN-2009 and MAR-2009, Contaminant: Coliform. Follow-up actions: St Violation/Reminder Notice (APR-15-2009), St Public Notif requested (APR-15-2009)
- MCL, Monthly (TCR) - Between JAN-2009 and MAR-2009, Contaminant: Coliform. Follow-up actions: St Violation/Reminder Notice (APR-15-2009), St Public Notif requested (APR-15-2009)
- MCL, Monthly (TCR) - In NOV-2008, Contaminant: Coliform. Follow-up actions: St Violation/Reminder Notice (DEC-15-2008), St Public Notif requested (DEC-15-2008)
- MCL, Monthly (TCR) - In NOV-2008, Contaminant: Coliform. Follow-up actions: St Violation/Reminder Notice (DEC-15-2008), St Public Notif requested (DEC-15-2008)
- Monitoring, Repeat Major (TCR) - In MAR-2008, Contaminant: Coliform (TCR). Follow-up actions: St Violation/Reminder Notice (APR-10-2008), St Public Notif requested (APR-10-2008)
- Monitoring, Repeat Major (TCR) - In MAR-2008, Contaminant: Coliform (TCR). Follow-up actions: St Violation/Reminder Notice (APR-10-2008), St Public Notif requested (APR-10-2008)
- Monitoring, Repeat Major (TCR) - In SEP-2005, Contaminant: Coliform (TCR). Follow-up actions: St Public Notif requested (OCT-27-2005), St Compliance achieved (OCT-27-2005), St Violation/Reminder Notice (OCT-27-2005)
- Monitoring, Repeat Major (TCR) - In SEP-2005, Contaminant: Coliform (TCR). Follow-up actions: St Public Notif requested (OCT-27-2005), St Compliance achieved (OCT-27-2005), St Violation/Reminder Notice (OCT-27-2005)
- 4 routine major monitoring violations
| This city: | 3.8 people |
| California: | 2.9 people |
| This city: | 77.7% |
| Whole state: | 68.7% |
| This city: | 7.4% |
| Whole state: | 7.2% |
Likely homosexual households (counted as self-reported same-sex unmarried-partner households)
- Lesbian couples: 0.4% of all households
- Gay men: 0.4% of all households
People in group quarters in Watsonville in 2010:
- 201 people in nursing facilities/skilled-nursing facilities
- 164 people in other noninstitutional facilities
- 81 people in emergency and transitional shelters (with sleeping facilities) for people experiencing homelessness
- 35 people in workers' group living quarters and job corps centers
- 27 people in residential treatment centers for adults
- 15 people in group homes intended for adults
- 5 people in group homes for juveniles (non-correctional)
People in group quarters in Watsonville in 2000:
- 212 people in nursing homes
- 185 people in other noninstitutional group quarters
- 92 people in homes for the physically handicapped
- 22 people in homes or halfway houses for drug/alcohol abuse
- 20 people in religious group quarters
- 11 people in hospitals/wards and hospices for chronically ill
- 11 people in hospices or homes for chronically ill
- 7 people in homes for the mentally ill
- 4 people in other nonhousehold living situations
Banks with most branches in Watsonville (2011 data):
- Wells Fargo Bank, National Association: Watsonville Branch, Freedom Branch, Pajaro Valley Branch. Info updated 2011/04/05: Bank assets: $1,161,490.0 mil, Deposits: $905,653.0 mil, headquarters in Sioux Falls, SD, positive income, 6395 total offices, Holding Company: Wells Fargo & Company
- JPMorgan Chase Bank, National Association: 630 Main St Branch at 630 Main St, branch established on 1919/01/01. Info updated 2011/11/10: Bank assets: $1,811,678.0 mil, Deposits: $1,190,738.0 mil, headquarters in Columbus, OH, positive income, International Specialization, 5577 total offices, Holding Company: Jpmorgan Chase & Co.
- Union Bank, National Association: Watsonville Branch at 35 East Lake Avenue, branch established on 1925/01/01. Info updated 2011/09/01: Bank assets: $88,967.5 mil, Deposits: $65,286.4 mil, headquarters in San Francisco, CA, positive income, Commercial Lending Specialization, 403 total offices, Holding Company: Mitsubishi Ufj Financial Group, Inc.
- Comerica Bank: Watsonville Square Branch at 1998 Main Street, branch established on 1982/11/01. Info updated 2011/07/29: Bank assets: $60,970.5 mil, Deposits: $48,300.9 mil, headquarters in Dallas, TX, positive income, Commercial Lending Specialization, 497 total offices, Holding Company: Comerica Incorporated
- Citibank, National Association: 760 East Lake Avenue Branch at 760 East Lake Avenue, branch established on 1935/08/01. Info updated 2012/01/10: Bank assets: $1,288,658.0 mil, Deposits: $882,541.0 mil, headquarters in Sioux Falls, SD, positive income, International Specialization, 1048 total offices, Holding Company: Citigroup Inc.
- Santa Barbara Bank & Trust, National Association: Watsonville Branch at 655 Main Street, branch established on 1983/05/06. Info updated 2011/06/09: Bank assets: $5,847.9 mil, Deposits: $4,684.3 mil, headquarters in Santa Barbara, CA, positive income, Commercial Lending Specialization, 48 total offices, Holding Company: Sb Acquisition Company, Llc
- Santa Cruz County Bank: Watsonville Branch at 595 Auto Center Drive, branch established on 2005/02/01. Info updated 2008/10/28: Bank assets: $320.2 mil, Deposits: $288.2 mil, headquarters in Santa Cruz, CA, positive income, Commercial Lending Specialization, 5 total offices
- Bank of America, National Association: Watsonville Branch at 567 Main Street, branch established on 1923/12/24. Info updated 2009/11/18: Bank assets: $1,451,969.3 mil, Deposits: $1,077,176.8 mil, headquarters in Charlotte, NC, positive income, 5782 total offices, Holding Company: Bank Of America Corporation
- Rabobank, National Association: Watonsville Branch at 1915 Main Street, branch established on 2000/06/26. Info updated 2011/01/27: Bank assets: $11,745.0 mil, Deposits: $8,446.0 mil, headquarters in Roseville, CA, positive income, Agricultural Specialization, 124 total offices, Holding Company: Cooperatieve Centrale Raiffeisen-Boerenleenbank B.A., "rabobank Nederland
For population 15 years and over in Watsonville:
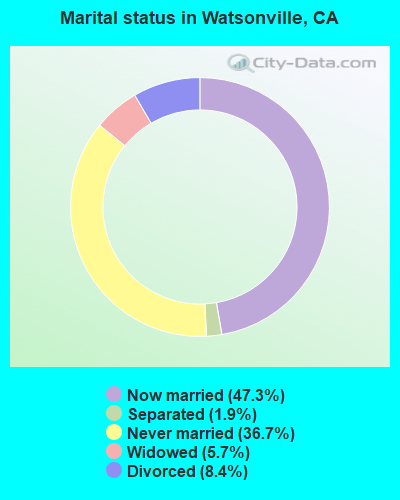
- Never married: 36.7%
- Now married: 47.3%
- Separated: 1.9%
- Widowed: 5.7%
- Divorced: 8.4%
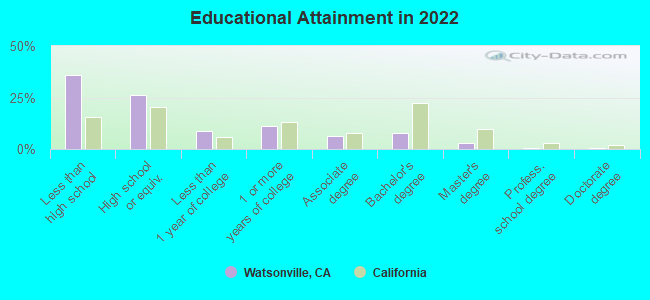
For population 25 years and over in Watsonville:
- High school or higher: 66.3%
- Bachelor's degree or higher: 11.7%
- Graduate or professional degree: 3.8%
- Unemployed: 12.4%
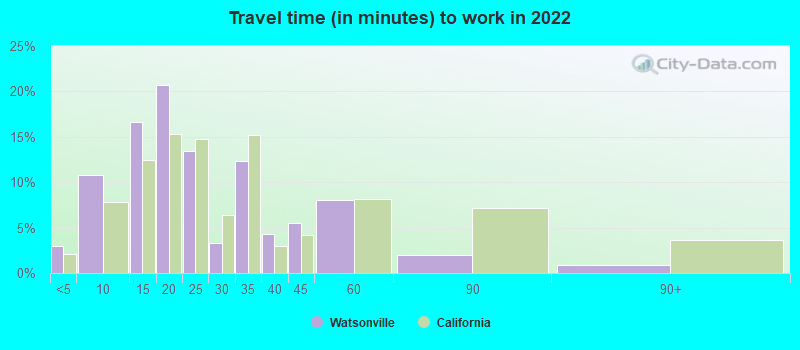
- Mean travel time to work (commute): 22.9 minutes
| Here: | 22.0 |
| California average: | 15.5 |
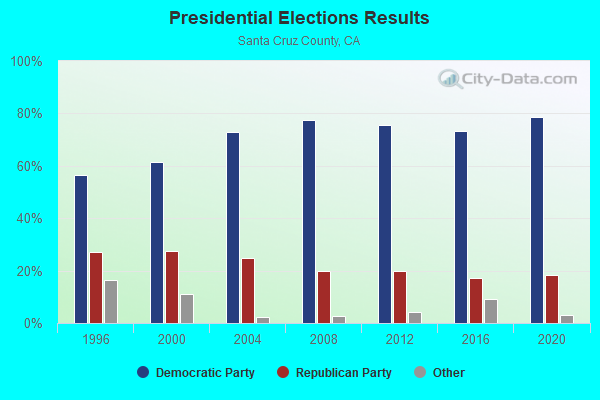
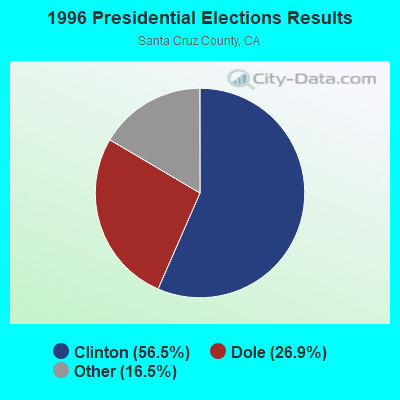
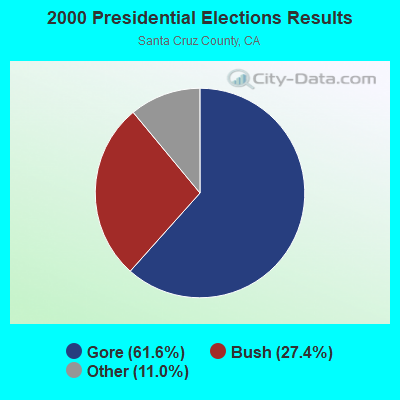
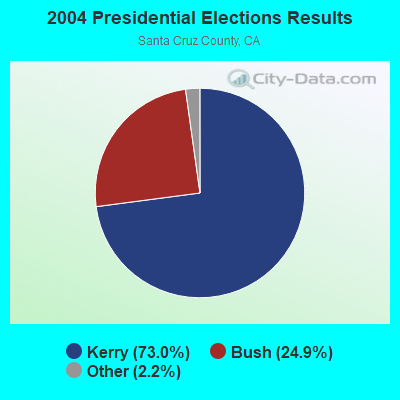
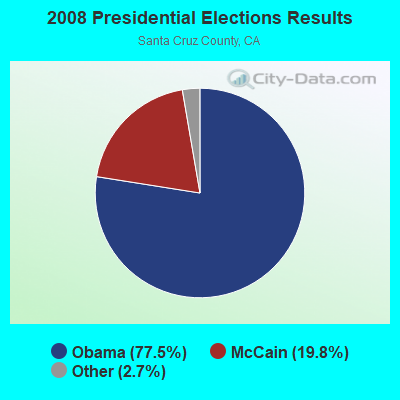
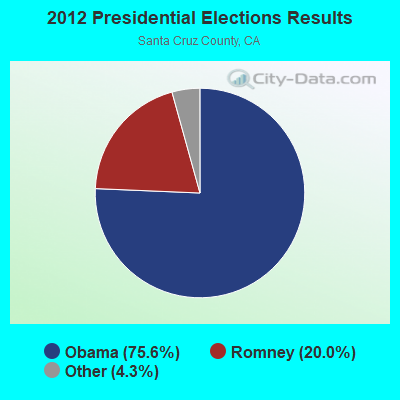
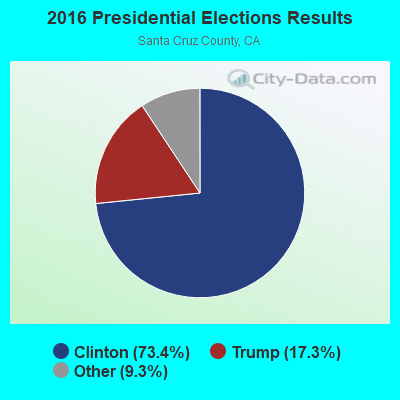
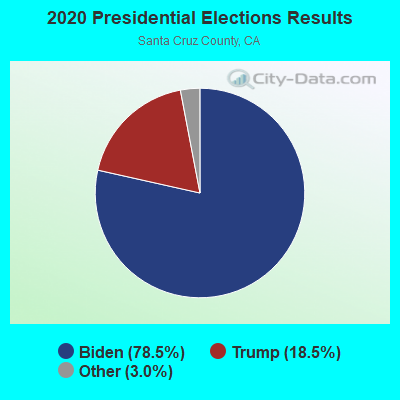
Graphs represent county-level data. Detailed 2008 Election Results
Religion statistics for Watsonville, CA (based on Santa Cruz County data)
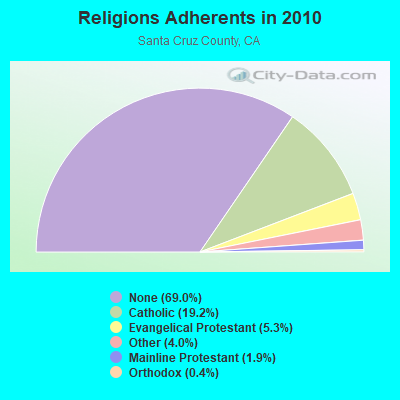
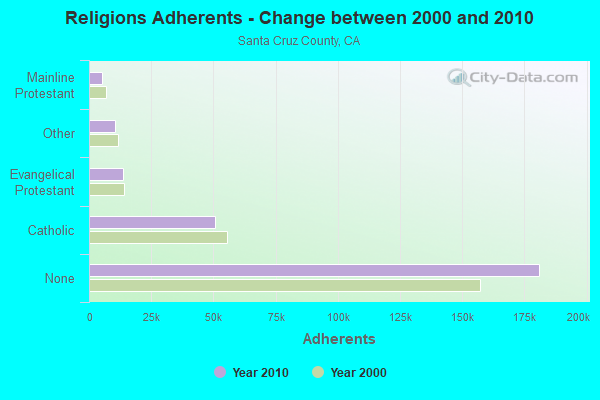
| Religion | Adherents | Congregations |
|---|---|---|
| Catholic | 50,500 | 13 |
| Evangelical Protestant | 13,838 | 84 |
| Other | 10,593 | 52 |
| Mainline Protestant | 5,049 | 28 |
| Orthodox | 1,104 | 4 |
| Black Protestant | 238 | 3 |
| None | 181,060 | - |
Food Environment Statistics:
| Santa Cruz County: | 2.55 / 10,000 pop. |
| State: | 2.14 / 10,000 pop. |
| Santa Cruz County: | 0.04 / 10,000 pop. |
| State: | 0.04 / 10,000 pop. |
| This county: | 0.64 / 10,000 pop. |
| California: | 0.62 / 10,000 pop. |
| Santa Cruz County: | 1.56 / 10,000 pop. |
| State: | 1.49 / 10,000 pop. |
| This county: | 9.81 / 10,000 pop. |
| California: | 7.42 / 10,000 pop. |
| Santa Cruz County: | 6.1% |
| State: | 7.3% |
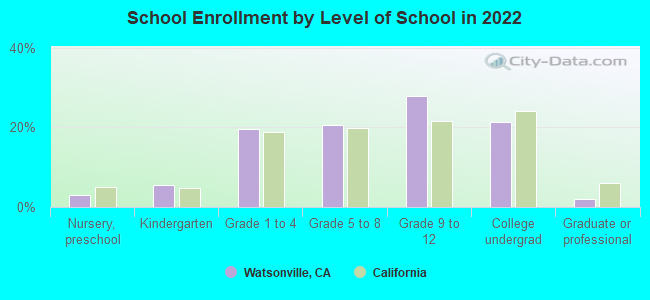
| Here: | 17.8% |
| California: | 21.3% |
| Here: | 19.2% |
| California: | 17.9% |
Health and Nutrition:
| This city: | 45.6% |
| California: | 49.4% |
| Here: | 46.1% |
| California: | 48.0% |
| Here: | 28.0 |
| California: | 28.1 |
| Here: | 24.7% |
| State: | 20.2% |
| Watsonville: | 9.5% |
| California: | 11.2% |
| Here: | 6.7 |
| State: | 6.8 |
| Watsonville: | 29.8% |
| California: | 31.5% |
| Watsonville: | 53.9% |
| California: | 56.4% |
| This city: | 81.3% |
| California: | 80.9% |
More about Health and Nutrition of Watsonville, CA Residents
| Local government employment and payroll (March 2022) | |||||
| Function | Full-time employees | Monthly full-time payroll | Average yearly full-time wage | Part-time employees | Monthly part-time payroll |
|---|---|---|---|---|---|
| Police Protection - Officers | 71 | $965,739 | $163,223 | 0 | $0 |
| Solid Waste Management | 49 | $275,891 | $67,565 | 5 | $11,623 |
| Water Supply | 43 | $272,158 | $75,951 | 1 | $3,330 |
| Firefighters | 35 | $490,801 | $168,275 | 0 | $0 |
| Streets and Highways | 32 | $261,377 | $98,016 | 2 | $4,559 |
| Sewerage | 29 | $205,745 | $85,136 | 0 | $0 |
| Local Libraries | 29 | $257,459 | $106,535 | 13 | $7,444 |
| Parks and Recreation | 24 | $154,836 | $77,418 | 49 | $63,681 |
| Housing and Community Development (Local) | 23 | $173,585 | $90,566 | 0 | $0 |
| Financial Administration | 22 | $191,777 | $104,606 | 0 | $0 |
| Other Government Administration | 22 | $133,865 | $73,017 | 3 | $992 |
| Police - Other | 16 | $101,361 | $76,021 | 2 | $3,102 |
| Other and Unallocable | 9 | $65,609 | $87,479 | 0 | $0 |
| Airports | 9 | $61,776 | $82,368 | 0 | $0 |
| Fire - Other | 2 | $14,180 | $85,080 | 0 | $0 |
| Totals for Government | 415 | $3,626,159 | $104,853 | 75 | $94,731 |
Watsonville government finances - Expenditure in 2017 (per resident):
- Construction - Regular Highways: $4,264,000 ($82.76)
Local Fire Protection: $361,000 ($7.01)
Libraries: $246,000 ($4.77)
Police Protection: $242,000 ($4.70)
- Current Operations - Police Protection: $18,826,000 ($365.38)
Water Utilities: $12,217,000 ($237.11)
Central Staff Services: $10,631,000 ($206.33)
Solid Waste Management: $10,368,000 ($201.22)
Sewerage: $9,011,000 ($174.89)
Local Fire Protection: $8,520,000 ($165.36)
Regular Highways: $4,255,000 ($82.58)
Parks and Recreation: $4,108,000 ($79.73)
Libraries: $3,933,000 ($76.33)
Air Transportation: $2,378,000 ($46.15)
Financial Administration: $2,335,000 ($45.32)
Housing and Community Development: $2,284,000 ($44.33)
General - Other: $1,501,000 ($29.13)
Protective Inspection and Regulation - Other: $886,000 ($17.20)
Health - Other: $515,000 ($10.00)
Parking Facilities: $214,000 ($4.15)
- General - Interest on Debt: $389,000 ($7.55)
- Intergovernmental to Local - Other - Natural Resources - Other: $2,173,000 ($42.17)
Other - General - Other: $1,221,000 ($23.70)
Other - Libraries: $542,000 ($10.52)
Other - Health - Other: $515,000 ($10.00)
Other - Parks and Recreation: $270,000 ($5.24)
- Other Capital Outlay - Libraries: $1,016,000 ($19.72)
Parks and Recreation: $88,000 ($1.71)
Central Staff Services: $60,000 ($1.16)
Health - Other: $48,000 ($0.93)
Watsonville government finances - Revenue in 2017 (per resident):
- Charges - Sewerage: $12,204,000 ($236.86)
Solid Waste Management: $11,225,000 ($217.86)
Other: $5,276,000 ($102.40)
Air Transportation: $2,591,000 ($50.29)
Parks and Recreation: $772,000 ($14.98)
Regular Highways: $188,000 ($3.65)
Parking Facilities: $78,000 ($1.51)
- Federal Intergovernmental - Housing and Community Development: $733,000 ($14.23)
Sewerage: $707,000 ($13.72)
Water Utilities: $601,000 ($11.66)
Other: $414,000 ($8.03)
- Local Intergovernmental - Other: $283,000 ($5.49)
- Miscellaneous - General Revenue - Other: $6,510,000 ($126.35)
Rents: $2,945,000 ($57.16)
Interest Earnings: $1,971,000 ($38.25)
Special Assessments: $952,000 ($18.48)
Fines and Forfeits: $13,000 ($0.25)
- Revenue - Water Utilities: $14,968,000 ($290.50)
- State Intergovernmental - Highways: $1,033,000 ($20.05)
Other: $850,000 ($16.50)
General Local Government Support: $30,000 ($0.58)
- Tax - Property: $21,932,000 ($425.66)
General Sales and Gross Receipts: $7,221,000 ($140.15)
Public Utilities Sales: $4,150,000 ($80.54)
Other Selective Sales: $1,268,000 ($24.61)
Occupation and Business License - Other: $520,000 ($10.09)
Other: $151,000 ($2.93)
Other License: $114,000 ($2.21)
Watsonville government finances - Debt in 2017 (per resident):
- Long Term Debt - Beginning Outstanding - Unspecified Public Purpose: $5,777,000 ($112.12)
Outstanding Unspecified Public Purpose: $4,912,000 ($95.33)
Retired Unspecified Public Purpose: $865,000 ($16.79)
Watsonville government finances - Cash and Securities in 2017 (per resident):
- Other Funds - Cash and Securities: $81,266,000 ($1577.21)
- Sinking Funds - Cash and Securities: $229,000 ($4.44)
| Businesses in Watsonville, CA | ||||
| Name | Count | Name | Count | |
|---|---|---|---|---|
| 7-Eleven | 3 | Lane Furniture | 1 | |
| AT&T | 1 | Little Caesars Pizza | 1 | |
| Ace Hardware | 1 | Long John Silver's | 1 | |
| Applebee's | 1 | McDonald's | 2 | |
| AutoZone | 1 | Motel 6 | 1 | |
| Baskin-Robbins | 1 | Nike | 3 | |
| Best Western | 1 | Panda Express | 1 | |
| Burger King | 2 | Payless | 2 | |
| CVS | 2 | Quiznos | 1 | |
| Chevrolet | 1 | RadioShack | 1 | |
| Comfort Inn | 1 | Red Roof Inn | 1 | |
| Curves | 1 | Safeway | 1 | |
| Domino's Pizza | 1 | Staples | 1 | |
| FedEx | 7 | Starbucks | 2 | |
| Firestone Complete Auto Care | 1 | Subway | 2 | |
| Ford | 1 | T-Mobile | 1 | |
| GNC | 1 | Target | 1 | |
| Goodwill | 1 | True Value | 1 | |
| H&R Block | 1 | U-Haul | 1 | |
| Holiday Inn | 1 | UPS | 5 | |
| Home Depot | 1 | Verizon Wireless | 1 | |
| Jack In The Box | 1 | Vons | 1 | |
| Jones New York | 3 | Wendy's | 1 | |
| KFC | 1 | YMCA | 1 | |
| Kroger | 1 | |||
Strongest AM radio stations in Watsonville:
- KSCO (1080 AM; 10 kW; SANTA CRUZ, CA)
- KLOK (1170 AM; 50 kW; SAN JOSE, CA; Owner: ENTRAVISION HOLDINGS, LLC)
- KYAA (1200 AM; 25 kW; SOQUEL, CA; Owner: PEOPLE'S RADIO, INC.)
- KDBV (980 AM; 10 kW; SALINAS, CA; Owner: WOLFHOUSE RADIO GROUP, INC.)
- KSRK (540 AM; 10 kW; CARMEL VALLEY, CA; Owner: PEOPLE'S RADIO, INC.)
- KGO (810 AM; 50 kW; SAN FRANCISCO, CA; Owner: KGO-AM RADIO, INC.)
- KNBR (680 AM; 50 kW; SAN FRANCISCO, CA; Owner: KNBR LICO, INC.)
- KION (1460 AM; 10 kW; SALINAS, CA)
- KZSJ (1120 AM; 5 kW; SAN MARTIN, CA; Owner: BUSTOS MEDIA HOLDINGS, LLC)
- KTCT (1050 AM; 50 kW; SAN MATEO, CA; Owner: SUSQUEHANNA RADIO CORP.)
- KFAX (1100 AM; 50 kW; SAN FRANCISCO, CA; Owner: GOLDEN GATE BROADCASTING CO, INC.)
- KYCY (1550 AM; 50 kW; SAN FRANCISCO, CA; Owner: INFINITY BROADCASTING OPERATIONS, INC.)
- KTOM (1380 AM; 5 kW; SALINAS, CA; Owner: CLEAR CHANNEL BROADCASTING LICENSES, INC.)
Strongest FM radio stations in Watsonville:
- KSQL (99.1 FM; SANTA CRUZ, CA; Owner: TMS LICENSE CALIFORNIA, INC)
- KKUP (91.5 FM; CUPERTINO, CA; Owner: ASSURANCE SCIENCES FOUNDATION)
- KBRG (100.3 FM; SAN JOSE, CA; Owner: ENTRAVISION HOLDINGS, LLC)
- KDON-FM (102.5 FM; SALINAS, CA; Owner: CLEAR CHANNEL BROADCASTING LICENSES, INC.)
- K202DU (88.3 FM; SAN JUAN BAUTISTA, CA; Owner: CALVARY CHAPEL OF TWIN FALLS, INC.)
- KBAA (94.5 FM; GILROY, CA; Owner: INFINITY RADIO OPERATIONS INC.)
- KBTU (93.5 FM; HOLLISTER, CA; Owner: MAPLETON COMMUNICATIONS, L.L.C.)
- KLVM (89.7 FM; PRUNEDALE, CA; Owner: PRUNEDALE EDUCATIONAL ASSOCIATION)
- K265DG (100.9 FM; HOLLISTER, CA; Owner: CLEAR CHANNEL BROADCASTING LICENSES, INC.)
- K206BQ (89.1 FM; HOLLISTER, CA; Owner: PATAPHYSICAL BROADCASTING FOUNDATION, INC.)
- KHRI (90.7 FM; HOLLISTER, CA; Owner: EDUCATIONAL MEDIA FOUNDATION)
- K260AA (99.9 FM; CARMEL VALLEY, CA; Owner: ENTRAVISION HOLDINGS, LLC)
- KUSP (88.9 FM; SANTA CRUZ, CA; Owner: PATAPHYSICAL B/CING. FOUNDATION,INC.)
- KWAV (96.9 FM; MONTEREY, CA; Owner: BUCKLEY BROADCASTING OF MONTEREY)
- KTOM-FM (100.7 FM; SALINAS, CA; Owner: CLEAR CHANNEL BROADCASTING LICENSES, INC.)
- K291AE (106.1 FM; SEASIDE, CA; Owner: MAPELTON COMMUNICATIONS, LLC)
- KPIG (107.5 FM; FREEDOM, CA; Owner: MAPLETON COMMUNICATIONS, L.L.C.)
- KTEE (93.7 FM; FELTON, CA; Owner: MAPLETON COMMUNICATIONS, L.L.C.)
- K240CD (95.9 FM; SOQUEL, ETC., CA; Owner: CALVARY CHAPEL OF TWIN FALLS, INC.)
- KSQQ (96.1 FM; MORGAN HILL, CA; Owner: COYOTE COMMUNICATIONS, INC.)
TV broadcast stations around Watsonville:
- KNTV (Channel 11; SAN JOSE, CA; Owner: KNTV LICENSE, INC.)
- KKPX (Channel 65; SAN JOSE, CA; Owner: PAXSON SAN JOSE LICENSE, INC.)
- K21EV (Channel 21; SALINAS, CA; Owner: LIVING FAITH BROADCASTING)
- KSBW (Channel 8; SALINAS, CA; Owner: HEARST-ARGYLE STATIONS, INC.)
- KDJT-CA (Channel 33; SALINAS/MONTEREY,ETC, CA; Owner: ENTRAVISION HOLDINGS, LLC)
- KCBA (Channel 35; SALINAS, CA; Owner: SEAL ROCK BROADCASTERS, L.L.C.)
- KCAH (Channel 25; WATSONVILLE, CA; Owner: KTEH FOUNDATION)
- KMUV-LP (Channel 23; MONTEREY, CA; Owner: SAINTE PARTNERS II, L.P.)
- KSMS-TV (Channel 67; MONTEREY, CA; Owner: ENTRAVISION HOLDINGS, LLC)
- K29AB (Channel 29; MONTEREY, ETC., CA; Owner: KTVU PARTNERSHIP)
- National Bridge Inventory (NBI) Statistics
- 31Number of bridges
- 689ft / 210mTotal length
- 464,280Total average daily traffic
- 33,014Total average daily truck traffic
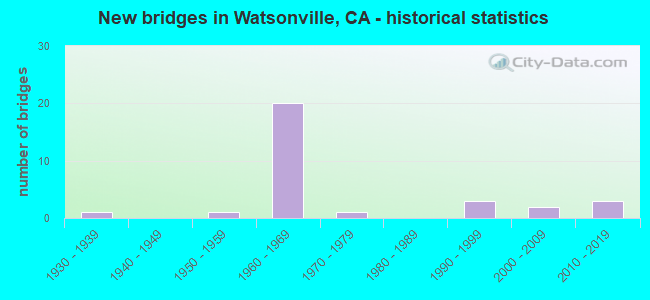
- New bridges - historical statistics
- 11930-1939
- 11950-1959
- 201960-1969
- 11970-1979
- 31990-1999
- 22000-2009
- 32010-2019
FCC Registered Antenna Towers: 141 (See the full list of FCC Registered Antenna Towers)
FCC Registered Commercial Land Mobile Towers: 2 (See the full list of FCC Registered Commercial Land Mobile Towers in Watsonville, CA)
FCC Registered Broadcast Land Mobile Towers: 52 (See the full list of FCC Registered Broadcast Land Mobile Towers)
FCC Registered Microwave Towers: 54 (See the full list of FCC Registered Microwave Towers in this town)
FCC Registered Maritime Coast & Aviation Ground Towers: 10 (See the full list of FCC Registered Maritime Coast & Aviation Ground Towers)
FCC Registered Amateur Radio Licenses: 232 (See the full list of FCC Registered Amateur Radio Licenses in Watsonville)
FAA Registered Aircraft Manufacturers and Dealers: 7 (See the full list of FAA Registered Manufacturers and Dealers in Watsonville)
FAA Registered Aircraft: 73 (See the full list of FAA Registered Aircraft)
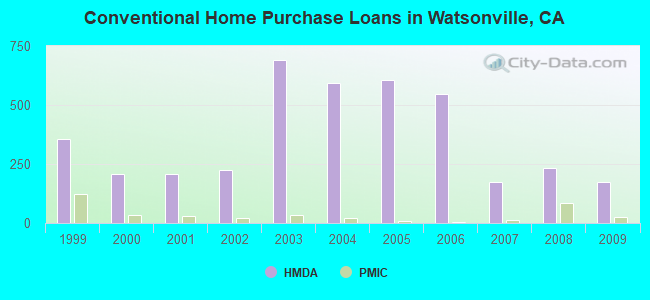
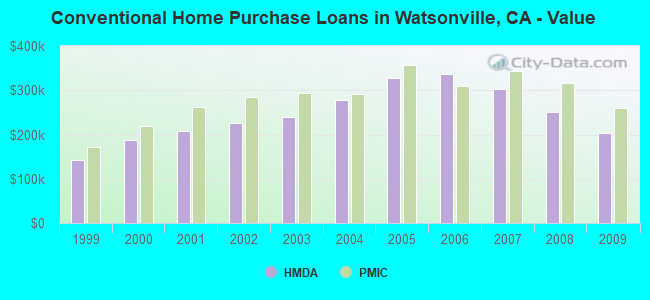
| Home Mortgage Disclosure Act Aggregated Statistics For Year 2009 (Based on 2 full and 7 partial tracts) | ||||||||||||||
| A) FHA, FSA/RHS & VA Home Purchase Loans | B) Conventional Home Purchase Loans | C) Refinancings | D) Home Improvement Loans | E) Loans on Dwellings For 5+ Families | F) Non-occupant Loans on < 5 Family Dwellings (A B C & D) | G) Loans On Manufactured Home Dwelling (A B C & D) | ||||||||
|---|---|---|---|---|---|---|---|---|---|---|---|---|---|---|
| Number | Average Value | Number | Average Value | Number | Average Value | Number | Average Value | Number | Average Value | Number | Average Value | Number | Average Value | |
| LOANS ORIGINATED | 153 | $256,894 | 173 | $203,582 | 205 | $236,251 | 8 | $177,221 | 2 | $960,850 | 90 | $196,193 | 10 | $118,376 |
| APPLICATIONS APPROVED, NOT ACCEPTED | 13 | $302,005 | 17 | $226,524 | 29 | $234,656 | 2 | $128,995 | 0 | $0 | 9 | $225,578 | 3 | $111,960 |
| APPLICATIONS DENIED | 30 | $259,143 | 51 | $184,239 | 121 | $272,436 | 9 | $125,776 | 0 | $0 | 26 | $217,369 | 16 | $100,682 |
| APPLICATIONS WITHDRAWN | 16 | $283,582 | 22 | $217,919 | 65 | $266,091 | 7 | $75,690 | 0 | $0 | 17 | $237,100 | 1 | $270,280 |
| FILES CLOSED FOR INCOMPLETENESS | 6 | $280,965 | 8 | $223,201 | 22 | $286,955 | 1 | $231,990 | 0 | $0 | 5 | $173,462 | 1 | $43,120 |
Detailed mortgage data for all 9 tracts in Watsonville, CA
| Private Mortgage Insurance Companies Aggregated Statistics For Year 2009 (Based on 2 full and 7 partial tracts) | ||||
| A) Conventional Home Purchase Loans | B) Refinancings | |||
|---|---|---|---|---|
| Number | Average Value | Number | Average Value | |
| LOANS ORIGINATED | 25 | $259,522 | 2 | $356,600 |
| APPLICATIONS APPROVED, NOT ACCEPTED | 10 | $232,703 | 1 | $258,850 |
| APPLICATIONS DENIED | 7 | $184,817 | 2 | $348,350 |
| APPLICATIONS WITHDRAWN | 2 | $197,725 | 0 | $0 |
| FILES CLOSED FOR INCOMPLETENESS | 1 | $234,430 | 0 | $0 |
2005 - 2018 National Fire Incident Reporting System (NFIRS) incidents
- Fire incident types reported to NFIRS in Watsonville, CA
- 37645.1%Structure Fires
- 24929.9%Outside Fires
- 13816.6%Mobile Property/Vehicle Fires
- 708.4%Other
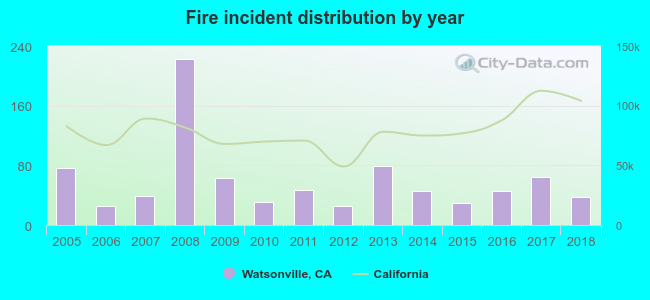 Based on the data from the years 2005 - 2018 the average number of fires per year is 59. The highest number of reported fires - 223 took place in 2008, and the least - 25 in 2012. The data has a declining trend.
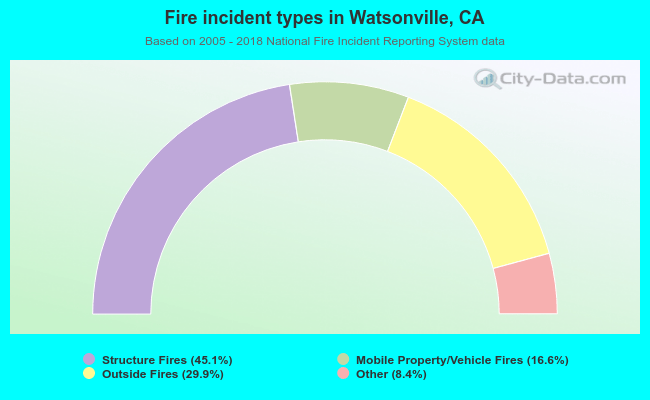 When looking into fire subcategories, the most incidents belonged to: Structure Fires (45.1%), and Outside Fires (29.9%).
Fire-safe hotels and motels in Watsonville, California:
- Best Western Rose Garden Inn, 740 Freedom Blvd, Watsonville, California 95076 , Phone: (831) 724-3367
- Watsonville Inn, 970 Main St, Watsonville, California 95076 , Phone: (831) 724-8881
- Comfort Inn Watsonville, 112 Airport Blvd, Watsonville, California 95019 , Phone: (831) 728-2300, Fax: (831) 728-3700
- Americas Best Value Inn, 781 Freedom Blvd, Watsonville, California 95076 , Phone: (831) 724-2181, Fax: (831) 768-8700
- Red Roof Inn, 1620 W Beach St, Watsonville, California 95076 , Phone: (831) 740-4520, Fax: (831) 740-4401
| Most common first names in Watsonville, CA among deceased individuals | ||
| Name | Count | Lived (average) |
|---|---|---|
| John | 322 | 75.4 years |
| Mary | 273 | 81.4 years |
| William | 244 | 75.9 years |
| Robert | 182 | 71.6 years |
| James | 171 | 75.3 years |
| George | 164 | 76.7 years |
| Frank | 159 | 75.9 years |
| Maria | 159 | 74.0 years |
| Charles | 124 | 74.8 years |
| Joseph | 112 | 76.5 years |
| Most common last names in Watsonville, CA among deceased individuals | ||
| Last name | Count | Lived (average) |
|---|---|---|
| Smith | 90 | 77.4 years |
| Garcia | 81 | 72.4 years |
| Martinez | 75 | 69.8 years |
| Rodriguez | 66 | 66.8 years |
| Johnson | 62 | 76.6 years |
| Hernandez | 53 | 67.5 years |
| Anderson | 52 | 80.0 years |
| Sanchez | 51 | 69.6 years |
| Miller | 43 | 79.9 years |
| Brown | 42 | 77.6 years |
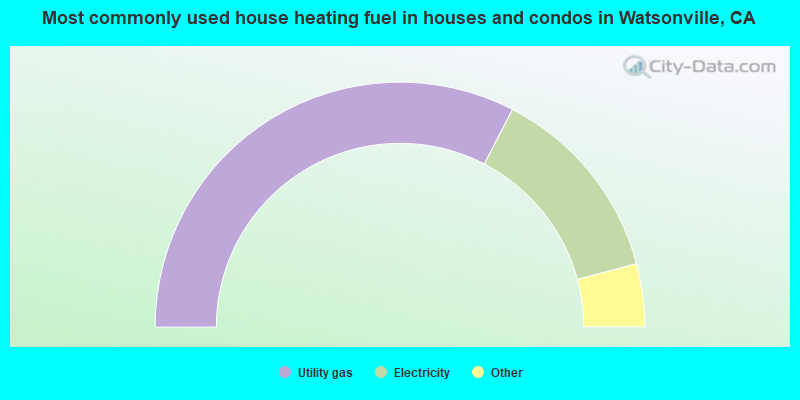
- 65.2%Utility gas
- 26.5%Electricity
- 3.4%Solar energy
- 1.7%No fuel used
- 1.4%Bottled, tank, or LP gas
- 1.0%Wood
- 0.8%Fuel oil, kerosene, etc.
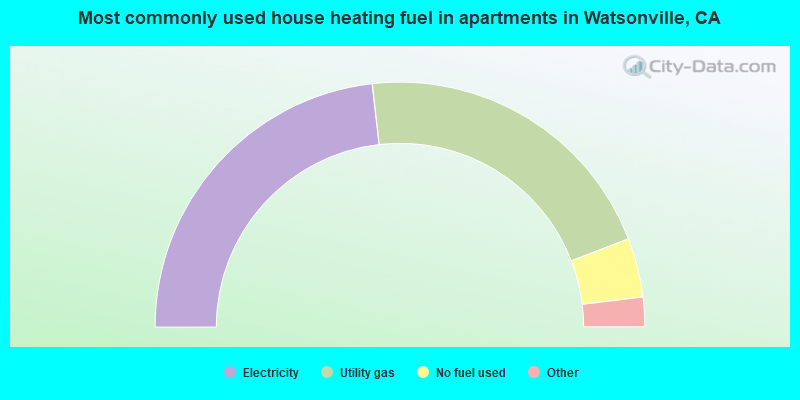
- 46.4%Electricity
- 41.9%Utility gas
- 7.8%No fuel used
- 2.5%Bottled, tank, or LP gas
- 1.2%Wood
- 0.3%Solar energy
Watsonville compared to California state average:
- Black race population percentage significantly below state average.
- Hispanic race population percentage above state average.
- Foreign-born population percentage above state average.
- Length of stay since moving in significantly above state average.
- Percentage of population with a bachelor's degree or higher below state average.
Watsonville on our top lists:
- #3 on the list of "Top 101 cities with largest percentage of females in occupations: farming, fishing, and forestry occupations (population 50,000+)"
- #4 on the list of "Top 101 cities with largest percentage of males in occupations: farming, fishing, and forestry occupations (population 50,000+)"
- #4 on the list of "Top 101 cities with largest percentage of males in industries: agriculture, forestry, fishing and hunting (population 50,000+)"
- #4 on the list of "Top 101 cities with largest percentage of females in industries: agriculture, forestry, fishing and hunting (population 50,000+)"
- #8 on the list of "Top 101 cities with largest percentage of females in occupations: personal care and service occupations (population 50,000+)"
- #12 on the list of "Top 100 least-educated cities (pop. 50,000+)"
- #13 on the list of "Top 101 cities with the most cars per house, population 50,000+"
- #15 on the list of "Top 101 cities with the smallest temperature differences during a year (population 50,000+)"
- #16 on the list of "Top 101 cities with the least people having Master's or Doctorate degrees (population 50,000+)"
- #18 on the list of "Top 101 cities with the largest sunshine amount differences during a year (population 50,000+)"
- #26 on the list of "Top 101 cities with largest percentage of males in occupations: fire fighting and prevention workers including supervisors (population 50,000+)"
- #32 on the list of "Top 101 cities with largest percentage of females in occupations: material moving occupations (population 50,000+)"
- #32 on the list of "Top 101 cities with the lowest percentage of English-only speaking households, population 50,000+"
- #41 on the list of "Top 101 cities with the highest number of days clear of clouds (population 50,000+)"
- #41 on the list of "Top 101 cities with the lowest number of days clear of clouds (population 50,000+)"
- #44 on the list of "Top 100 cities with highest percentage of foreign-born residents (pop. 50,000+)"
- #49 on the list of "Top 101 cities with the highest average sunshine amount (population 50,000+)"
- #58 on the list of "Top 101 cities with the largest humidity differences during a year (population 50,000+)"
- #59 on the list of "Top 101 cities with the largest differences between morning and afternoon humidity (population 50,000+)"
- #60 on the list of "Top 101 cities with the least people having Doctorate degrees (population 50,000+)"
- #2 on the list of "Top 101 counties with the lowest number of infant deaths per 1000 residents 2007-2013 (pop. 50,000+)"
- #6 on the list of "Top 101 counties with the largest decrease in the number of infant deaths per 1000 residents 2000-2006 to 2007-2013 (pop. 50,000+)"
- #9 on the list of "Top 101 counties with highest percentage of residents voting for 3rd party candidates in the 2012 Presidential Election (pop. 50,000+)"
- #24 on the list of "Top 101 counties with the lowest Ozone (1-hour) air pollution readings in 2012 (ppm)"
- #27 on the list of "Top 101 counties with highest percentage of residents voting for Obama (Democrat) in the 2012 Presidential Election (pop. 50,000+)"

|
|
Total of 408 patent applications in 2008-2024.