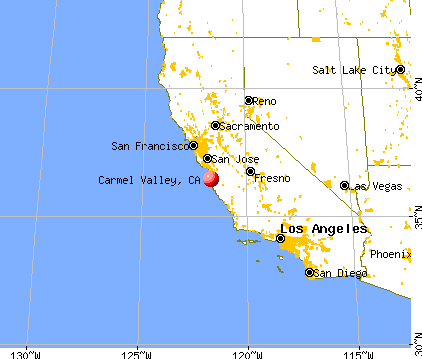
Carmel Valley, California
Submit your own pictures of this place and show them to the world
- OSM Map
- General Map
- Google Map
- MSN Map

| Males: 3,072 | |
| Females: 3,194 |
| Median resident age: | 46.1 years |
| California median age: | 33.3 years |
Zip code: 93924
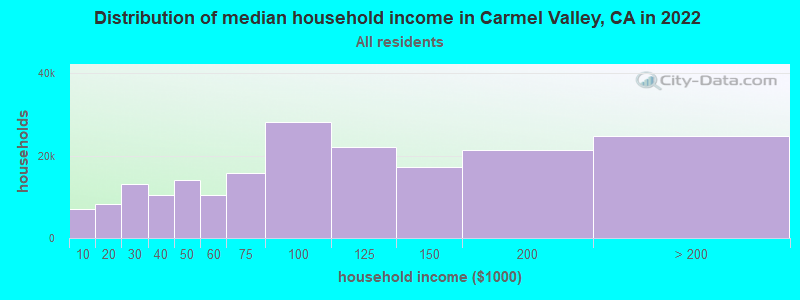
| Carmel Valley: | $135,138 |
| CA: | $91,551 |
Estimated per capita income in 2022: $79,625 (it was $43,385 in 2000)
Carmel Valley CCD income, earnings, and wages data
Estimated median house or condo value in 2022: over $1,000,000 (it was $475,600 in 2000)
| Carmel Valley: | over $1,000,000 |
| CA: | $715,900 |
Mean prices in 2022: all housing units: $955,620; detached houses: over $1,000,000; townhouses or other attached units: $741,452; in 2-unit structures: $782,213; in 3-to-4-unit structures: $910,101; in 5-or-more-unit structures: $502,903; mobile homes: $231,372; occupied boats, rvs, vans, etc.: $667,482
Detailed information about poverty and poor residents in Carmel Valley, CA


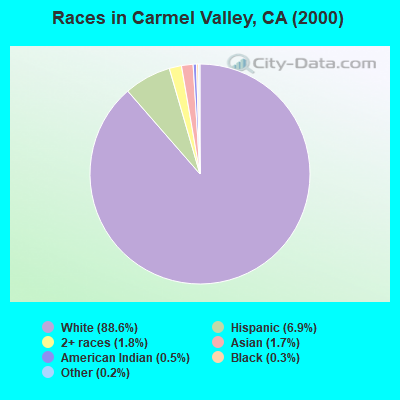
- 5,56788.6%White alone
- 4326.9%Hispanic
- 1131.8%Two or more races
- 1051.7%Asian alone
- 290.5%American Indian alone
- 180.3%Black alone
- 120.2%Other race alone
- 50.08%Native Hawaiian and Other
Pacific Islander alone
According to our research of California and other state lists, there was 1 registered sex offender living in Carmel Valley, California as of May 08, 2024.
The ratio of all residents to sex offenders in Carmel Valley is 6,266 to 1.
The ratio of registered sex offenders to all residents in this city is much lower than the state average.
 Recent articles from our blog. Our writers, many of them Ph.D. graduates or candidates, create easy-to-read articles on a wide variety of topics.
Current Local Time: PST time zone
Elevation: 400 feet
Land area: 189.3 square miles.
Population density: 33 people per square mile (very low).
| Carmel Valley CCD: | 0.5% ($2,188) |
| California: | 0.8% ($1,564) |
Nearest city with pop. 50,000+: Salinas, CA  (16.4 miles , pop. 151,060).
Nearest city with pop. 200,000+: San Jose, CA (59.8 miles , pop. 894,943).
Nearest city with pop. 1,000,000+: Los Angeles, CA (248.8 miles , pop. 3,694,820).
Nearest cities:
), ), ), ), Latitude: 36.45 N, Longitude: 121.70 W
Area code: 831

Carmel Valley tourist attractions:
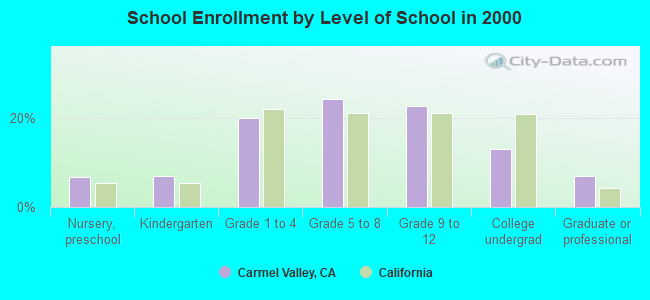
| Here: | 8.6% |
| California: | 5.1% |
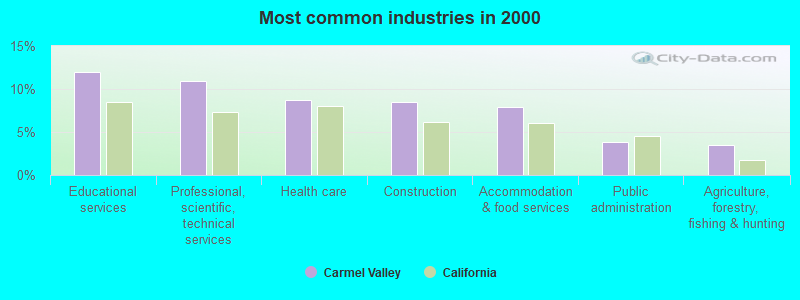
- Educational services (12.0%)
- Professional, scientific, technical services (10.9%)
- Health care (8.7%)
- Construction (8.5%)
- Accommodation & food services (7.9%)
- Public administration (3.8%)
- Agriculture, forestry, fishing & hunting (3.5%)
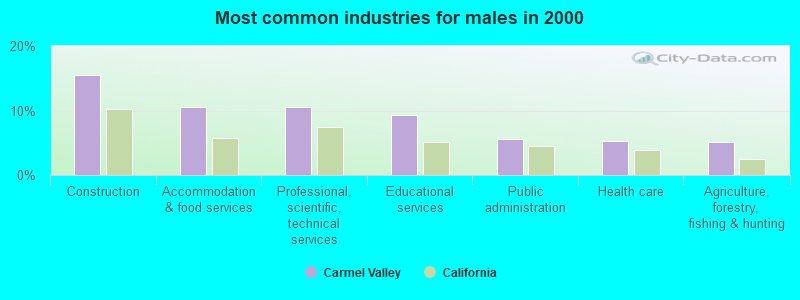
- Construction (15.5%)
- Accommodation & food services (10.6%)
- Professional, scientific, technical services (10.5%)
- Educational services (9.4%)
- Public administration (5.6%)
- Health care (5.3%)
- Agriculture, forestry, fishing & hunting (5.2%)
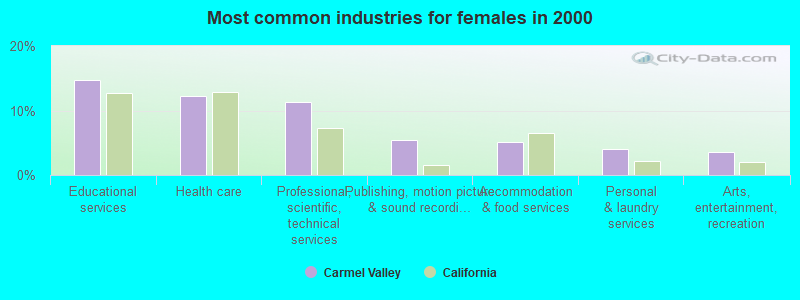
- Educational services (14.7%)
- Health care (12.3%)
- Professional, scientific, technical services (11.3%)
- Publishing, motion picture & sound recording industries (5.4%)
- Accommodation & food services (5.1%)
- Personal & laundry services (4.0%)
- Arts, entertainment, recreation (3.6%)
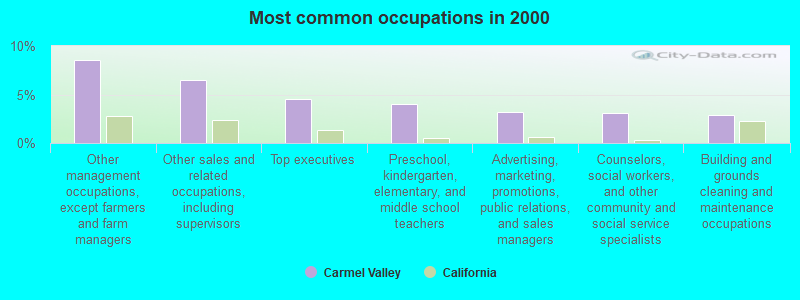
- Other management occupations, except farmers and farm managers (8.5%)
- Other sales and related occupations, including supervisors (6.5%)
- Top executives (4.5%)
- Preschool, kindergarten, elementary, and middle school teachers (4.0%)
- Advertising, marketing, promotions, public relations, and sales managers (3.2%)
- Counselors, social workers, and other community and social service specialists (3.1%)
- Building and grounds cleaning and maintenance occupations (2.9%)
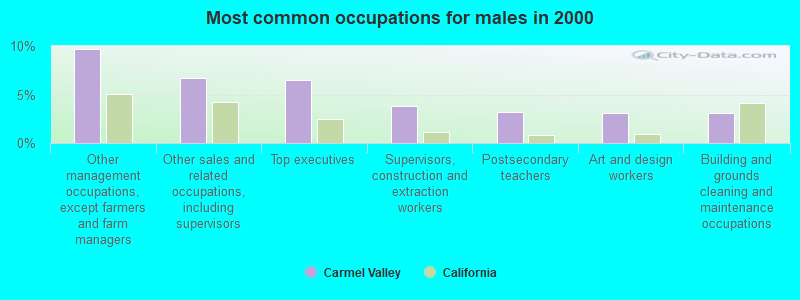
- Other management occupations, except farmers and farm managers (9.7%)
- Other sales and related occupations, including supervisors (6.7%)
- Top executives (6.5%)
- Supervisors, construction and extraction workers (3.8%)
- Postsecondary teachers (3.2%)
- Art and design workers (3.1%)
- Building and grounds cleaning and maintenance occupations (3.1%)
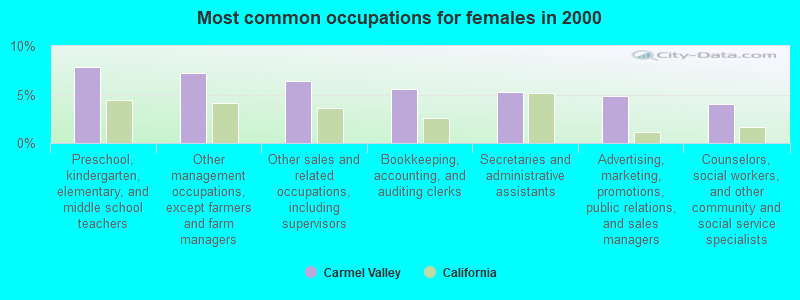
- Preschool, kindergarten, elementary, and middle school teachers (7.8%)
- Other management occupations, except farmers and farm managers (7.2%)
- Other sales and related occupations, including supervisors (6.4%)
- Bookkeeping, accounting, and auditing clerks (5.5%)
- Secretaries and administrative assistants (5.2%)
- Advertising, marketing, promotions, public relations, and sales managers (4.8%)
- Counselors, social workers, and other community and social service specialists (4.0%)
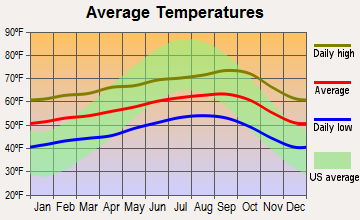
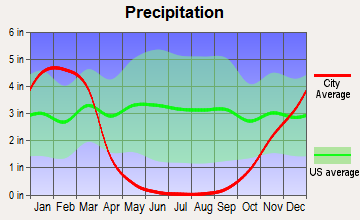
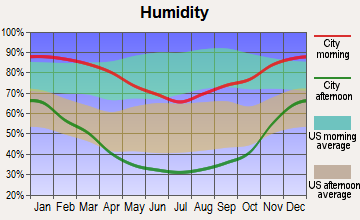
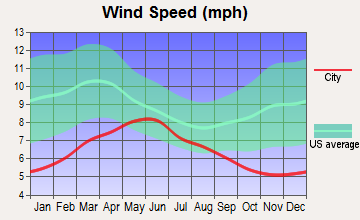
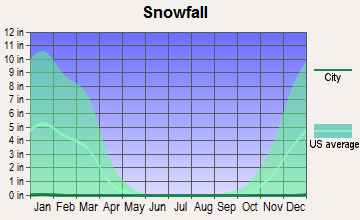
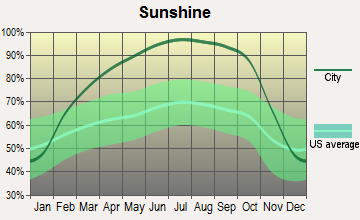
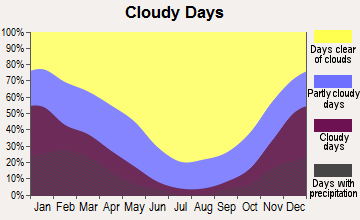
Average climate in Carmel Valley, California
Based on data reported by over 4,000 weather stations
|
|

(lower is better)
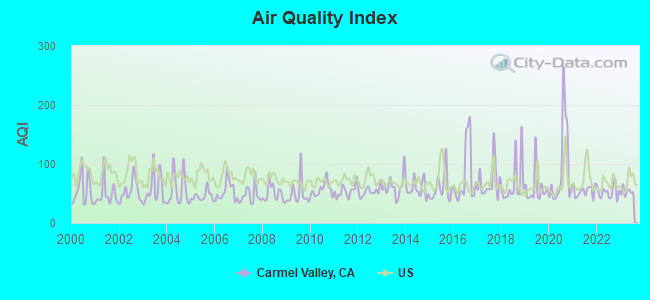
Air Quality Index (AQI) level in 2023 was 53.0. This is better than average.
| City: | 53.0 |
| U.S.: | 72.6 |
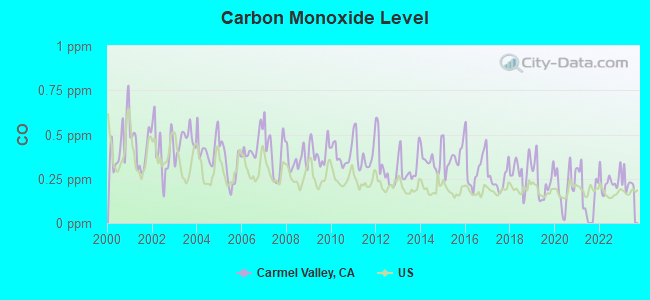
Carbon Monoxide (CO) [ppm] level in 2023 was 0.228. This is about average. Closest monitor was 15.2 miles away from the city center.
| City: | 0.228 |
| U.S.: | 0.251 |
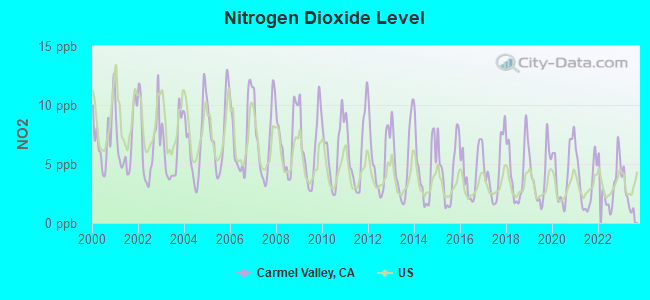
Nitrogen Dioxide (NO2) [ppb] level in 2023 was 2.40. This is significantly better than average. Closest monitor was 15.2 miles away from the city center.
| City: | 2.40 |
| U.S.: | 5.11 |
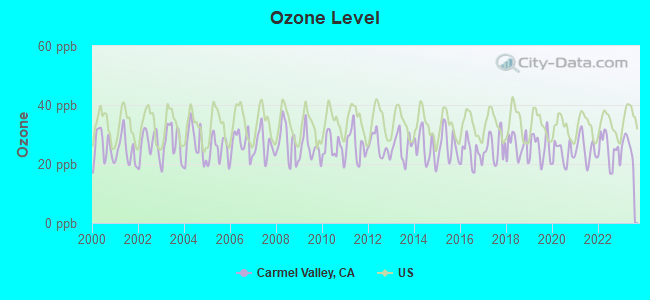
Ozone [ppb] level in 2023 was 26.1. This is better than average. Closest monitor was 3.0 miles away from the city center.
| City: | 26.1 |
| U.S.: | 33.3 |
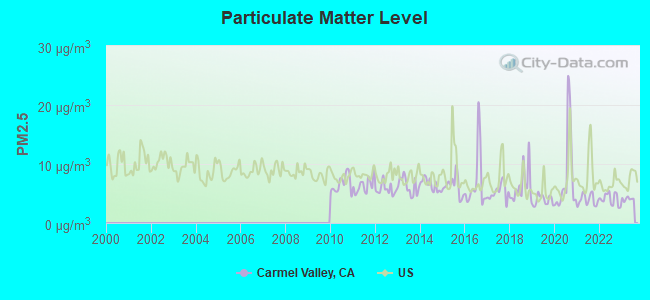
Particulate Matter (PM2.5) [µg/m3] level in 2023 was 4.09. This is significantly better than average. Closest monitor was 3.0 miles away from the city center.
| City: | 4.09 |
| U.S.: | 8.11 |
Earthquake activity:
Carmel Valley-area historical earthquake activity is significantly above California state average. It is 7412% greater than the overall U.S. average.On 4/18/1906 at 13:12:21, a magnitude 7.9 (7.9 UK, Class: Major, Intensity: VIII - XII) earthquake occurred 129.0 miles away from the city center, causing $524,000,000 total damage
On 11/4/1927 at 13:51:53, a magnitude 7.5 (7.5 UK) earthquake occurred 112.6 miles away from the city center
On 7/21/1952 at 11:52:14, a magnitude 7.7 (7.7 UK) earthquake occurred 181.7 miles away from the city center, causing $50,000,000 total damage
On 10/18/1989 at 00:04:15, a magnitude 7.1 (6.5 MB, 7.1 MS, 6.9 MW, 7.0 ML) earthquake occurred 45.8 miles away from Carmel Valley center, causing 62 deaths (62 shaking deaths) and 3757 injuries, causing $1,305,032,704 total damage
On 5/2/1983 at 23:42:37, a magnitude 6.7 (6.2 MB, 6.5 MS, 6.5 MW, 6.7 ML, Class: Strong, Intensity: VII - IX) earthquake occurred 79.3 miles away from Carmel Valley center, causing $31,000,000 total damage
On 12/22/2003 at 19:15:56, a magnitude 6.6 (6.1 MB, 6.4 MS, 6.6 MW, 6.4 MW) earthquake occurred 67.3 miles away from the city center, causing 2 deaths (2 shaking deaths) and 40 injuries, causing $200,000,000 total damage
Magnitude types: body-wave magnitude (MB), local magnitude (ML), surface-wave magnitude (MS), moment magnitude (MW)
Natural disasters:
The number of natural disasters in Monterey County (23) is greater than the US average (15).Major Disasters (Presidential) Declared: 14
Emergencies Declared: 3
Causes of natural disasters: Floods: 12, Winter Storms: 7, Storms: 6, Fires: 4, Landslides: 4, Mudslides: 4, Freezes: 2, Drought: 1, Earthquake: 1, Hurricane: 1, Tornado: 1, Tsunami Wave: 1, Other: 1 (Note: some incidents may be assigned to more than one category).
Hospitals and medical centers near Carmel Valley:
- CENTRAL COAST VNA AND HOSPICE, INC (Home Health Center, about 12 miles away; MONTEREY, CA)
- ADOBE HOME HEALTH CARE (Home Health Center, about 12 miles away; MONTEREY, CA)
- ALLIANCE HOME HEALTH, INC (Home Health Center, about 12 miles away; SALINAS, CA)
- CENTRAL COAST VNA AND HOSPICE INC (Hospital, about 13 miles away; SALINAS, CA)
- CHOICE HOME HEALTH CARE (Home Health Center, about 13 miles away; MONTEREY, CA)
- COUNTRY HOME CARE HOSPICE (Hospital, about 14 miles away; CARMEL, CA)
- MONTEREY PENINSULA DIALYSIS (Dialysis Facility, about 14 miles away; MONTEREY, CA)
Amtrak stations near Carmel Valley:
- 14 miles: CARMEL (3665 RIO RD.) - Bus Station . Services: fully wheelchair accessible, public restrooms, public payphones, snack bar, call for car rental service, call for taxi service, public transit connection.
- 15 miles: SEASIDE (BLDG. T-1176, 4TH ST.) - Bus Station . Services: fully wheelchair accessible, public payphones, free short-term parking, call for taxi service, public transit connection.
- 15 miles: MONTEREY TRANSIT PLAZA (MONTEREY, PEARL & TYLER STS.) - Bus Station . Services: fully wheelchair accessible, public payphones, paid short-term parking, paid long-term parking, taxi stand, public transit connection.
Colleges/universities with over 2000 students nearest to Carmel Valley:
- Naval Postgraduate School (about 15 miles; Monterey, CA; Full-time enrollment: 4,951)
- Monterey Peninsula College (about 15 miles; Monterey, CA; FT enrollment: 4,588)
- California State University-Monterey Bay (about 16 miles; Seaside, CA; FT enrollment: 5,125)
- Hartnell College (about 16 miles; Salinas, CA; FT enrollment: 5,506)
- Gavilan College (about 37 miles; Gilroy, CA; FT enrollment: 3,327)
- Cabrillo College (about 40 miles; Aptos, CA; FT enrollment: 7,729)
- University of California-Santa Cruz (about 44 miles; Santa Cruz, CA; FT enrollment: 17,751)
Public elementary/middle school in Carmel Valley:
- TULARCITOS ELEMENTARY (Students: 248, Location: 35 FORD RD., Grades: KG-5)
Points of interest:
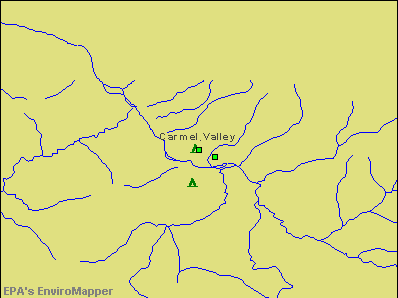
Notable locations in Carmel Valley: Hiding Canyon Camp (A), Holman Ranch (B), Little Pines Camp (C), Divide Camp (D), Pine Creek Camp (E), China Camp (F), Chews Ridge Ranger Station (G), Carmel River Guard Station (H), Camp Stephani (I), Nason Cabin (J), Bruce Ranch (K), J Gardiners Tennis Ranch (L), Carmel Valley Trail and Saddle Club (M), Princes Camp (N), San Carlos Ranch (O), Round Rock Camp (P), Sid Ormsbee Lookout (Q), Sulphur Springs Camp (R), Clover Basin Camp (S), The Caves (T). Display/hide their locations on the map
Shopping Center: Carmel Valley Shopping Center (1). Display/hide its location on the map
Churches in Carmel Valley include: Carmel Valley Community Chapel (A), Korean Buddhist Temple Sambosa (B), Saint Dunstans Church (C). Display/hide their locations on the map
Reservoir: White Rock Lake (A). Display/hide its location on the map
Streams, rivers, and creeks: Danish Creek (A), Church Creek (B), Las Gazas Creek (C), Bruce Fork (D), Blue Creek (E), Bear Basin Creek (F), Tularcitos Creek (G), Chupines Creek (H), Cachagua Creek (I). Display/hide their locations on the map
Hotels: Bernardus Lodge (415 Carmel Valley Road) (1), Acacia Lodge (20 Viaduct Contenta) (2), Blue Sky Lodge (10 Flight Road) (3). Display/hide their approximate locations on the map
Birthplace of: Chris Cope - Martial artist.
Drinking water stations with addresses in Carmel Valley and their reported violations in the past:
CACHAGUA MUTUAL WS (#4) (Population served: 55, Groundwater):Past monitoring violations:ASOLEADO MWC (Population served: 52, Groundwater):
- Monitoring, Repeat Major (TCR) - In APR-2011, Contaminant: Coliform (TCR). Follow-up actions: St Violation/Reminder Notice (MAY-26-2011), St Public Notif requested (MAY-26-2011)
- 10 routine major monitoring violations
- 2 minor monitoring violations
Past health violations:HELLER ESTATES WS (Population served: 25, Groundwater):Past monitoring violations:
- MCL, Monthly (TCR) - In AUG-2011, Contaminant: Coliform. Follow-up actions: St Violation/Reminder Notice (SEP-30-2011), St Public Notif requested (SEP-30-2011)
- MCL, Monthly (TCR) - In FEB-2008, Contaminant: Coliform. Follow-up actions: St Public Notif requested (MAR-17-2008), St Public Notif received (MAR-17-2008), St Violation/Reminder Notice (MAR-17-2008)
- MCL, Monthly (TCR) - In FEB-2008, Contaminant: Coliform
- MCL, Monthly (TCR) - In JAN-2007, Contaminant: Coliform. Follow-up actions: St Violation/Reminder Notice (JAN-26-2007), St Public Notif requested (JAN-26-2007)
- MCL, Monthly (TCR) - In JAN-2007, Contaminant: Coliform. Follow-up actions: St Violation/Reminder Notice (JAN-26-2007), St Public Notif requested (JAN-26-2007)
- MCL, Monthly (TCR) - In DEC-2006, Contaminant: Coliform. Follow-up actions: St Public Notif received (JAN-10-2007), St Public Notif requested (JAN-17-2007), St Violation/Reminder Notice (JAN-17-2007)
- 3 other older health violations
- 2 minor monitoring violations
Past health violations:
- MCL, Monthly (TCR) - In SEP-2010, Contaminant: Coliform. Follow-up actions: St Violation/Reminder Notice (OCT-25-2010)
Drinking water stations with addresses in Carmel Valley that have no violations reported:
- HOLMAN RANCH WS (Population served: 25, Primary Water Source Type: Surface water)
| This place: | 2.3 people |
| California: | 2.9 people |
| This place: | 64.6% |
| Whole state: | 68.7% |
| This place: | 6.8% |
| Whole state: | 7.2% |
Likely homosexual households (counted as self-reported same-sex unmarried-partner households)
- Lesbian couples: 0.8% of all households
- Gay men: 0.3% of all households
| This place: | 4.3% |
| Whole state: | 14.2% |
| This place: | 1.3% |
| Whole state: | 6.3% |
40 people in religious group quarters in 2000
8 people in other noninstitutional group quarters in 2000
For population 15 years and over in Carmel Valley:
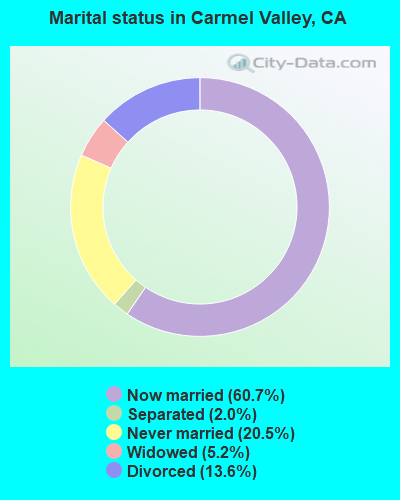
- Never married: 20.5%
- Now married: 60.7%
- Separated: 2.0%
- Widowed: 5.2%
- Divorced: 13.6%
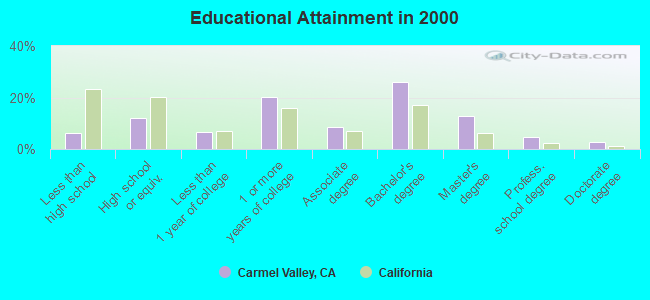
For population 25 years and over in Carmel Valley:
- High school or higher: 93.8%
- Bachelor's degree or higher: 46.5%
- Graduate or professional degree: 20.4%
- Unemployed: 2.7%
- Mean travel time to work (commute): 27.5 minutes
| Here: | 10.6 |
| California average: | 16.1 |
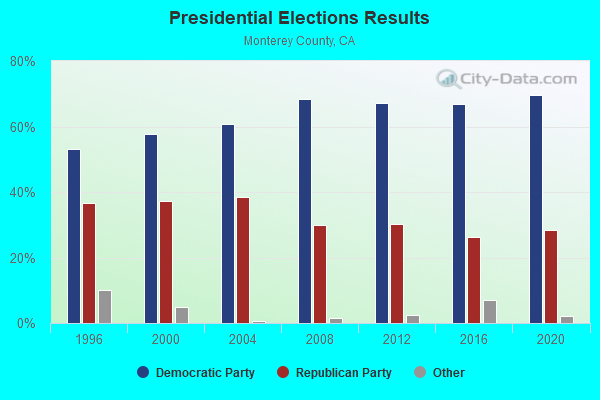
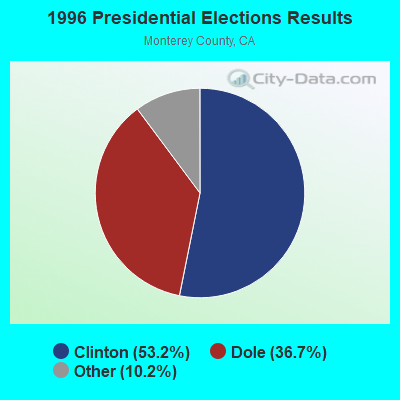
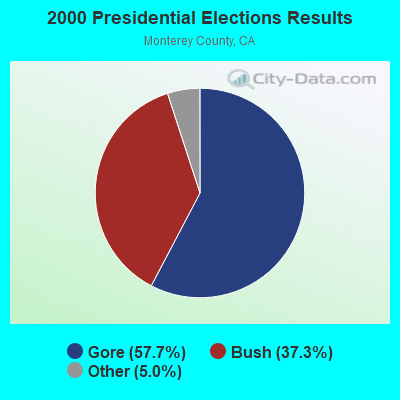
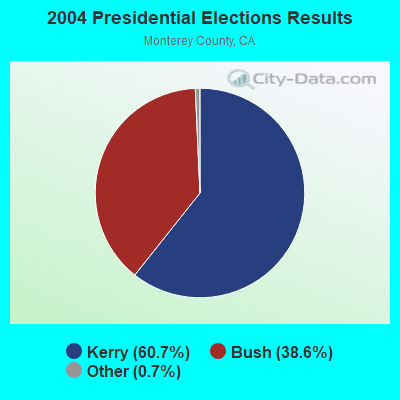
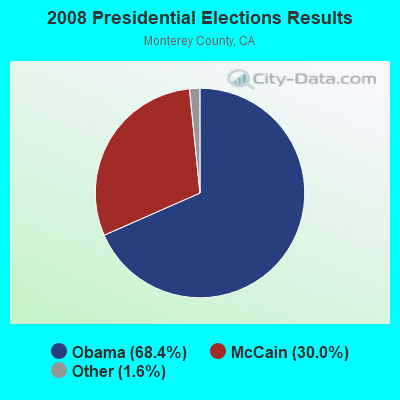
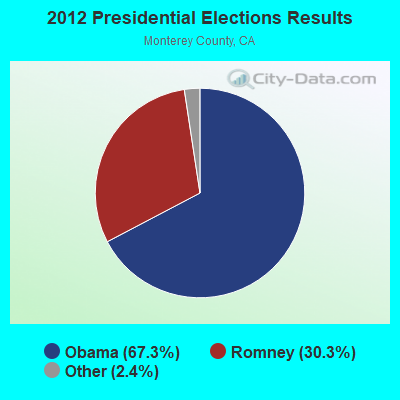
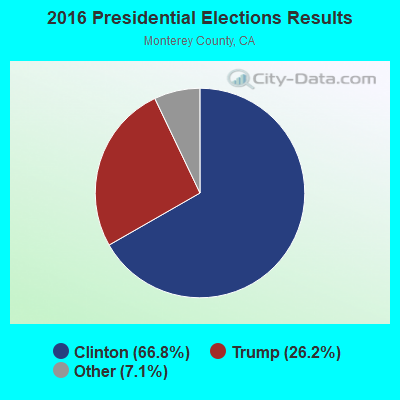
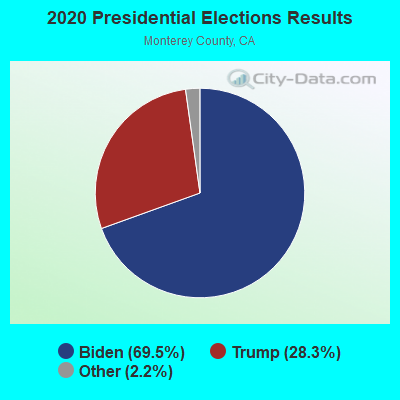
Graphs represent county-level data. Detailed 2008 Election Results
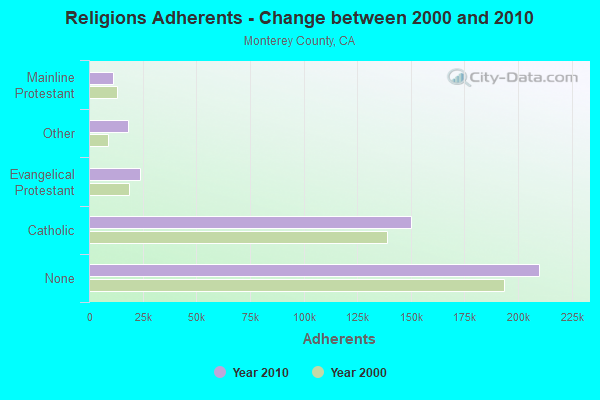
Religion statistics for Carmel Valley, CA (based on Monterey County data)
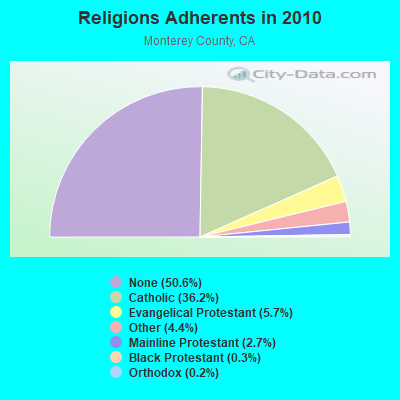
| Religion | Adherents | Congregations |
|---|---|---|
| Catholic | 150,050 | 26 |
| Evangelical Protestant | 23,624 | 154 |
| Other | 18,309 | 48 |
| Mainline Protestant | 11,244 | 48 |
| Black Protestant | 1,199 | 8 |
| Orthodox | 640 | 3 |
| None | 209,991 | - |
Food Environment Statistics:
| Monterey County: | 2.82 / 10,000 pop. |
| State: | 2.14 / 10,000 pop. |
| Monterey County: | 0.05 / 10,000 pop. |
| California: | 0.04 / 10,000 pop. |
| This county: | 0.91 / 10,000 pop. |
| California: | 0.62 / 10,000 pop. |
| Monterey County: | 2.00 / 10,000 pop. |
| California: | 1.49 / 10,000 pop. |
| This county: | 9.24 / 10,000 pop. |
| State: | 7.42 / 10,000 pop. |
| Here: | 7.5% |
| State: | 7.3% |
| Monterey County: | 21.8% |
| California: | 21.3% |
| Monterey County: | 18.4% |
| State: | 17.9% |
4.96% of this county's 2021 resident taxpayers lived in other counties in 2020 ($91,945 average adjusted gross income)
| Here: | 4.96% |
| California average: | 5.19% |
0.08% of residents moved from foreign countries ($1,276 average AGI)
Monterey County: 0.08% California average: 0.03%
Top counties from which taxpayers relocated into this county between 2020 and 2021:
| from Santa Cruz County, CA | |
| from Santa Clara County, CA | |
| from Los Angeles County, CA |
6.17% of this county's 2020 resident taxpayers moved to other counties in 2021 ($76,219 average adjusted gross income)
| Here: | 6.17% |
| California average: | 6.14% |
0.08% of residents moved to foreign countries ($1,055 average AGI)
Monterey County: 0.08% California average: 0.02%
Top counties to which taxpayers relocated from this county between 2020 and 2021:
| to Santa Cruz County, CA | |
| to Santa Clara County, CA | |
| to Los Angeles County, CA |
Businesses in Carmel Valley, CA
- FedEx: 2
- Goodwill: 3
- UPS: 1
Strongest AM radio stations in Carmel Valley:
- KYAA (1200 AM; 25 kW; SOQUEL, CA; Owner: PEOPLE'S RADIO, INC.)
- KSRK (540 AM; 10 kW; CARMEL VALLEY, CA; Owner: PEOPLE'S RADIO, INC.)
- KKMC (880 AM; 10 kW; GONZALES, CA; Owner: MONTEREY COUNTY BROADCASTERS, INC.)
- KMBX (700 AM; 10 kW; SOLEDAD, CA; Owner: ENTRAVISION HOLDINGS, LLC)
- KDBV (980 AM; 10 kW; SALINAS, CA; Owner: WOLFHOUSE RADIO GROUP, INC.)
- KION (1460 AM; 10 kW; SALINAS, CA)
- KTOM (1380 AM; 5 kW; SALINAS, CA; Owner: CLEAR CHANNEL BROADCASTING LICENSES, INC.)
- KLOK (1170 AM; 50 kW; SAN JOSE, CA; Owner: ENTRAVISION HOLDINGS, LLC)
- KTGE (1570 AM; 5 kW; SALINAS, CA; Owner: WOLFHOUSE RADIO GROUP, INC.)
- KRML (1410 AM; 2 kW; CARMEL, CA; Owner: WISDOM BROADCASTING CO, INC.)
- KNBR (680 AM; 50 kW; SAN FRANCISCO, CA; Owner: KNBR LICO, INC.)
- KGO (810 AM; 50 kW; SAN FRANCISCO, CA; Owner: KGO-AM RADIO, INC.)
- KTCT (1050 AM; 50 kW; SAN MATEO, CA; Owner: SUSQUEHANNA RADIO CORP.)
Strongest FM radio stations in Carmel Valley:
- KUSP (88.9 FM; SANTA CRUZ, CA; Owner: PATAPHYSICAL B/CING. FOUNDATION,INC.)
- K260AA (99.9 FM; CARMEL VALLEY, CA; Owner: ENTRAVISION HOLDINGS, LLC)
- KWAV (96.9 FM; MONTEREY, CA; Owner: BUCKLEY BROADCASTING OF MONTEREY)
- KTOM-FM (100.7 FM; SALINAS, CA; Owner: CLEAR CHANNEL BROADCASTING LICENSES, INC.)
- K291AE (106.1 FM; SEASIDE, CA; Owner: MAPELTON COMMUNICATIONS, LLC)
- KOCN (105.1 FM; PACIFIC GROVE, CA; Owner: CLEAR CHANNEL BROADCASTING LICENSES, INC.)
- KSEA (107.9 FM; GREENFIELD, CA; Owner: FARMWORKER EDU'AL RADIO NETWORK, INC)
- K240AK (95.9 FM; SOLEDAD, CA; Owner: CALVARY CHAPEL OF TWIN FALLS, INC.)
- K265DK (100.9 FM; GREENFIELD, CA; Owner: CLEAR CHANNEL BROADCASTING LICENSES, INC.)
- KBOQ (95.5 FM; CARMEL, CA; Owner: J & M BROADCASTING, INC.)
- KMJO (92.7 FM; MARINA, CA; Owner: CLEAR CHANNEL BROADCASTING LICENSES, INC.)
- KDON-FM (102.5 FM; SALINAS, CA; Owner: CLEAR CHANNEL BROADCASTING LICENSES, INC.)
- K202DU (88.3 FM; SAN JUAN BAUTISTA, CA; Owner: CALVARY CHAPEL OF TWIN FALLS, INC.)
- KSES-FM (107.1 FM; SEASIDE, CA; Owner: ENTRAVISION HOLDINGS, LLC)
- KBTU (93.5 FM; HOLLISTER, CA; Owner: MAPLETON COMMUNICATIONS, L.L.C.)
- KAZU (90.3 FM; PACIFIC GROVE, CA; Owner: FOUNDATION OF CALIFORNIA STATE UNIVERSITY, MONTEREY BAY)
- KLVM (89.7 FM; PRUNEDALE, CA; Owner: PRUNEDALE EDUCATIONAL ASSOCIATION)
- KCDU (101.7 FM; CARMEL, CA; Owner: MAPLETON COMMUNICATIONS, L.L.C.)
- K265DG (100.9 FM; HOLLISTER, CA; Owner: CLEAR CHANNEL BROADCASTING LICENSES, INC.)
- K206BQ (89.1 FM; HOLLISTER, CA; Owner: PATAPHYSICAL BROADCASTING FOUNDATION, INC.)
TV broadcast stations around Carmel Valley:
- K13GS (Channel 13; CARMEL VALLEY, CA; Owner: HEARST-ARGYLE STATIONS, INC.)
- KION-TV (Channel 46; MONTEREY, CA; Owner: ACKERLEY MEDIA GROUP, INC.)
- KMMD-CA (Channel 3; SALINAS, CA; Owner: CABALLERO TELEVISION TEXAS, L.L.C.)
- K53DT (Channel 53; MONTEREY, CA; Owner: TRINITY BROADCASTING NETWORK)
- KSBW (Channel 8; SALINAS, CA; Owner: HEARST-ARGYLE STATIONS, INC.)
- KCBA (Channel 35; SALINAS, CA; Owner: SEAL ROCK BROADCASTERS, L.L.C.)
- K56AA (Channel 56; SALINAS, CA; Owner: MONTEREY CNTY SUPER. OF SCHOOLS)
FCC Registered Antenna Towers: 60 (See the full list of FCC Registered Antenna Towers)
FCC Registered Broadcast Land Mobile Towers: 12 (See the full list of FCC Registered Broadcast Land Mobile Towers in Carmel Valley, CA)
FCC Registered Microwave Towers: 16 (See the full list of FCC Registered Microwave Towers in this town)
FCC Registered Maritime Coast & Aviation Ground Towers: 1 (See the full list of FCC Registered Maritime Coast & Aviation Ground Towers)
FCC Registered Amateur Radio Licenses: 58 (See the full list of FCC Registered Amateur Radio Licenses in Carmel Valley)
FAA Registered Aircraft: 17 (See the full list of FAA Registered Aircraft in Carmel Valley)
2005 - 2018 National Fire Incident Reporting System (NFIRS) incidents
- Fire incident types reported to NFIRS in Carmel Valley, CA
- 8444.2%Outside Fires
- 6534.2%Structure Fires
- 2915.3%Mobile Property/Vehicle Fires
- 126.3%Other
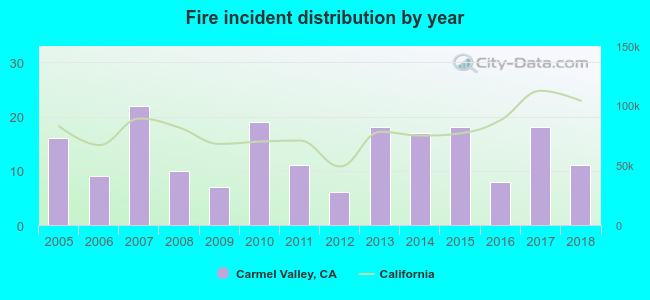 According to the data from the years 2005 - 2018 the average number of fires per year is 14. The highest number of reported fires - 22 took place in 2007, and the least - 6 in 2012. The data has a dropping trend.
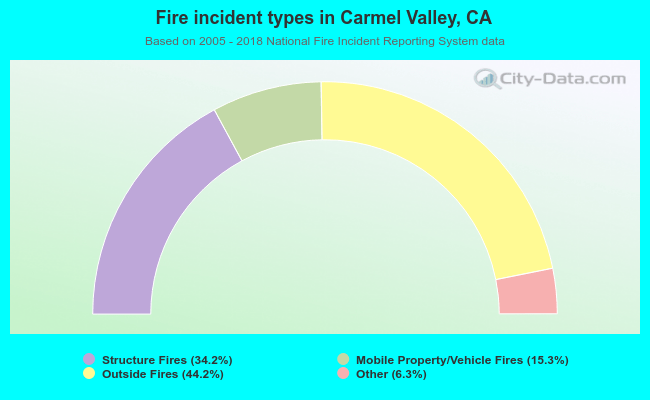 When looking into fire subcategories, the most incidents belonged to: Outside Fires (44.2%), and Structure Fires (34.2%).
| Most common first names in Carmel Valley, CA among deceased individuals | ||
| Name | Count | Lived (average) |
|---|---|---|
| John | 42 | 75.6 years |
| Robert | 35 | 74.3 years |
| William | 35 | 75.4 years |
| Mary | 28 | 81.1 years |
| George | 27 | 78.2 years |
| James | 25 | 74.2 years |
| Ruth | 19 | 80.0 years |
| Charles | 19 | 73.8 years |
| Helen | 18 | 84.1 years |
| Joseph | 13 | 74.0 years |
| Most common last names in Carmel Valley, CA among deceased individuals | ||
| Last name | Count | Lived (average) |
|---|---|---|
| Smith | 13 | 77.9 years |
| Wilson | 10 | 78.8 years |
| Jones | 10 | 75.3 years |
| Johnson | 8 | 75.8 years |
| Williams | 7 | 74.7 years |
| Miller | 6 | 78.2 years |
| Davis | 6 | 82.0 years |
| Brown | 6 | 79.0 years |
| Baker | 6 | 72.9 years |
| Lewis | 6 | 69.2 years |
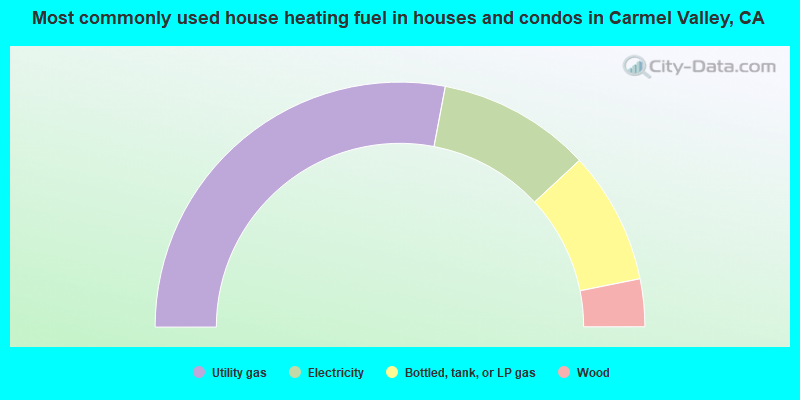
- 55.9%Utility gas
- 20.2%Electricity
- 17.5%Bottled, tank, or LP gas
- 6.3%Wood
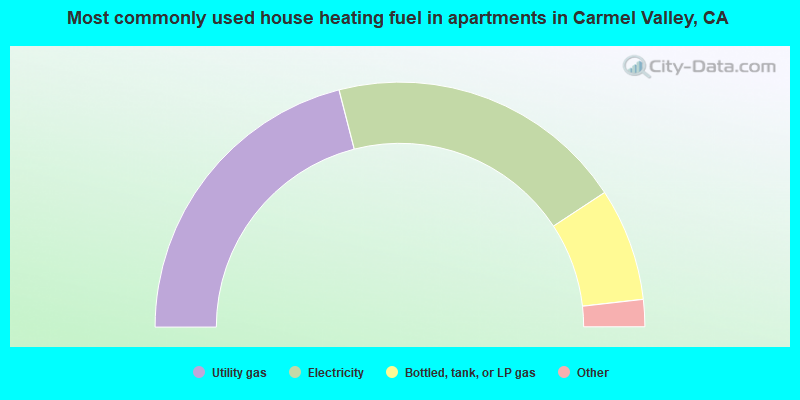
- 42.0%Utility gas
- 39.5%Electricity
- 14.9%Bottled, tank, or LP gas
- 2.2%Other fuel
- 1.4%Wood
Carmel Valley compared to California state average:
- Unemployed percentage significantly below state average.
- Black race population percentage significantly below state average.
- Hispanic race population percentage significantly below state average.
- Median age significantly above state average.
- Foreign-born population percentage significantly below state average.
- Length of stay since moving in significantly above state average.
- Number of rooms per house significantly below state average.
- House age significantly below state average.
- Percentage of population with a bachelor's degree or higher above state average.
Carmel Valley on our top lists:
- #2 on the list of "Top 101 cities with largest percentage of females in industries: publishing, and motion picture and sound recording industries (population 5,000+)"
- #2 on the list of "Top 101 cities with largest percentage of females in industries: alcoholic beverages merchant wholesalers (population 5,000+)"
- #3 on the list of "Top 101 cities with largest percentage of females in occupations: advertising, marketing, promotions, public relations, and sales managers (population 5,000+)"
- #5 on the list of "Top 101 cities with largest percentage of males in occupations: art and design workers (population 5,000+)"
- #10 on the list of "Top 101 cities with largest percentage of females in industries: beverage and tobacco products (population 5,000+)"
- #11 on the list of "Top 101 cities with largest percentage of females in occupations: librarians, curators, and archivists (population 5,000+)"
- #12 on the list of "Top 101 cities with largest percentage of females in industries: miscellaneous durable goods merchant wholesalers (population 5,000+)"
- #19 on the list of "Top 101 cities with largest percentage of females in industries: furniture and home furnishings, and household appliance stores (population 5,000+)"
- #19 on the list of "Top 101 cities with largest percentage of males in occupations: other health diagnosing and treating practitioners and technical occupations (population 5,000+)"
- #22 on the list of "Top 101 cities with largest percentage of females in industries: retail florists (population 5,000+)"
- #24 on the list of "Top 101 cities with largest percentage of males in industries: used merchandise, gift, novelty, and souvenir, and other miscellaneous stores (population 5,000+)"
- #25 on the list of "Top 101 cities with largest percentage of females in occupations: other health diagnosing and treating practitioners and technical occupations (population 5,000+)"
- #27 on the list of "Top 101 cities with largest percentage of males in occupations: legal support workers (population 5,000+)"
- #29 on the list of "Top 101 cities with largest percentage of females in industries: miscellaneous nondurable goods merchant wholesalers (population 5,000+)"
- #32 on the list of "Top 101 cities with largest percentage of males in industries: beverage and tobacco products (population 5,000+)"
- #44 on the list of "Top 101 cities with largest percentage of females in industries: office supplies and stationery stores (population 5,000+)"
- #48 on the list of "Top 101 cities with largest percentage of females in industries: book stores and news dealers (population 5,000+)"
- #54 on the list of "Top 101 cities with largest percentage of females in industries: personal and laundry services (population 5,000+)"
- #56 on the list of "Top 101 cities with largest percentage of males in industries: miscellaneous nondurable goods merchant wholesalers (population 5,000+)"
- #68 on the list of "Top 101 cities with largest percentage of males in industries: pharmacies and drug stores (population 5,000+)"
- #86 (93924) on the list of "Top 101 zip codes with the largest percentage of taxpayers reporting profit/loss from business in 2012 (pop 5,000+)"
- #15 on the list of "Top 101 counties with the highest Nitrogen Dioxide air pollution readings in 2012 (ppm)"
- #20 on the list of "Top 101 counties with the lowest surface withdrawal of fresh water for public supply (pop. 50,000+)"
- #33 on the list of "Top 101 counties with the highest number of births per 1000 residents 2007-2013"
- #44 on the list of "Top 101 counties with the lowest Particulate Matter (PM2.5) Annual air pollution readings in 2012 (µg/m3)"
- #54 on the list of "Top 101 counties with the highest Particulate Matter (PM10) Annual air pollution readings in 2012 (µg/m3)"

|
|
Total of 102 patent applications in 2008-2024.