Toro, California
Submit your own pictures of this place and show them to the world
- OSM Map
- General Map
- Google Map
- MSN Map

| Males: 5,160 | |
| Females: 5,239 |
| Median resident age: | 42.1 years |
| California median age: | 33.3 years |
Zip code: 93908
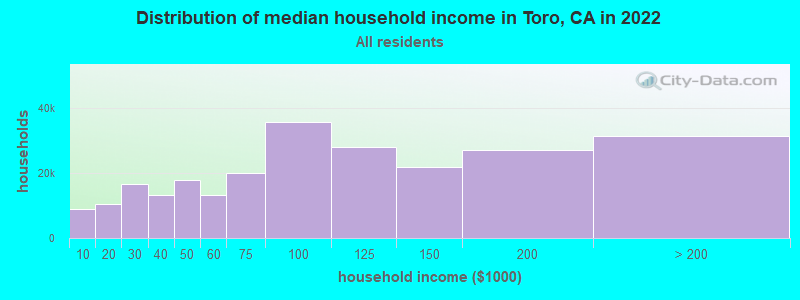
| Toro: | $171,631 |
| CA: | $91,551 |
Estimated per capita income in 2022: $80,295 (it was $43,750 in 2000)
Toro CCD income, earnings, and wages data
Estimated median house or condo value in 2022: over $1,000,000 (it was $426,500 in 2000)
| Toro: | over $1,000,000 |
| CA: | $715,900 |
Mean prices in 2022: all housing units: $955,620; detached houses: over $1,000,000; townhouses or other attached units: $741,452; in 2-unit structures: $782,213; in 3-to-4-unit structures: $910,101; in 5-or-more-unit structures: $502,903; mobile homes: $231,372; occupied boats, rvs, vans, etc.: $667,482
Detailed information about poverty and poor residents in Toro, CA
Compare current foreclosures near Toro, CA:
| Photo | Address | Area | Beds / Baths | Price | Details |
|---|---|---|---|---|---|

|
#1
Fulton Way
Salinas, CA 93907
|
1,248 sq. feet
|
2 baths 3 beds |
show details | |

|
#2
Little River Dr
Salinas, CA 93906
|
2,405 sq. feet
|
2 baths 4 beds |
show details | |

|
#3
Legends Ct
Salinas, CA 93908
|
3,821 sq. feet
|
4 baths 5 beds |
show details | |

|
#4
Luzern St
Seaside, CA 93955
|
999 sq. feet
|
1 baths 3 beds |
show details | |

|
#5
Alameda Ave
Salinas, CA 93901
|
1,720 sq. feet
|
2 baths 3 beds |
show details | |

|
#6
Work Ave
Monterey, CA 93940
|
2,048 sq. feet
|
3 baths 4 beds |
show details | |

|
#7
Arezzo Cir
Salinas, CA 93905
|
2,131 sq. feet
|
2 baths 5 beds |
show details | |

|
#8
Ocean Pines Ln
Pebble Beach, CA 93953
|
1,342 sq. feet
|
2 baths 2 beds |
show details | |

|
#9
W Alisal St
Salinas, CA 93901
|
2,122 sq. feet
|
1 baths 3 beds |
show details | |

|
#10
La Mesa Dr
Salinas, CA 93901
|
1,456 sq. feet
|
2 baths 3 beds |
show details |
| Photo | Address | Area | Beds / Baths | Price | Details |
|---|---|---|---|---|---|

|
#11
Amarillo Way
Salinas, CA 93905
|
1,065 sq. feet
|
2 baths 3 beds |
show details | |

|
#12
Belavida Rd
Monterey, CA 93940
|
5,790 sq. feet
|
5 baths 5 beds |
show details | |

|
#13
Old Stage Rd
Salinas, CA 93908
|
1,451 sq. feet
|
1 baths 3 beds |
show details | |

|
#14
Castro Rd
Monterey, CA 93940
|
2,604 sq. feet
|
2 baths 1 beds |
show details | |

|
#15
Josephine St
Salinas, CA 93905
|
1,107 sq. feet
|
2 baths 3 beds |
show details | |

|
#16
Luzern St
Seaside, CA 93955
|
1,040 sq. feet
|
1 baths 3 beds |
show details | |

|
#17
E Alisal St
Salinas, CA 93905
|
780 sq. feet
|
1 baths 2 beds |
show details | |

|
#18
2nd Ave
Salinas, CA 93905
|
1,130 sq. feet
|
1 baths 2 beds |
show details | |

|
#19
Flores St
Seaside, CA 93955
|
852 sq. feet
|
1 baths 2 beds |
show details | |

|
#20
Oxford Ct
Salinas, CA 93906
|
3,175 sq. feet
|
3 baths 6 beds |
show details |
| Photo | Address | Area | Beds / Baths | Price | Details |
|---|---|---|---|---|---|

|
#21
Luzern St
Seaside, CA 93955
|
1,039 sq. feet
|
1 baths 3 beds |
show details | |

|
#22
Logan Ln
Monterey, CA 93940
|
1,439 sq. feet
|
2 baths 3 beds |
show details | |

|
#23
Judson St
Seaside, CA 93955
|
1,452 sq. feet
|
2 baths 3 beds |
show details | |

|
#24
Seeno St
Monterey, CA 93940
|
2,517 sq. feet
|
4 baths 4 beds |
show details | |

|
#25
Pacific Ave
Salinas, CA 93905
|
1,008 sq. feet
|
1 baths 3 beds |
show details | |

|
#26
Colton Dr
Salinas, CA 93907
|
1,194 sq. feet
|
2 baths 3 beds |
show details | |

|
#27
Yosemite St
Seaside, CA 93955
|
1,456 sq. feet
|
1 baths 3 beds |
show details | |

|
#28
Victor St
Salinas, CA 93907
|
1,234 sq. feet
|
2 baths 3 beds |
show details | |

|
#29
Vallejo St
Seaside, CA 93955
|
622 sq. feet
|
1 baths 2 beds |
show details | |

|
#30
Terrace St
Salinas, CA 93905
|
1,315 sq. feet
|
2 baths 3 beds |
show details |
| Photo | Address | Area | Beds / Baths | Price | Details |
|---|---|---|---|---|---|

|
#31
Barcelona Cir
Salinas, CA 93906
|
1,165 sq. feet
|
2 baths 3 beds |
show details | |

|
#32
Lombard Cir
Salinas, CA 93907
|
1,522 sq. feet
|
2 baths 3 beds |
show details | |

|
#33
Central Ave
Pacific Grove, CA 93950
|
1,012 sq. feet
|
1 baths 2 beds |
show details | |

|
#34
Yosemite Cir
Salinas, CA 93906
|
1,160 sq. feet
|
2 baths 3 beds |
show details | |

|
#35
Lindberg Ct
Seaside, CA 93955
|
2,302 sq. feet
|
2 baths 3 beds |
show details | |

|
#36
The Crossroads Blvd # 298
Carmel, CA 93923
|
967 sq. feet
|
2 baths 3 beds |
show details | |

|
#37
2nd St
Pacific Grove, CA 93950
|
998 sq. feet
|
1 baths 2 beds |
show details | |

|
#38
N Carmel Hills Dr
Carmel, CA 93923
|
515 sq. feet
|
2 baths 3 beds |
show details | |

|
#39
Crescent Ave
Marina, CA 93933
|
1,799 sq. feet
|
2 baths 3 beds |
show details | |

|
#40
Yerba Buena Ct
Seaside, CA 93955
|
1,531 sq. feet
|
2 baths 3 beds |
show details |
| Photo | Address | Area | Beds / Baths | Price | Details |
|---|---|---|---|---|---|

|
#41
Bush St
Salinas, CA 93907
|
1,080 sq. feet
|
2 baths 2 beds |
show details | |

|
#42
Lily St
Monterey, CA 93940
|
1,386 sq. feet
|
1 baths 2 beds |
show details | |

|
#43
Linwood Dr
Salinas, CA 93906
|
1,232 sq. feet
|
2 baths 3 beds |
show details | |

|
#44
Reindollar Ave
Marina, CA 93933
|
1,039 sq. feet
|
1 baths 3 beds |
show details | |

|
#45
Rico St
Salinas, CA 93907
|
1,478 sq. feet
|
2 baths 3 beds |
show details | |

|
#46
Calle De La Paloma
Carmel Valley, CA 93924
|
1,895 sq. feet
|
2 baths 4 beds |
show details | |

|
#47
Soto St
Seaside, CA 93955
|
1,941 sq. feet
|
2 baths 5 beds |
show details | |

|
#48
Dougherty Pl
Carmel, CA 93923
|
2,794 sq. feet
|
5 baths 6 beds |
show details | |

|
#49
Judson St
Seaside, CA 93955
|
988 sq. feet
|
2 baths 3 beds |
show details | |

|
Check over 1 million property listings on Foreclosure.com!
|
browse all offers | |||

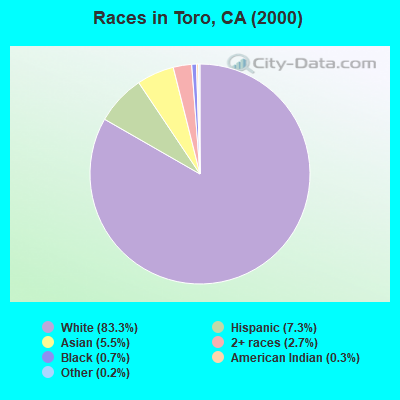
- 8,68883.3%White alone
- 7577.3%Hispanic
- 5745.5%Asian alone
- 2812.7%Two or more races
- 680.7%Black alone
- 310.3%American Indian alone
- 180.2%Other race alone
- 70.07%Native Hawaiian and Other
Pacific Islander alone
 Recent articles from our blog. Our writers, many of them Ph.D. graduates or candidates, create easy-to-read articles on a wide variety of topics.
Current Local Time: PST time zone
Land area: 74.7 square miles.
Population density: 139 people per square mile (very low).

| Toro CCD: | 0.7% ($2,835) |
| California: | 0.8% ($1,564) |
Nearest city with pop. 50,000+: Salinas, CA  (7.7 miles , pop. 151,060).
Nearest city with pop. 200,000+: San Jose, CA (51.0 miles , pop. 894,943).
Nearest city with pop. 1,000,000+: Los Angeles, CA (254.7 miles , pop. 3,694,820).
Nearest cities:
), ), ), Latitude: 36.58 N, Longitude: 121.70 W

| Here: | 8.6% |
| California: | 5.1% |
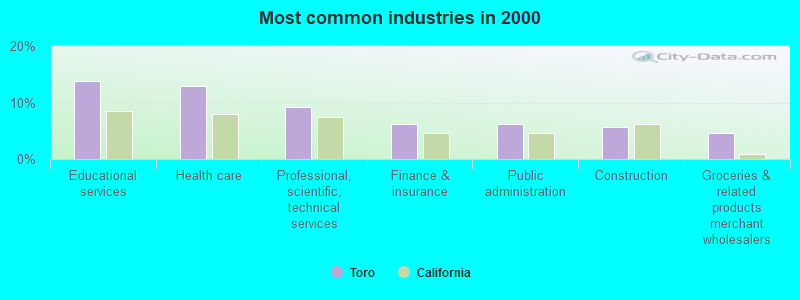
- Educational services (13.8%)
- Health care (12.9%)
- Professional, scientific, technical services (9.1%)
- Finance & insurance (6.3%)
- Public administration (6.1%)
- Construction (5.6%)
- Groceries & related products merchant wholesalers (4.7%)
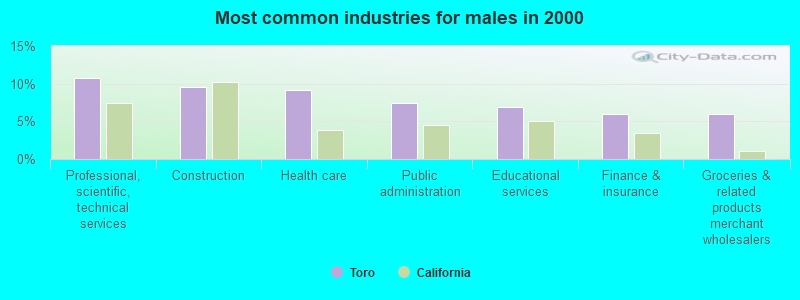
- Professional, scientific, technical services (10.8%)
- Construction (9.5%)
- Health care (9.1%)
- Public administration (7.4%)
- Educational services (6.9%)
- Finance & insurance (6.0%)
- Groceries & related products merchant wholesalers (6.0%)
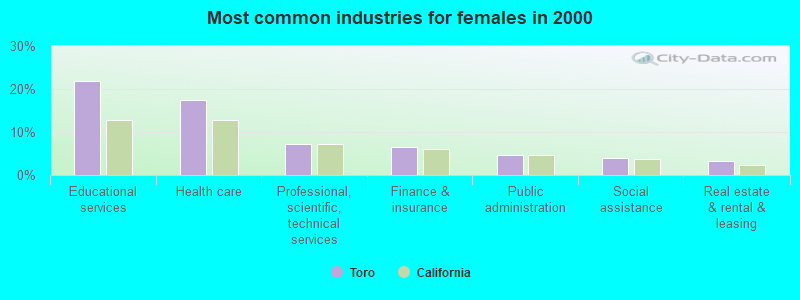
- Educational services (21.9%)
- Health care (17.4%)
- Professional, scientific, technical services (7.2%)
- Finance & insurance (6.5%)
- Public administration (4.6%)
- Social assistance (3.9%)
- Real estate & rental & leasing (3.2%)
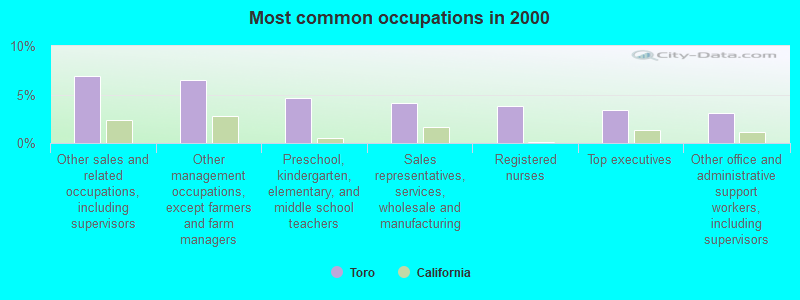
- Other sales and related occupations, including supervisors (6.9%)
- Other management occupations, except farmers and farm managers (6.5%)
- Preschool, kindergarten, elementary, and middle school teachers (4.6%)
- Sales representatives, services, wholesale and manufacturing (4.1%)
- Registered nurses (3.8%)
- Top executives (3.4%)
- Other office and administrative support workers, including supervisors (3.0%)
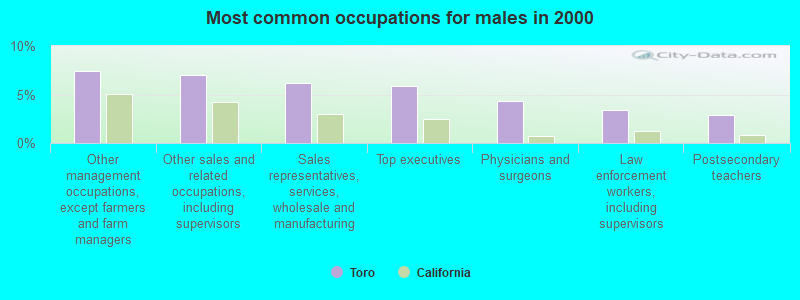
- Other management occupations, except farmers and farm managers (7.5%)
- Other sales and related occupations, including supervisors (7.0%)
- Sales representatives, services, wholesale and manufacturing (6.1%)
- Top executives (5.8%)
- Physicians and surgeons (4.3%)
- Law enforcement workers, including supervisors (3.4%)
- Postsecondary teachers (2.9%)
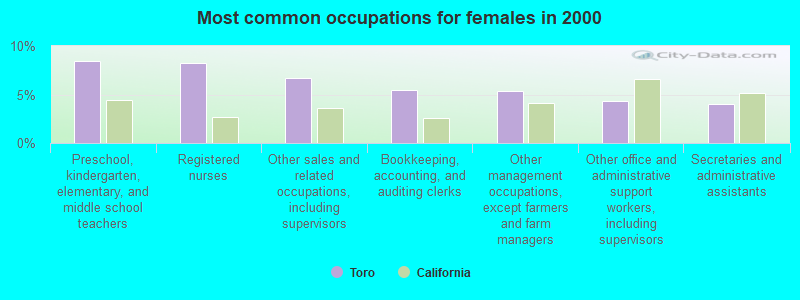
- Preschool, kindergarten, elementary, and middle school teachers (8.4%)
- Registered nurses (8.2%)
- Other sales and related occupations, including supervisors (6.7%)
- Bookkeeping, accounting, and auditing clerks (5.4%)
- Other management occupations, except farmers and farm managers (5.3%)
- Other office and administrative support workers, including supervisors (4.4%)
- Secretaries and administrative assistants (4.1%)
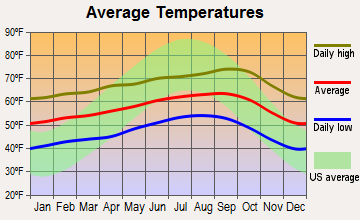
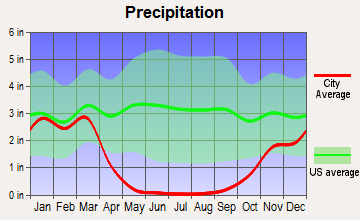
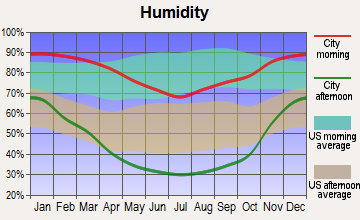
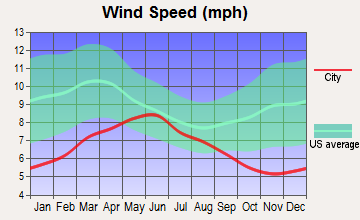
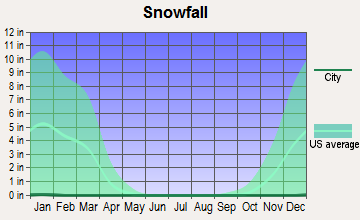
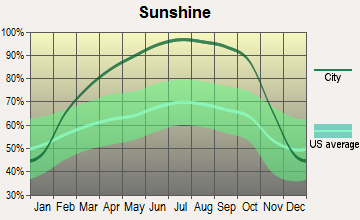
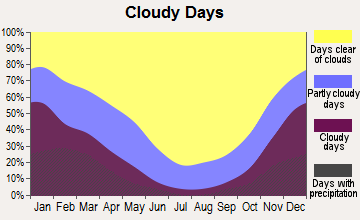
Average climate in Toro, California
Based on data reported by over 4,000 weather stations
(lower is better)
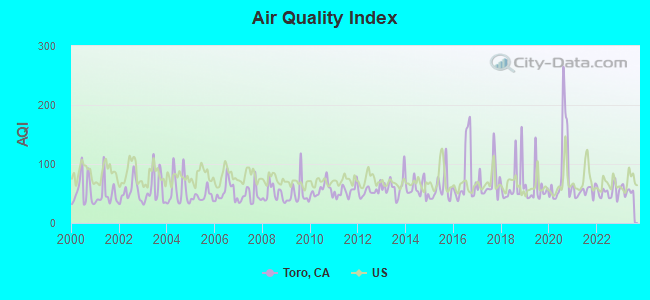
Air Quality Index (AQI) level in 2023 was 55.5. This is better than average.
| City: | 55.5 |
| U.S.: | 72.6 |
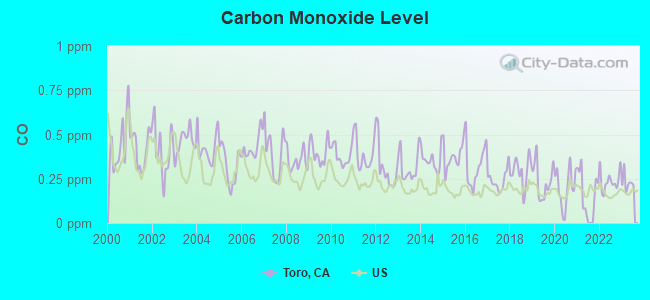
Carbon Monoxide (CO) [ppm] level in 2023 was 0.228. This is about average. Closest monitor was 7.1 miles away from the city center.
| City: | 0.228 |
| U.S.: | 0.251 |
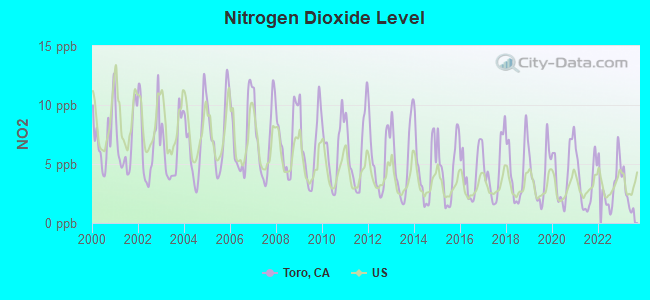
Nitrogen Dioxide (NO2) [ppb] level in 2023 was 2.40. This is significantly better than average. Closest monitor was 7.1 miles away from the city center.
| City: | 2.40 |
| U.S.: | 5.11 |
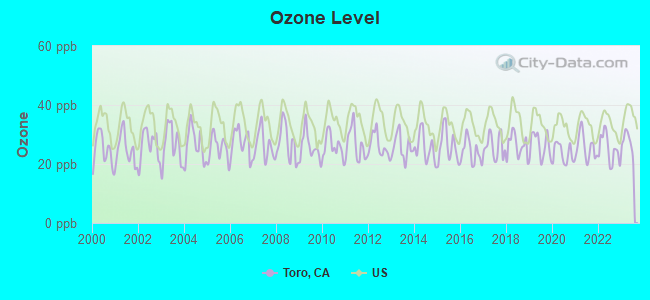
Ozone [ppb] level in 2023 was 27.4. This is better than average. Closest monitor was 6.1 miles away from the city center.
| City: | 27.4 |
| U.S.: | 33.3 |
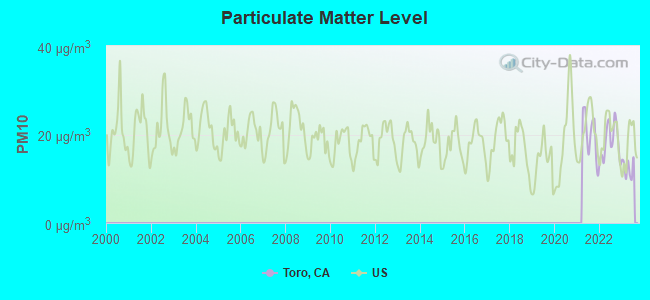
Particulate Matter (PM10) [µg/m3] level in 2023 was 12.5. This is significantly better than average. Closest monitor was 6.1 miles away from the city center.
| City: | 12.5 |
| U.S.: | 19.2 |
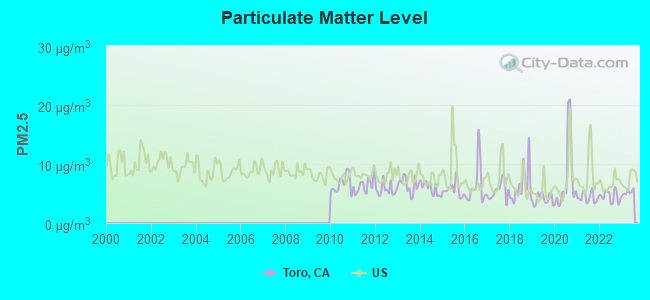
Particulate Matter (PM2.5) [µg/m3] level in 2023 was 5.18. This is significantly better than average. Closest monitor was 7.1 miles away from the city center.
| City: | 5.18 |
| U.S.: | 8.11 |
Earthquake activity:
Toro-area historical earthquake activity is significantly above California state average. It is 7504% greater than the overall U.S. average.On 4/18/1906 at 13:12:21, a magnitude 7.9 (7.9 UK, Class: Major, Intensity: VIII - XII) earthquake occurred 121.6 miles away from Toro center, causing $524,000,000 total damage
On 11/4/1927 at 13:51:53, a magnitude 7.5 (7.5 UK) earthquake occurred 121.1 miles away from Toro center
On 7/21/1952 at 11:52:14, a magnitude 7.7 (7.7 UK) earthquake occurred 186.6 miles away from the city center, causing $50,000,000 total damage
On 10/18/1989 at 00:04:15, a magnitude 7.1 (6.5 MB, 7.1 MS, 6.9 MW, 7.0 ML) earthquake occurred 36.8 miles away from the city center, causing 62 deaths (62 shaking deaths) and 3757 injuries, causing $1,305,032,704 total damage
On 5/2/1983 at 23:42:37, a magnitude 6.7 (6.2 MB, 6.5 MS, 6.5 MW, 6.7 ML, Class: Strong, Intensity: VII - IX) earthquake occurred 81.5 miles away from the city center, causing $31,000,000 total damage
On 12/22/2003 at 19:15:56, a magnitude 6.6 (6.1 MB, 6.4 MS, 6.6 MW, 6.4 MW) earthquake occurred 75.1 miles away from Toro center, causing 2 deaths (2 shaking deaths) and 40 injuries, causing $200,000,000 total damage
Magnitude types: body-wave magnitude (MB), local magnitude (ML), surface-wave magnitude (MS), moment magnitude (MW)
Natural disasters:
The number of natural disasters in Monterey County (23) is greater than the US average (15).Major Disasters (Presidential) Declared: 14
Emergencies Declared: 3
Causes of natural disasters: Floods: 12, Winter Storms: 7, Storms: 6, Fires: 4, Landslides: 4, Mudslides: 4, Freezes: 2, Drought: 1, Earthquake: 1, Hurricane: 1, Tornado: 1, Tsunami Wave: 1, Other: 1 (Note: some incidents may be assigned to more than one category).
Hospitals and medical centers near Toro:
- ALLIANCE HOME HEALTH, INC (Home Health Center, about 3 miles away; SALINAS, CA)
- VNA INTERMITTENT CARE, INC (Home Health Center, about 6 miles away; SALINAS, CA)
- SALINAS DIALYSIS CENTER (Dialysis Facility, about 7 miles away; SALINAS, CA)
- SALINAS VALLEY MEMORIAL HOSPITAL Acute Care Hospitals (about 7 miles away; SALINAS, CA)
- WINDSOR GARDENS REHABILITATION CENTER OF SALINAS (Nursing Home, about 7 miles away; SALINAS, CA)
- KINDRED NURSING AND TRANSITIONAL CARE-PACIFIC COAS (Nursing Home, about 7 miles away; SALINAS, CA)
- KATHERINE HEALTHCARE (Nursing Home, about 7 miles away; SALINAS, CA)
Amtrak stations near Toro:
- 8 miles: SALINAS (11 STATION PLACE) . Services: ticket office, partially wheelchair accessible, enclosed waiting area, public restrooms, public payphones, vending machines, free short-term parking, free long-term parking, call for car rental service, call for taxi service, public transit connection.
- 9 miles: SEASIDE (BLDG. T-1176, 4TH ST.) - Bus Station . Services: fully wheelchair accessible, public payphones, free short-term parking, call for taxi service, public transit connection.
- 11 miles: MONTEREY TRANSIT PLAZA (MONTEREY, PEARL & TYLER STS.) - Bus Station . Services: fully wheelchair accessible, public payphones, paid short-term parking, paid long-term parking, taxi stand, public transit connection.
Colleges/universities with over 2000 students nearest to Toro:
- Hartnell College (about 7 miles; Salinas, CA; Full-time enrollment: 5,506)
- California State University-Monterey Bay (about 8 miles; Seaside, CA; FT enrollment: 5,125)
- Naval Postgraduate School (about 10 miles; Monterey, CA; FT enrollment: 4,951)
- Monterey Peninsula College (about 11 miles; Monterey, CA; FT enrollment: 4,588)
- Gavilan College (about 29 miles; Gilroy, CA; FT enrollment: 3,327)
- Cabrillo College (about 32 miles; Aptos, CA; FT enrollment: 7,729)
- University of California-Santa Cruz (about 36 miles; Santa Cruz, CA; FT enrollment: 17,751)
Points of interest:
Notable locations in Toro: Morgan Winery (A), Corral de Tierra Country Club (B), Lincoln School (C), Guidotti Ranch (D), Bingamin Ranch (E), Salinas Rural Fire Protection District Station 1 Toro Station (F). Display/hide their locations on the map
Shopping Center: Toro Park Shopping Center (1). Display/hide its location on the map
Lake: El Toro Lake (A). Display/hide its location on the map
Creeks: Harper Creek (A), Watson Creek (B). Display/hide their locations on the map
Parks in Toro include: Hilltown Ferry State Historic Landmark (1), Keltron Park (2), Toro Regional Park (3). Display/hide their locations on the map
| This place: | 2.7 people |
| California: | 2.9 people |
| This place: | 77.2% |
| Whole state: | 69.4% |
| This place: | 3.1% |
| Whole state: | 5.9% |
Likely homosexual households (counted as self-reported same-sex unmarried-partner households)
- Lesbian couples: 0.1% of all households
- Gay men: 0.3% of all households
| This place: | 2.3% |
| Whole state: | 14.2% |
| This place: | 1.1% |
| Whole state: | 6.3% |
For population 15 years and over in Toro:
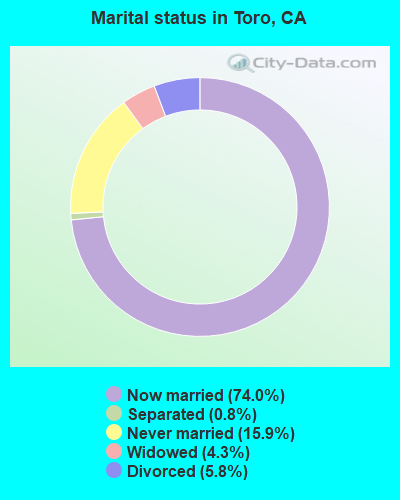
- Never married: 15.9%
- Now married: 74.0%
- Separated: 0.8%
- Widowed: 4.3%
- Divorced: 5.8%
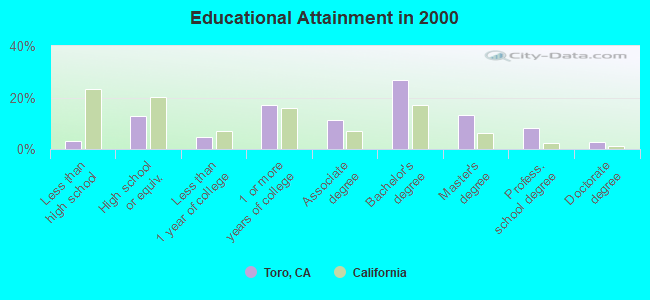
For population 25 years and over in Toro:
- High school or higher: 96.8%
- Bachelor's degree or higher: 51.1%
- Graduate or professional degree: 24.3%
- Unemployed: 3.3%
- Mean travel time to work (commute): 21.0 minutes
| Here: | 10.0 |
| California average: | 16.1 |
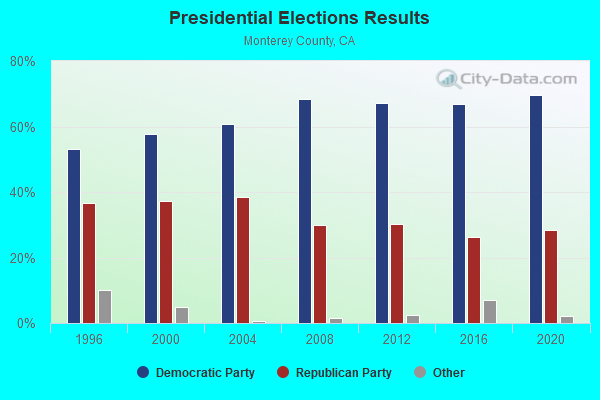
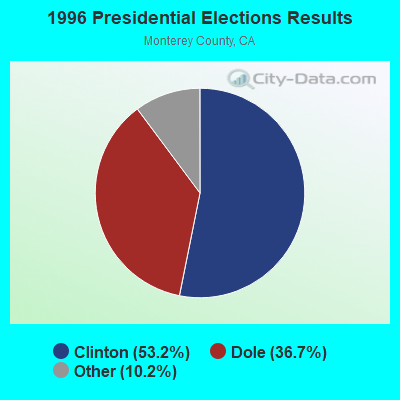
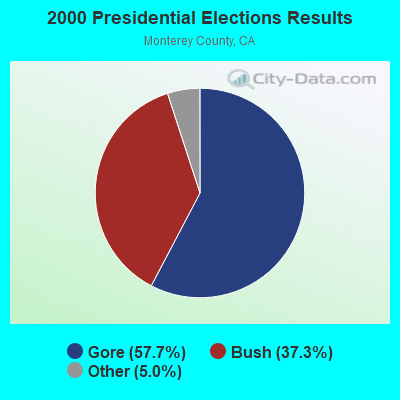
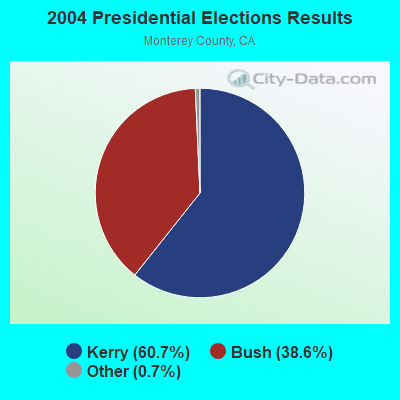
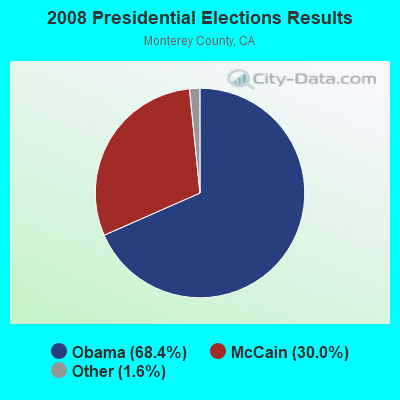
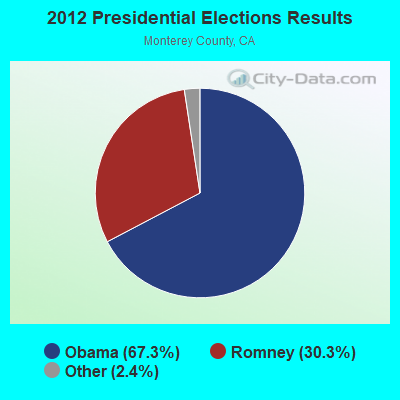
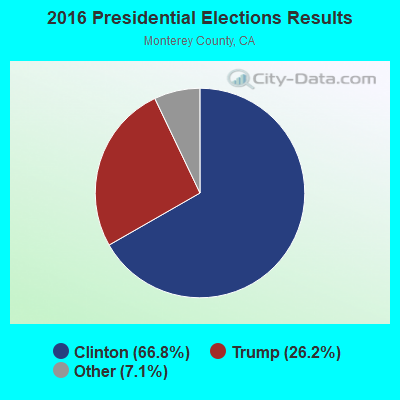
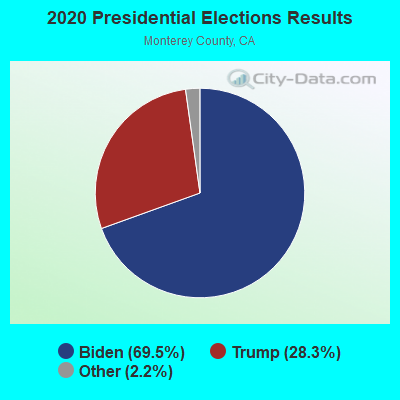
Graphs represent county-level data. Detailed 2008 Election Results
Religion statistics for Toro, CA (based on Monterey County data)
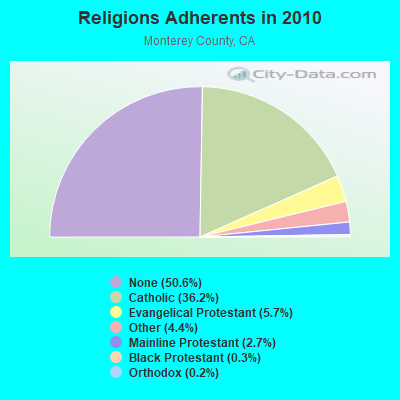
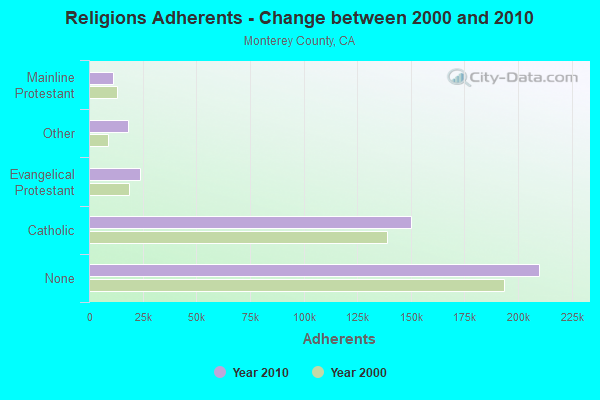
| Religion | Adherents | Congregations |
|---|---|---|
| Catholic | 150,050 | 26 |
| Evangelical Protestant | 23,624 | 154 |
| Other | 18,309 | 48 |
| Mainline Protestant | 11,244 | 48 |
| Black Protestant | 1,199 | 8 |
| Orthodox | 640 | 3 |
| None | 209,991 | - |
Food Environment Statistics:
| Here: | 2.82 / 10,000 pop. |
| State: | 2.14 / 10,000 pop. |
| Here: | 0.05 / 10,000 pop. |
| State: | 0.04 / 10,000 pop. |
| Monterey County: | 0.91 / 10,000 pop. |
| California: | 0.62 / 10,000 pop. |
| Monterey County: | 2.00 / 10,000 pop. |
| California: | 1.49 / 10,000 pop. |
| This county: | 9.24 / 10,000 pop. |
| California: | 7.42 / 10,000 pop. |
| This county: | 7.5% |
| California: | 7.3% |
| Monterey County: | 21.8% |
| State: | 21.3% |
| Here: | 18.4% |
| California: | 17.9% |
4.96% of this county's 2021 resident taxpayers lived in other counties in 2020 ($91,945 average adjusted gross income)
| Here: | 4.96% |
| California average: | 5.19% |
0.08% of residents moved from foreign countries ($1,276 average AGI)
Monterey County: 0.08% California average: 0.03%
Top counties from which taxpayers relocated into this county between 2020 and 2021:
| from Santa Cruz County, CA | |
| from Santa Clara County, CA | |
| from Los Angeles County, CA |
6.17% of this county's 2020 resident taxpayers moved to other counties in 2021 ($76,219 average adjusted gross income)
| Here: | 6.17% |
| California average: | 6.14% |
0.08% of residents moved to foreign countries ($1,055 average AGI)
Monterey County: 0.08% California average: 0.02%
Top counties to which taxpayers relocated from this county between 2020 and 2021:
| to Santa Cruz County, CA | |
| to Santa Clara County, CA | |
| to Los Angeles County, CA |
Strongest AM radio stations in Toro:
- KYAA (1200 AM; 25 kW; SOQUEL, CA; Owner: PEOPLE'S RADIO, INC.)
- KSRK (540 AM; 10 kW; CARMEL VALLEY, CA; Owner: PEOPLE'S RADIO, INC.)
- KDBV (980 AM; 10 kW; SALINAS, CA; Owner: WOLFHOUSE RADIO GROUP, INC.)
- KKMC (880 AM; 10 kW; GONZALES, CA; Owner: MONTEREY COUNTY BROADCASTERS, INC.)
- KION (1460 AM; 10 kW; SALINAS, CA)
- KTOM (1380 AM; 5 kW; SALINAS, CA; Owner: CLEAR CHANNEL BROADCASTING LICENSES, INC.)
- KTGE (1570 AM; 5 kW; SALINAS, CA; Owner: WOLFHOUSE RADIO GROUP, INC.)
- KMBX (700 AM; 10 kW; SOLEDAD, CA; Owner: ENTRAVISION HOLDINGS, LLC)
- KLOK (1170 AM; 50 kW; SAN JOSE, CA; Owner: ENTRAVISION HOLDINGS, LLC)
- KIDD (630 AM; 1 kW; MONTEREY, CA; Owner: BUCKLEY COMMUNICATIONS, INC.)
- KNBR (680 AM; 50 kW; SAN FRANCISCO, CA; Owner: KNBR LICO, INC.)
- KRML (1410 AM; 2 kW; CARMEL, CA; Owner: WISDOM BROADCASTING CO, INC.)
- KGO (810 AM; 50 kW; SAN FRANCISCO, CA; Owner: KGO-AM RADIO, INC.)
Strongest FM radio stations in Toro:
- K291AE (106.1 FM; SEASIDE, CA; Owner: MAPELTON COMMUNICATIONS, LLC)
- KUSP (88.9 FM; SANTA CRUZ, CA; Owner: PATAPHYSICAL B/CING. FOUNDATION,INC.)
- K260AA (99.9 FM; CARMEL VALLEY, CA; Owner: ENTRAVISION HOLDINGS, LLC)
- KWAV (96.9 FM; MONTEREY, CA; Owner: BUCKLEY BROADCASTING OF MONTEREY)
- KTOM-FM (100.7 FM; SALINAS, CA; Owner: CLEAR CHANNEL BROADCASTING LICENSES, INC.)
- KOCN (105.1 FM; PACIFIC GROVE, CA; Owner: CLEAR CHANNEL BROADCASTING LICENSES, INC.)
- KSES-FM (107.1 FM; SEASIDE, CA; Owner: ENTRAVISION HOLDINGS, LLC)
- KBOQ (95.5 FM; CARMEL, CA; Owner: J & M BROADCASTING, INC.)
- KMJO (92.7 FM; MARINA, CA; Owner: CLEAR CHANNEL BROADCASTING LICENSES, INC.)
- KCDU (101.7 FM; CARMEL, CA; Owner: MAPLETON COMMUNICATIONS, L.L.C.)
- KDON-FM (102.5 FM; SALINAS, CA; Owner: CLEAR CHANNEL BROADCASTING LICENSES, INC.)
- KAZU (90.3 FM; PACIFIC GROVE, CA; Owner: FOUNDATION OF CALIFORNIA STATE UNIVERSITY, MONTEREY BAY)
- K202DU (88.3 FM; SAN JUAN BAUTISTA, CA; Owner: CALVARY CHAPEL OF TWIN FALLS, INC.)
- KBTU (93.5 FM; HOLLISTER, CA; Owner: MAPLETON COMMUNICATIONS, L.L.C.)
- KLVM (89.7 FM; PRUNEDALE, CA; Owner: PRUNEDALE EDUCATIONAL ASSOCIATION)
- K265DG (100.9 FM; HOLLISTER, CA; Owner: CLEAR CHANNEL BROADCASTING LICENSES, INC.)
- K206BQ (89.1 FM; HOLLISTER, CA; Owner: PATAPHYSICAL BROADCASTING FOUNDATION, INC.)
- KMBY-FM (103.9 FM; SEASIDE, CA; Owner: MAPLETON COMMUNICATIONS, LLC)
- KSEA (107.9 FM; GREENFIELD, CA; Owner: FARMWORKER EDU'AL RADIO NETWORK, INC)
- K240AK (95.9 FM; SOLEDAD, CA; Owner: CALVARY CHAPEL OF TWIN FALLS, INC.)
TV broadcast stations around Toro:
- KION-TV (Channel 46; MONTEREY, CA; Owner: ACKERLEY MEDIA GROUP, INC.)
- K53DT (Channel 53; MONTEREY, CA; Owner: TRINITY BROADCASTING NETWORK)
- KSBW (Channel 8; SALINAS, CA; Owner: HEARST-ARGYLE STATIONS, INC.)
- KCBA (Channel 35; SALINAS, CA; Owner: SEAL ROCK BROADCASTERS, L.L.C.)
- KMMD-CA (Channel 3; SALINAS, CA; Owner: CABALLERO TELEVISION TEXAS, L.L.C.)
- KCAH (Channel 25; WATSONVILLE, CA; Owner: KTEH FOUNDATION)
- K29AB (Channel 29; MONTEREY, ETC., CA; Owner: KTVU PARTNERSHIP)
- KMUV-LP (Channel 23; MONTEREY, CA; Owner: SAINTE PARTNERS II, L.P.)
- KSMS-TV (Channel 67; MONTEREY, CA; Owner: ENTRAVISION HOLDINGS, LLC)
- K15CU (Channel 15; SALINAS, CA; Owner: TELEMUNDO OF NORTHERN CALIFORNIA LIC. CORP.)
- K42DT (Channel 42; COALINGA, CA; Owner: VENTURE TECHNOLOGIES GROUP, LLC)
- K56AA (Channel 56; SALINAS, CA; Owner: MONTEREY CNTY SUPER. OF SCHOOLS)
- KMCE-LP (Channel 43; MONTEREY, CA; Owner: SCOTTS VALLEY GROUP, INC. d/b as MARCOM)
FCC Registered Microwave Towers:
1- Santiago Peak, Unnamed Rd (Lat: 33.710417 Lon: -117.534250), Type: Pole, Structure height: 7.5 m, Overall height: 8.5 m, Call Sign: WQZU759,
Assigned Frequencies: 19380.0 MHz, 19380.0 MHz, 19380.0 MHz, 19380.0 MHz, 19380.0 MHz, 19380.0 MHz, 19380.0 MHz, 19380.0 MHz, 19380.0 MHz, 19380.0 MHz... (+12 more), Grant Date: 08/08/2017, Expiration Date: 08/08/2027, Certifier: Ryan Adams, Registrant: Micronet Communications, Inc., 812 Lexington Dr, Plano, TX 75075, Phone: (972) 422-7200, Email:
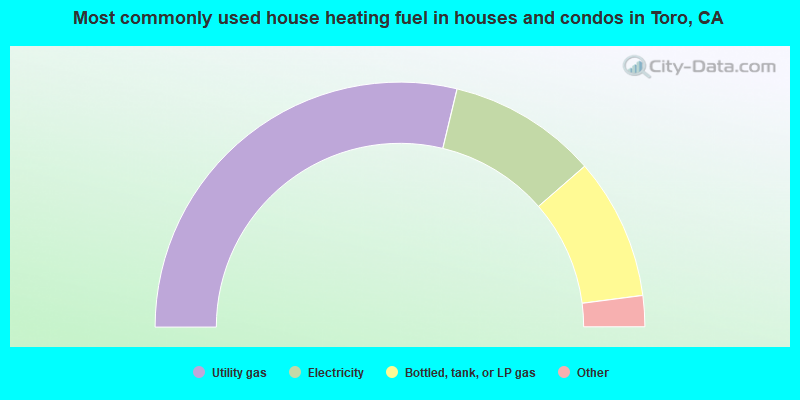
- 57.5%Utility gas
- 19.7%Electricity
- 18.7%Bottled, tank, or LP gas
- 2.4%Wood
- 0.9%Other fuel
- 0.5%Solar energy
- 0.2%Fuel oil, kerosene, etc.
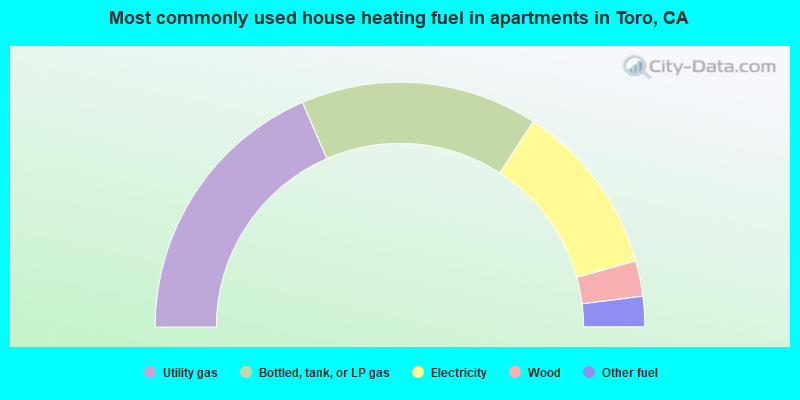
- 37.0%Utility gas
- 31.4%Bottled, tank, or LP gas
- 23.0%Electricity
- 4.7%Wood
- 4.0%Other fuel
Toro compared to California state average:
- Median household income above state average.
- Unemployed percentage significantly below state average.
- Black race population percentage significantly below state average.
- Hispanic race population percentage significantly below state average.
- Median age significantly above state average.
- Foreign-born population percentage significantly below state average.
- Renting percentage significantly below state average.
- Length of stay since moving in significantly above state average.
- Number of rooms per house significantly below state average.
- House age significantly below state average.
- Percentage of population with a bachelor's degree or higher above state average.
Toro on our top lists:
- #4 on the list of "Top 101 cities with largest percentage of males in industries: groceries and related products merchant wholesalers (population 5,000+)"
- #4 on the list of "Top 101 cities with largest percentage of females in occupations: financial managers (population 5,000+)"
- #4 on the list of "Top 101 cities with largest percentage of females in occupations: other health diagnosing and treating practitioners and technical occupations (population 5,000+)"
- #5 on the list of "Top 101 cities with largest percentage of males in occupations: architects, surveyors, and cartographers (population 5,000+)"
- #9 on the list of "Top 101 cities with largest percentage of males in occupations: art and design workers (population 5,000+)"
- #9 on the list of "Top 101 cities with largest percentage of females in industries: groceries and related products merchant wholesalers (population 5,000+)"
- #13 on the list of "Top 101 cities with largest percentage of females in occupations: lawyers (population 5,000+)"
- #22 on the list of "Top 101 cities with largest percentage of females in occupations: registered nurses (population 5,000+)"
- #27 on the list of "Top 101 cities with largest percentage of females in industries: alcoholic beverages merchant wholesalers (population 5,000+)"
- #35 on the list of "Top 101 cities with largest percentage of males in industries: health care (population 5,000+)"
- #42 on the list of "Top 101 cities with largest percentage of females in industries: farm supplies merchant wholesalers (population 5,000+)"
- #45 on the list of "Top 101 cities with largest percentage of males in industries: gasoline stations (population 5,000+)"
- #76 on the list of "Top 101 cities with largest percentage of females in industries: furniture and home furnishings, and household appliance stores (population 5,000+)"
- #80 on the list of "Top 101 cities with largest percentage of females in industries: truck transportation (population 5,000+)"
- #85 on the list of "Top 101 cities with largest percentage of females in industries: paper and paper products merchant wholesalers (population 5,000+)"
- #99 on the list of "Top 101 cities with largest percentage of males in industries: furniture and related product manufacturing (population 5,000+)"
- #15 on the list of "Top 101 counties with the highest Nitrogen Dioxide air pollution readings in 2012 (ppm)"
- #20 on the list of "Top 101 counties with the lowest surface withdrawal of fresh water for public supply (pop. 50,000+)"
- #33 on the list of "Top 101 counties with the highest number of births per 1000 residents 2007-2013"
- #44 on the list of "Top 101 counties with the lowest Particulate Matter (PM2.5) Annual air pollution readings in 2012 (µg/m3)"
- #54 on the list of "Top 101 counties with the highest Particulate Matter (PM10) Annual air pollution readings in 2012 (µg/m3)"