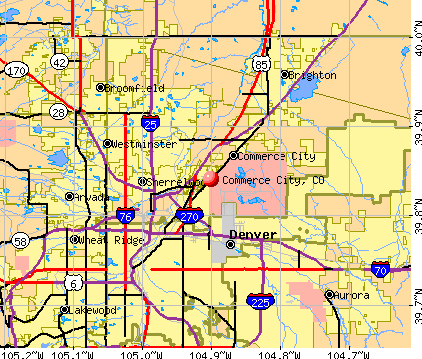
Commerce City, Colorado
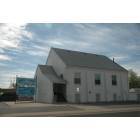
Commerce City: Church
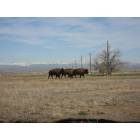
Commerce City: Bison back in Commerce City - Rocky Mountain Arsenal Nat'l Wildlife Refuge
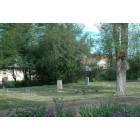
Commerce City: Pet Cemetery
Commerce City: Library
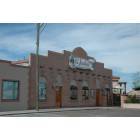
Commerce City: El Jardin
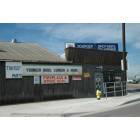
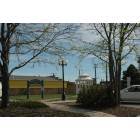
Commerce City: Younger Brothers
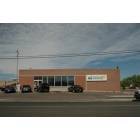
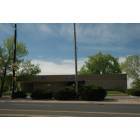
Commerce City: Post Office
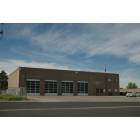
Commerce City: Fire Dept
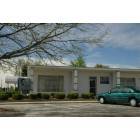
Commerce City: Funeral Home
Commerce City
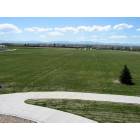
Commerce City: River Run Park
- see
16
more - add
your
Submit your own pictures of this city and show them to the world
- OSM Map
- General Map
- Google Map
- MSN Map
Population change since 2000: +215.0%
| Males: 33,845 | |
| Females: 32,270 |
| Median resident age: | 31.8 years |
| Colorado median age: | 37.7 years |
Zip codes: 80022, 80216, 80229.
Commerce City Zip Code Map| Commerce City: | $102,607 |
| CO: | $89,302 |
Estimated per capita income in 2022: $37,645 (it was $13,445 in 2000)
Commerce City city income, earnings, and wages data
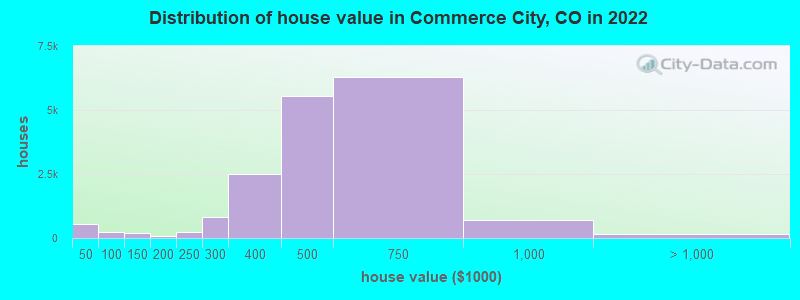
Estimated median house or condo value in 2022: $520,400 (it was $109,600 in 2000)
| Commerce City: | $520,400 |
| CO: | $531,100 |
Mean prices in 2022: all housing units: $510,107; detached houses: $546,623; townhouses or other attached units: $355,358; in 3-to-4-unit structures: $510,609; in 5-or-more-unit structures: $292,858; mobile homes: $39,890
Median gross rent in 2022: $1,119.
(4.2% for White Non-Hispanic residents, 30.3% for Black residents, 17.1% for Hispanic or Latino residents, 65.1% for American Indian residents, 10.3% for other race residents, 18.8% for two or more races residents)
Detailed information about poverty and poor residents in Commerce City, CO


Compare current foreclosures in Commerce City, CO:
| Photo | Address | Area | Beds / Baths | Price | Details |
|---|---|---|---|---|---|

|
#1
E 62nd Pl
Commerce City, CO 80022
|
1,429 sq. feet
|
2 baths 3 beds |
show details | |

|
#2
Sedalia St
Commerce City, CO 80022
|
2,138 sq. feet
|
2 baths 3 beds |
show details | |

|
#3
E 96th Way Unit 30b
Commerce City, CO 80022
|
1,216 sq. feet
|
2 baths 2 beds |
show details | |

|
#4
Niagara St
Commerce City, CO 80022
|
1,092 sq. feet
|
1 baths 4 beds |
show details | |

|
#5
E 98th Pl
Commerce City, CO 80022
|
2,771 sq. feet
|
2 baths 4 beds |
show details | |

|
#6
E 113th Ave
Commerce City, CO 80022
|
1,820 sq. feet
|
2 baths 2 beds |
show details | |

|
#7
Leyden Ln
Commerce City, CO 80022
|
720 sq. feet
|
1 baths 2 beds |
show details | |

|
#8
Chambers Dr
Commerce City, CO 80022
|
2,026 sq. feet
|
2 baths 4 beds |
show details | |

|
#9
Quintero St
Commerce City, CO 80022
|
2,633 sq. feet
|
2 baths 3 beds |
show details | |

|
#10
Joplin St
Commerce City, CO 80022
|
1,655 sq. feet
|
3 baths 3 beds |
show details |
| Photo | Address | Area | Beds / Baths | Price | Details |
|---|---|---|---|---|---|

|
#11
Magnolia St
Commerce City, CO 80022
|
1,032 sq. feet
|
1 baths 3 beds |
show details | |

|
#12
E 75th Pl
Commerce City, CO 80022
|
1,624 sq. feet
|
1 baths 3 beds |
show details | |

|
#13
Lewiston St
Commerce City, CO 80022
|
1,571 sq. feet
|
2 baths 4 beds |
show details | |

|
#14
Richfield Cir
Commerce City, CO 80022
|
1,841 sq. feet
|
2 baths 3 beds |
show details | |

|
#15
E 77th Pl
Commerce City, CO 80022
|
672 sq. feet
|
1 baths 2 beds |
show details | |

|
#16
E 78th Pl
Commerce City, CO 80022
|
1,104 sq. feet
|
1 baths 3 beds |
show details | |

|
#17
E 104th Way
Commerce City, CO 80022
|
2,219 sq. feet
|
2 baths 4 beds |
show details | |

|
#18
Hollywood St
Commerce City, CO 80022
|
816 sq. feet
|
1 baths 2 beds |
show details | |

|
#19
Pontiac St
Commerce City, CO 80022
|
1,250 sq. feet
|
1 baths 2 beds |
show details | |

|
#20
Granby Dr
Commerce City, CO 80022
|
3,455 sq. feet
|
2 baths 4 beds |
show details |
| Photo | Address | Area | Beds / Baths | Price | Details |
|---|---|---|---|---|---|

|
#21
Nucla St
Commerce City, CO 80022
|
2,004 sq. feet
|
3 baths 3 beds |
show details | |

|
#22
Danube St
Commerce City, CO 80022
|
1,801 sq. feet
|
2 baths 3 beds |
show details | |

|
#23
Holly St
Commerce City, CO 80022
|
1,277 sq. feet
|
1 baths 3 beds |
show details | |

|
#24
Norfolk St
Commerce City, CO 80022
|
2,060 sq. feet
|
2 baths 4 beds |
show details | |

|
#25
E 104th Pl
Commerce City, CO 80022
|
2,219 sq. feet
|
2 baths 3 beds |
show details | |

|
#26
Xanadu St
Commerce City, CO 80022
|
2,116 sq. feet
|
2 baths 3 beds |
show details | |

|
#27
Chambers Dr
Commerce City, CO 80022
|
4,205 sq. feet
|
3 baths 2 beds |
show details | |

|
#28
Carson Way
Commerce City, CO 80022
|
2,388 sq. feet
|
2 baths 4 beds |
show details | |

|
#29
Unity Pkwy
Commerce City, CO 80022
|
3,286 sq. feet
|
3 baths 4 beds |
show details | |

|
#30
Victor St
Commerce City, CO 80022
|
2,206 sq. feet
|
3 baths 3 beds |
show details |
| Photo | Address | Area | Beds / Baths | Price | Details |
|---|---|---|---|---|---|

|
#31
Telluride St
Commerce City, CO 80022
|
2,351 sq. feet
|
1 baths 3 beds |
show details | |

|
#32
Pontiac St
Commerce City, CO 80022
|
696 sq. feet
|
1 baths 2 beds |
show details | |

|
#33
Laredo Dr
Commerce City, CO 80022
|
1,655 sq. feet
|
2 baths 3 beds |
show details | |

|
#34
Jasmine St
Commerce City, CO 80022
|
1,736 sq. feet
|
2 baths 3 beds |
show details | |

|
#35
E 105th Pl
Commerce City, CO 80022
|
1,572 sq. feet
|
3 baths 3 beds |
show details | |

|
#36
E 117th Ave
Commerce City, CO 80022
|
2,364 sq. feet
|
2 baths 4 beds |
show details | |

|
#37
E 65th Ave
Commerce City, CO 80022
|
1,224 sq. feet
|
1 baths 3 beds |
show details | |

|
#38
Fraser St
Commerce City, CO 80022
|
2,450 sq. feet
|
2 baths 4 beds |
show details | |

|
#39
Bellaire St
Commerce City, CO 80022
|
1,034 sq. feet
|
1 baths 3 beds |
show details | |

|
#40
E 97th Way
Commerce City, CO 80022
|
1,718 sq. feet
|
3 baths 3 beds |
show details |
| Photo | Address | Area | Beds / Baths | Price | Details |
|---|---|---|---|---|---|

|
#41
E 62nd Pl
Commerce City, CO 80022
|
1,209 sq. feet
|
2 baths 3 beds |
show details | |

|
#42
E 96th Pl
Commerce City, CO 80022
|
1,484 sq. feet
|
3 baths 2 beds |
show details | |

|
#43
Fraser St
Commerce City, CO 80022
|
3,455 sq. feet
|
3 baths 4 beds |
show details | |

|
#44
Poplar St
Commerce City, CO 80022
|
- sq. feet
|
1 baths 3 beds |
show details | |

|
#45
E 77th Ave
Commerce City, CO 80022
|
1,285 sq. feet
|
1 baths 3 beds |
show details | |

|
#46
Jasper St
Commerce City, CO 80022
|
3,270 sq. feet
|
3 baths 4 beds |
show details | |

|
#47
E 106th Way
Commerce City, CO 80022
|
2,608 sq. feet
|
2 baths 3 beds |
show details | |

|
#48
Telluride St
Commerce City, CO 80022
|
1,948 sq. feet
|
2 baths 3 beds |
show details | |

|
#49
E 112th Ave Unit 28e
Commerce City, CO 80022
|
2,473 sq. feet
|
4 baths 2 beds |
show details | |

|
Check over 1 million property listings on Foreclosure.com!
|
browse all offers | |||


- 35,02153.0%Hispanic
- 26,34539.8%White alone
- 1,8112.7%Two or more races
- 1,2902.0%Black alone
- 1,1451.7%Asian alone
- 4540.7%Other race alone
- 500.08%American Indian alone
According to our research of Colorado and other state lists, there were 150 registered sex offenders living in Commerce City, Colorado as of June 03, 2024.
The ratio of all residents to sex offenders in Commerce City is 358 to 1.
The City-Data.com crime index weighs serious crimes and violent crimes more heavily. Higher means more crime, U.S. average is 246.1. It adjusts for the number of visitors and daily workers commuting into cities.
- means the value is smaller than the state average.- means the value is about the same as the state average.
- means the value is bigger than the state average.
- means the value is much bigger than the state average.
Crime rate in Commerce City detailed stats: murders, rapes, robberies, assaults, burglaries, thefts, arson
Full-time law enforcement employees in 2021, including police officers: 139 (111 officers - 91 male; 20 female).
| Officers per 1,000 residents here: | 1.82 |
| Colorado average: | 2.14 |
 Recent articles from our blog. Our writers, many of them Ph.D. graduates or candidates, create easy-to-read articles on a wide variety of topics.

 | Commerce City (11 replies) |
| Possibly moving to Denver from Dallas. Job in Commerce City, where to live with kids? (23 replies) |
| Working in Commerce City Schools (4 replies) |
| Taxes in Reunion/NE Commerce City (12 replies) |
| Where would you live if you had to commute to Commerce City for work? (12 replies) |
| The average home in metro Denver costs $540,624. Here's what that gets you. (158 replies) |
Latest news from Commerce City, CO collected exclusively by city-data.com from local newspapers, TV, and radio stations
Commerce City, CO City Guides:
Ancestries: American (5.9%), German (5.8%), English (4.2%), Irish (3.6%), European (2.2%), Norwegian (1.4%).
Current Local Time: MST time zone
Elevation: 5166 feet
Land area: 25.8 square miles.
Population density: 2,558 people per square mile (average).
10,654 residents are foreign born (12.6% Latin America).
| This city: | 16.7% |
| Colorado: | 9.5% |
Median real estate property taxes paid for housing units with mortgages in 2022: $4,717 (0.9%)
Median real estate property taxes paid for housing units with no mortgage in 2022: $2,635 (0.5%)
Nearest city with pop. 50,000+: Thornton, CO  (5.2 miles , pop. 82,384).
Nearest city with pop. 200,000+: West Adams, CO (5.4 miles , pop. 259,628).
Nearest city with pop. 1,000,000+: Phoenix, AZ (590.4 miles , pop. 1,321,045).
Nearest cities:
), ), ), ), Latitude: 39.84 N, Longitude: 104.90 W
Daytime population change due to commuting: +2,398 (+3.6%)
Workers who live and work in this city: 8,525 (26.3%)
Commerce City, Colorado accommodation & food services, waste management - Economy and Business Data
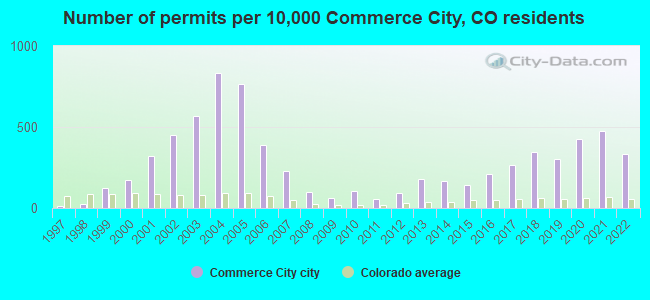
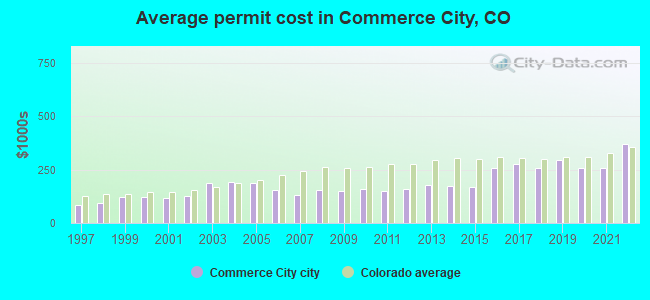
Single-family new house construction building permits:
- 2022: 706 buildings, average cost: $368,200
- 2021: 999 buildings, average cost: $256,500
- 2020: 892 buildings, average cost: $257,700
- 2019: 629 buildings, average cost: $293,200
- 2018: 719 buildings, average cost: $259,000
- 2017: 556 buildings, average cost: $277,400
- 2016: 442 buildings, average cost: $258,500
- 2015: 299 buildings, average cost: $170,400
- 2014: 346 buildings, average cost: $171,200
- 2013: 380 buildings, average cost: $178,700
- 2012: 192 buildings, average cost: $159,600
- 2011: 112 buildings, average cost: $147,500
- 2010: 221 buildings, average cost: $160,700
- 2009: 128 buildings, average cost: $149,100
- 2008: 207 buildings, average cost: $153,000
- 2007: 474 buildings, average cost: $133,200
- 2006: 816 buildings, average cost: $154,700
- 2005: 1605 buildings, average cost: $185,800
- 2004: 1750 buildings, average cost: $192,800
- 2003: 1185 buildings, average cost: $188,700
- 2002: 951 buildings, average cost: $126,200
- 2001: 680 buildings, average cost: $118,600
- 2000: 361 buildings, average cost: $123,300
- 1999: 257 buildings, average cost: $119,900
- 1998: 56 buildings, average cost: $95,400
- 1997: 27 buildings, average cost: $85,300
| Here: | 3.7% |
| Colorado: | 3.2% |
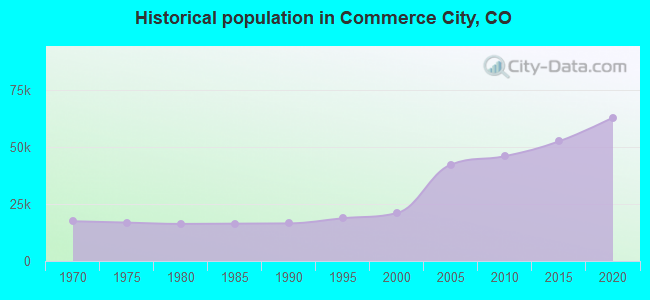
Population change in the 1990s: +4,150 (+24.6%).
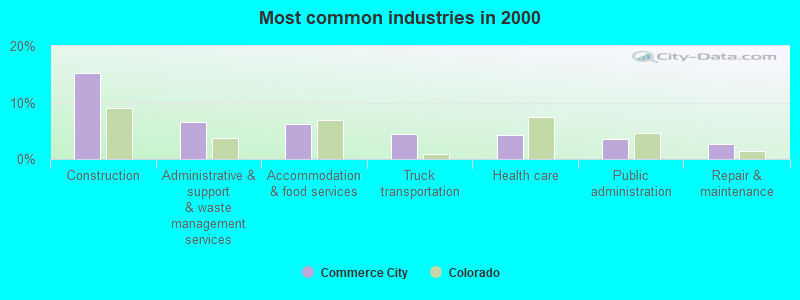
- Construction (15.2%)
- Administrative & support & waste management services (6.6%)
- Accommodation & food services (6.3%)
- Truck transportation (4.4%)
- Health care (4.2%)
- Public administration (3.6%)
- Repair & maintenance (2.6%)
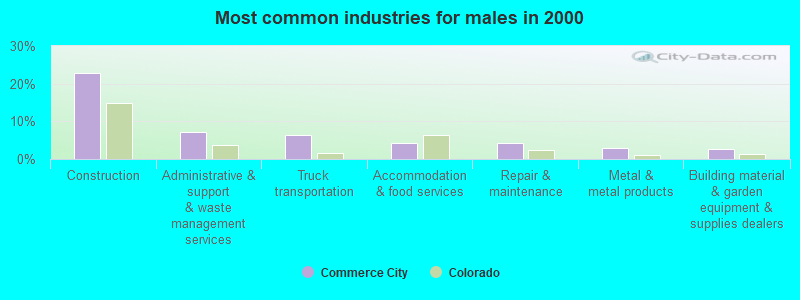
- Construction (22.9%)
- Administrative & support & waste management services (7.2%)
- Truck transportation (6.4%)
- Accommodation & food services (4.4%)
- Repair & maintenance (4.3%)
- Metal & metal products (2.8%)
- Building material & garden equipment & supplies dealers (2.7%)
- Health care (9.4%)
- Accommodation & food services (8.9%)
- Administrative & support & waste management services (5.9%)
- Public administration (5.4%)
- Finance & insurance (5.1%)
- Educational services (4.6%)
- Construction (4.6%)
- Driver/sales workers and truck drivers (6.0%)
- Building and grounds cleaning and maintenance occupations (5.6%)
- Laborers and material movers, hand (5.3%)
- Material recording, scheduling, dispatching, and distributing workers (4.8%)
- Construction traders workers except carpenters, electricians, painters, plumbers, and construction laborers (4.7%)
- Other production occupations, including supervisors (3.9%)
- Construction laborers (3.4%)
- Driver/sales workers and truck drivers (9.5%)
- Construction traders workers except carpenters, electricians, painters, plumbers, and construction laborers (8.1%)
- Laborers and material movers, hand (7.2%)
- Electrical equipment mechanics and other installation, maintenance, and repair workers, including supervisors (5.5%)
- Construction laborers (5.5%)
- Vehicle and mobile equipment mechanics, installers, and repairers (5.3%)
- Building and grounds cleaning and maintenance occupations (5.2%)
- Secretaries and administrative assistants (6.7%)
- Information and record clerks, except customer service representatives (6.6%)
- Building and grounds cleaning and maintenance occupations (6.1%)
- Material recording, scheduling, dispatching, and distributing workers (5.8%)
- Other office and administrative support workers, including supervisors (5.6%)
- Bookkeeping, accounting, and auditing clerks (4.1%)
- Customer service representatives (3.9%)
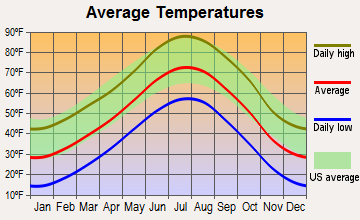
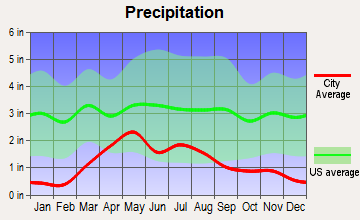
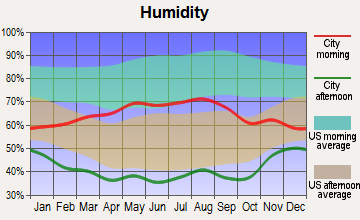
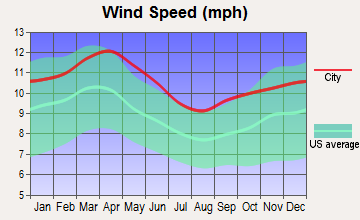
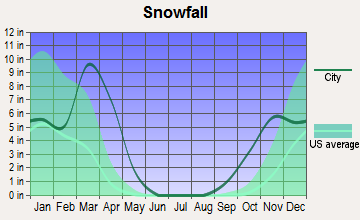
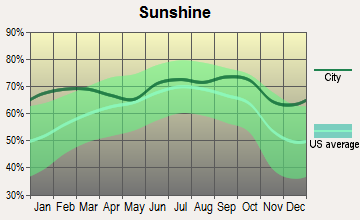
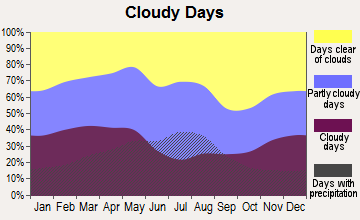
Average climate in Commerce City, Colorado
Based on data reported by over 4,000 weather stations
|
|

(lower is better)
Air Quality Index (AQI) level in 2023 was 123. This is significantly worse than average.
| City: | 123 |
| U.S.: | 73 |
Carbon Monoxide (CO) [ppm] level in 2023 was 0.273. This is about average. Closest monitor was 2.6 miles away from the city center.
| City: | 0.273 |
| U.S.: | 0.251 |
Nitrogen Dioxide (NO2) [ppb] level in 2023 was 15.4. This is significantly worse than average. Closest monitor was 2.6 miles away from the city center.
| City: | 15.4 |
| U.S.: | 5.1 |
Sulfur Dioxide (SO2) [ppb] level in 2023 was 0.906. This is significantly better than average. Closest monitor was 2.6 miles away from the city center.
| City: | 0.906 |
| U.S.: | 1.515 |
Ozone [ppb] level in 2023 was 33.7. This is about average. Closest monitor was 2.6 miles away from the city center.
| City: | 33.7 |
| U.S.: | 33.3 |
Particulate Matter (PM10) [µg/m3] level in 2023 was 24.4. This is worse than average. Closest monitor was 1.1 miles away from the city center.
| City: | 24.4 |
| U.S.: | 19.2 |

Particulate Matter (PM2.5) [µg/m3] level in 2023 was 9.14. This is about average. Closest monitor was 2.1 miles away from the city center.
| City: | 9.14 |
| U.S.: | 8.11 |
Lead (Pb) [µg/m3] level in 2009 was 0.00502. This is significantly better than average. Closest monitor was 1.1 miles away from the city center.
| City: | 0.00502 |
| U.S.: | 0.00931 |
Tornado activity:
Commerce City-area historical tornado activity is above Colorado state average. It is 36% greater than the overall U.S. average.
On 6/15/1988, a category F3 (max. wind speeds 158-206 mph) tornado 7.8 miles away from the Commerce City city center injured 7 people and caused between $5,000,000 and $50,000,000 in damages.
On 5/18/1975, a category F3 tornado 9.5 miles away from the city center .
Earthquake activity:
Commerce City-area historical earthquake activity is significantly above Colorado state average. It is 701% greater than the overall U.S. average.On 8/18/1959 at 06:37:13, a magnitude 7.7 (7.7 UK, Class: Major, Intensity: VIII - XII) earthquake occurred 439.9 miles away from the city center, causing $26,000,000 total damage
On 10/18/1984 at 15:30:23, a magnitude 5.5 (5.4 MB, 5.1 MS, 5.5 ML, Class: Moderate, Intensity: VI - VII) earthquake occurred 180.1 miles away from the city center
On 10/28/1983 at 14:06:06, a magnitude 7.3 (6.2 MB, 7.3 MS, 7.0 MW) earthquake occurred 543.1 miles away from Commerce City center, causing 2 deaths (2 shaking deaths) and 3 injuries, causing $15,000,000 total damage
On 8/23/2011 at 05:46:18, a magnitude 5.3 (5.3 MW, Depth: 2.5 mi) earthquake occurred 192.4 miles away from the city center
On 8/10/2005 at 22:08:22, a magnitude 5.0 (5.0 MW, Depth: 3.1 mi) earthquake occurred 200.2 miles away from the city center
On 8/10/2005 at 22:08:22, a magnitude 5.0 (5.0 MB, 4.7 MS, 5.0 MW) earthquake occurred 202.1 miles away from Commerce City center
Magnitude types: body-wave magnitude (MB), local magnitude (ML), surface-wave magnitude (MS), moment magnitude (MW)
Natural disasters:
The number of natural disasters in Adams County (11) is smaller than the US average (15).Major Disasters (Presidential) Declared: 6
Emergencies Declared: 4
Causes of natural disasters: Floods: 6, Storms: 5, Landslides: 3, Mudslides: 3, Snows: 2, Tornadoes: 2, Fire: 1, Heavy Rain: 1, Hurricane: 1, Snowstorm: 1, Other: 1 (Note: some incidents may be assigned to more than one category).
Hospitals and medical centers in Commerce City:
Amtrak stations near Commerce City:
- 9 miles: DENVER (1701 WYNKOOP ST.) . Services: ticket office, fully wheelchair accessible, enclosed waiting area, public restrooms, public payphones, full-service food facilities and snack bar, paid short-term parking, paid long-term parking, call for car rental service, taxi stand, public transit connection.
- 13 miles: DENVER INTERNATIONAL AP'T (DENVER, DENVER INTERNATIONAL AIRPORT) - Bus Station . Services: enclosed waiting area, public restrooms, public payphones, full-service food facilities, paid short-term parking, paid long-term parking, car rental agency, taxi stand, public transit connection.
Colleges/universities with over 2000 students nearest to Commerce City:
- Regis University (about 8 miles; Denver, CO; Full-time enrollment: 6,975)
- University of Colorado Denver (about 9 miles; Denver, CO; FT enrollment: 14,727)
- Front Range Community College (about 9 miles; Westminster, CO; FT enrollment: 14,756)
- Emily Griffith Technical College (about 9 miles; Denver, CO; FT enrollment: 2,460)
- Metropolitan State University of Denver (about 9 miles; Denver, CO; FT enrollment: 17,242)
- Community College of Denver (about 9 miles; Denver, CO; FT enrollment: 7,329)
- Community College of Aurora (about 11 miles; Aurora, CO; FT enrollment: 4,730)
Public high schools in Commerce City:
- ADAMS CITY HIGH SCHOOL (Students: 1,428, Location: 7200 QUEBEC PARKWAY, Grades: 9-12)
- LESTER R ARNOLD HIGH SCHOOL (Students: 213, Location: 6500 EAST 72ND AVENUE, Grades: 9-12)
- VICTORY PREPARATORY ACADEMY HIGH STATE CHARTER SCH (Location: 5701 QUEBEC STREET, Grades: 9-10, Charter school)
Biggest public elementary/middle schools in Commerce City:
- SECOND CREEK ELEMENTARY SCHOOL (Students: 767, Location: 9950 LAREDO DRIVE, Grades: PK-5)
- ADAMS CITY MIDDLE SCHOOL (Students: 611, Location: 4451 EAST 72ND AVENUE, Grades: 6-8)
- CENTRAL ELEMENTARY SCHOOL (Students: 563, Location: 6450 HOLLY STREET, Grades: PK-5)
- DUPONT ELEMENTARY SCHOOL (Students: 551, Location: 7970 KIMBERLY STREET, Grades: KG-5)
- KEARNEY MIDDLE SCHOOL (Students: 543, Location: 6160 KEARNEY STREET, Grades: 6-8)
- ALSUP ELEMENTARY SCHOOL (Students: 537, Location: 7101 BIRCH STREET, Grades: KG-5)
- COMMUNITY LEADERSHIP ACADEMY (Students: 435, Location: 6880 HOLLY STREET, Grades: PK-5, Charter school)
- MONACO ELEMENTARY SCHOOL (Students: 435, Location: 7631 MONACO BOULEVARD, Grades: KG-5)
- HANSON ELEMENTARY SCHOOL (Students: 425, Location: 7133 EAST 73RD AVENUE, Grades: PK-5)
- ROSE HILL ELEMENTARY SCHOOL (Students: 418, Location: 6900 EAST 58TH AVENUE, Grades: PK-5)
Private elementary/middle school in Commerce City:
User-submitted facts and corrections:
- Community Leadership Academy Charter School K-8 340 Students 6880 Holly Street, Commerce City, CO 80022
Points of interest:
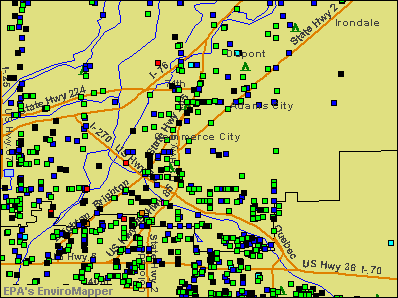
Notable locations in Commerce City: Hazeltine Siding (A), Mile High Greyhound Park (B), Rocky Mountain Speedway (C), Rock Mountain Industrial Park (D), Central Treatment Plant (E), Tower Landfill (F), Buffalo Run Golf Course (G), Anythink Commerce City Library (H), Colorado Refining Company Fire Department (I), South Adams County Fire Department Station 7 (J), Colorado State Patrol Adams County Troop Office 1D (K), Commerce City Police Department (L), Adams County Sheriff's Office Substation (M), South Adams County Fire Department Station 6 (N), South Adams County Fire Department Station 5 (O), South Adams County Fire Department Station 4 (P), South Adams County Fire Department Station 3 (Q), South Adams County Fire Department Station 2 (R), South Adams County Fire Department Station 1 (S). Display/hide their locations on the map
Shopping Center: Parkway Market Center Shopping Center (1). Display/hide its location on the map
Churches in Commerce City include: Denver United Christian Liberty Evangelical Church (A), Light of Life Church of God in Christ (B), Soul Care Full Gospel Center (C), Rose Hill Tabernacle (D), Our Saviour Lutheran Church (E), Our Lady Mother of the Church (F), Goode Centennial United Methodist Church (G), Derby Bible Church (H), Church of Jesus Christ of Latter Day Saints (I). Display/hide their locations on the map
Cemeteries: Riverside Cemetery (1), Rose Hill Cemetery (2). Display/hide their locations on the map
Reservoirs: Pikeview Reservoir (A), Pikeview Reservoir Number 2 (B), Vail Reservoir (C), Vaile Reservoir (D). Display/hide their locations on the map
Creeks: Sand Creek (A), First Creek (B). Display/hide their locations on the map
Parks in Commerce City include: Monaco Park (1), Los Valientes Park (2), Fairfax Park (3), Gottlieb and Rose Egli House (4). Display/hide their locations on the map
Tourist attractions: Gray Line Tours of Denver (Ski & Helicopter Tours; 5855 East 56th Avenue) (1), A 1 Quality Mobile Wash (6510 East 64th Avenue) (2), Balloon Safari (6510 East 64th Avenue) (3), Riehl Enterprises (6510 East 64th Avenue) (4), Star Amusements (5275 East 67th Place) (5), Colorado Charter Lines Inc (Tours & Charters; 4960 Locust Street) (6). Display/hide their approximate locations on the map
Hotels: Hi-U Inn Motel (7711 Brighton Road) (1), Clearview Motel (7750 Highway 2) (2), Crestline Motor Hotel (7330 Brighton Road) (3). Display/hide their approximate locations on the map
| This city: | 3.1 people |
| Colorado: | 2.5 people |
| This city: | 76.6% |
| Whole state: | 63.9% |
| This city: | 8.1% |
| Whole state: | 6.5% |
Likely homosexual households (counted as self-reported same-sex unmarried-partner households)
- Lesbian couples: 0.5% of all households
- Gay men: 0.5% of all households
People in group quarters in Commerce City in 2010:
- 191 people in nursing facilities/skilled-nursing facilities
- 127 people in residential treatment centers for adults
- 29 people in emergency and transitional shelters (with sleeping facilities) for people experiencing homelessness
- 2 people in group homes intended for adults
- 2 people in other noninstitutional facilities
People in group quarters in Commerce City in 2000:
- 185 people in nursing homes
- 42 people in other noninstitutional group quarters
- 41 people in homes or halfway houses for drug/alcohol abuse
- 31 people in other group homes
Banks with branches in Commerce City (2011 data):
- Wells Fargo Bank, National Association: Reunion Village at 18220 E 104th Avenue, Suite 101, branch established on 2006/11/21; Parkway Center Branch at 6025 E Parkway Drive, branch established on 1996/03/04. Info updated 2011/04/05: Bank assets: $1,161,490.0 mil, Deposits: $905,653.0 mil, headquarters in Sioux Falls, SD, positive income, 6395 total offices, Holding Company: Wells Fargo & Company
- Valley Bank & Trust: Commerce City Branch at 6990 East 72nd Avenue, branch established on 1996/10/28. Info updated 2007/11/29: Bank assets: $245.2 mil, Deposits: $220.9 mil, headquarters in Brighton, CO, positive income, Commercial Lending Specialization, 10 total offices, Holding Company: Valley Bancorp, Inc.
- FirstBank: 104th And Chambers Branch at 15250 East 104th Avenue, branch established on 2009/10/28. Info updated 2011/12/05: Bank assets: $11,597.1 mil, Deposits: $10,530.4 mil, headquarters in Lakewood, CO, positive income, Mortgage Lending Specialization, 130 total offices, Holding Company: Firstbank Holding Company
- KeyBank National Association: Commerce City North Branch at 6565 East 73rd Avenue, branch established on 1950/06/03. Info updated 2008/03/03: Bank assets: $86,198.8 mil, Deposits: $64,214.8 mil, headquarters in Cleveland, OH, positive income, Commercial Lending Specialization, 1067 total offices, Holding Company: Keycorp
- U.S. Bank National Association: Commerce City King Soopers Branch at 4850 East 62nd Avenue, branch established on 2004/07/15. Info updated 2012/01/30: Bank assets: $330,470.8 mil, Deposits: $236,091.5 mil, headquarters in Cincinnati, OH, positive income, 3121 total offices, Holding Company: U.S. Bancorp
- JPMorgan Chase Bank, National Association: Parkway Plaza Branch at 4952 E 62nd Ave, Ste A9, branch established on 2008/09/25. Info updated 2011/11/10: Bank assets: $1,811,678.0 mil, Deposits: $1,190,738.0 mil, headquarters in Columbus, OH, positive income, International Specialization, 5577 total offices, Holding Company: Jpmorgan Chase & Co.
- Academy Bank, National Association: Dahlia Street Branch at 5990 Dahlia Street, branch established on 2004/10/31. Info updated 2008/06/10: Bank assets: $282.1 mil, Deposits: $218.0 mil, headquarters in Colorado Springs, CO, positive income, Commercial Lending Specialization, 54 total offices, Holding Company: Dickinson Financial Corporation Ii
- Bank of the West: Commerce City Branch at 7326 Magnolia Street, branch established on 1992/07/14. Info updated 2009/11/16: Bank assets: $62,408.3 mil, Deposits: $43,995.2 mil, headquarters in San Francisco, CA, positive income, 647 total offices, Holding Company: Bnp Paribas
For population 15 years and over in Commerce City:
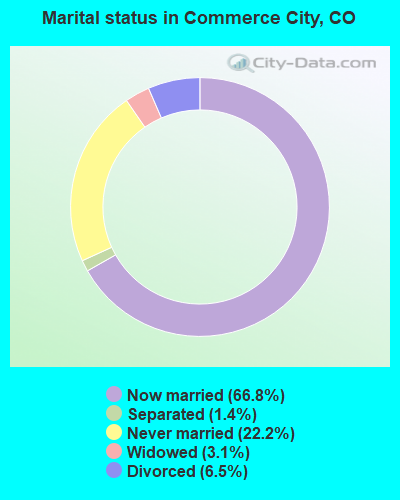
- Never married: 22.2%
- Now married: 66.8%
- Separated: 1.4%
- Widowed: 3.1%
- Divorced: 6.5%
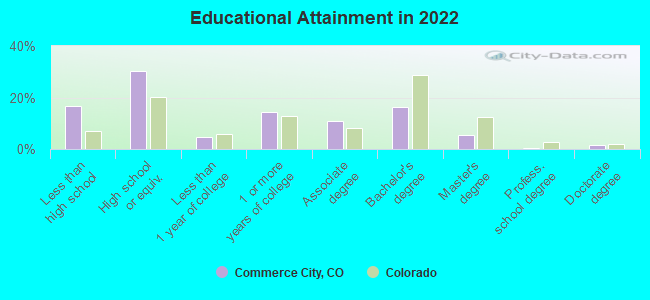
For population 25 years and over in Commerce City:
- High school or higher: 83.3%
- Bachelor's degree or higher: 23.6%
- Graduate or professional degree: 7.3%
- Unemployed: 7.2%
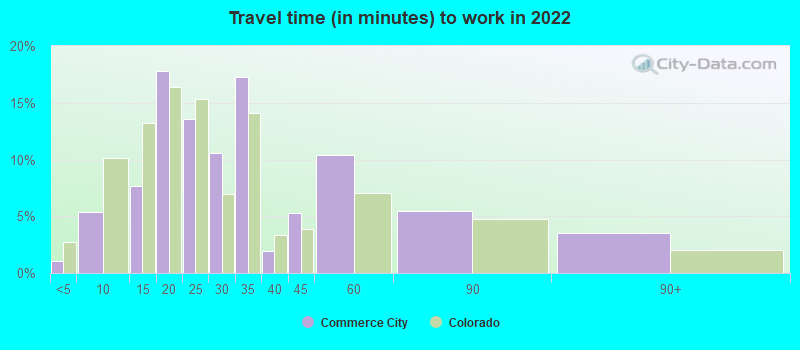
- Mean travel time to work (commute): 24.4 minutes
| Here: | 14.4 |
| Colorado average: | 11.1 |
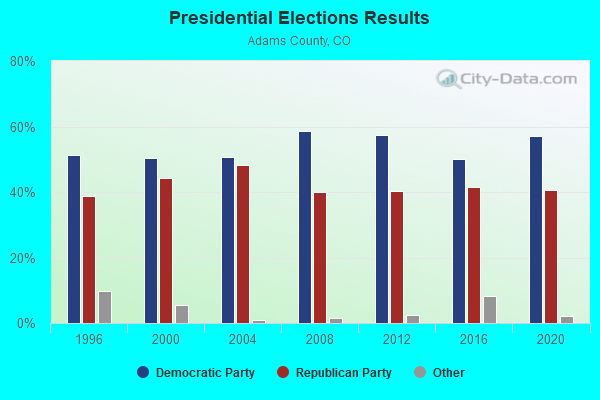
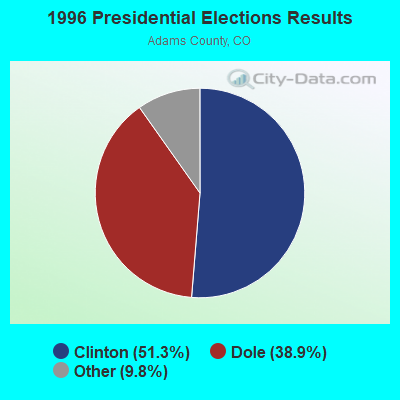
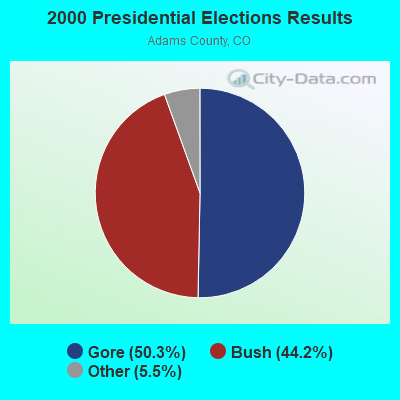
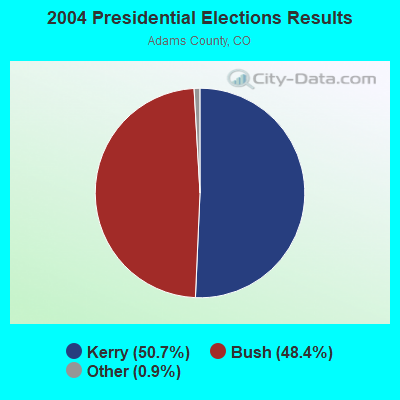
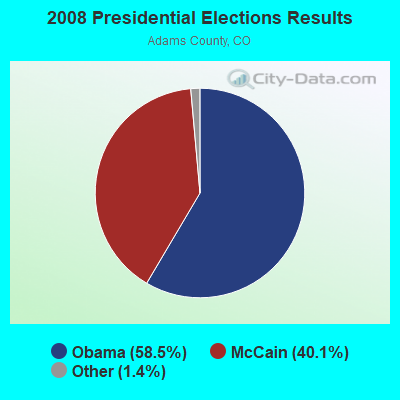
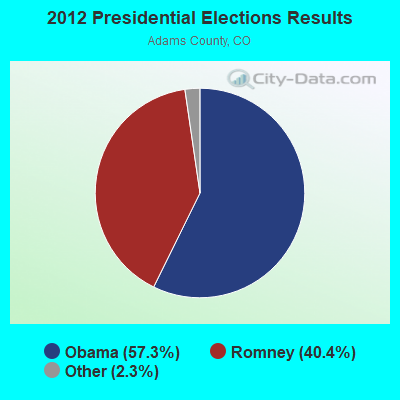
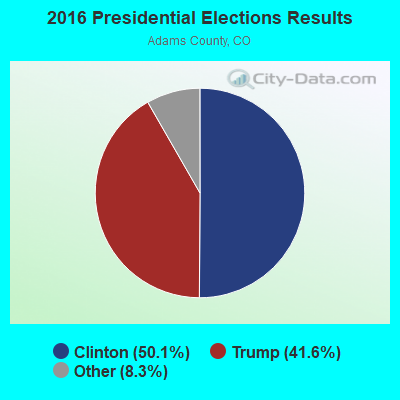
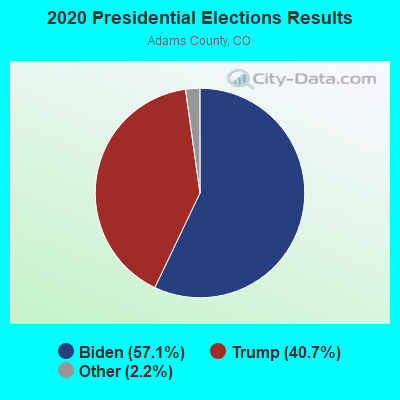
Graphs represent county-level data. Detailed 2008 Election Results
Neighborhoods in Commerce City:
(Commerce City, Colorado Neighborhood Map)- Adams City neighborhood
- Adams City Eagles neighborhood
- Adams City Gardens neighborhood
- Adams Heights neighborhood
- Adaphi neighborhood
- Adco Industrial Park neighborhood
- Airdale neighborhood
- Alpine Industrial Park neighborhood
- Amador neighborhood
- Aspen Hills neighborhood
- Barr Lake Estates neighborhood
- Benchmark Industrial Park neighborhood
- Bestview Acres neighborhood
- Beverly Homes neighborhood
- Blackhawk Derby neighborhood
- Blowhole Farms neighborhood
- Blueberry Hill neighborhood
- Bradell Estates neighborhood
- Bryan Gardens neighborhood
- Buckley Ranch neighborhood
- Buffalo Mesa neighborhood
- Buffalo Run neighborhood
- Cardinal neighborhood
- Carlson View neighborhood
- Carnation Meadows neighborhood
- Carnation Place neighborhood
- Chitwood neighborhood
- Classic Homes neighborhood
- Colorado Manor neighborhood
- Columbine Gardens neighborhood
- Columbine Ranches neighborhood
- Commerce City neighborhood
- Conter Estates neighborhood
- Corral-Lira Estates neighborhood
- Country Lane Estates neighborhood
- Creston neighborhood
- Crestone Condominiums neighborhood
- Cutler Farms neighborhood
- Dahlia Acres Industrial Park neighborhood
- Dahlia Business Park neighborhood
- Dahlia Heights neighborhood
- Dahlia Industrial Park neighborhood
- Derby neighborhood
- Derby Gardens neighborhood
- Derby Heights neighborhood
- Desmond Gardens neighborhood
- Dexter Street neighborhood
- Dupont neighborhood
- Dupont Derby Gardens neighborhood
- Dupont Estates neighborhood
- Eagle Cliff neighborhood
- Eagle Creek neighborhood
- East Irondale neighborhood
- Eire Gardens neighborhood
- El Sobrante neighborhood
- Eureka neighborhood
- Fairfax Industrial neighborhood
- Fingal Gardens neighborhood
- Fiore Tract Amnd neighborhood
- Forest Hill Estates neighborhood
- Foxton Village neighborhood
- Fritch neighborhood
- Fronterra Village neighborhood
- Gala Gardens neighborhood
- Gamble Derby neighborhood
- Garden Heights neighborhood
- Gem neighborhood
- Gi-Kel Acres neighborhood
- Gold Acres Industrial Park neighborhood
- Harry and Fanny Estates neighborhood
- Hedrick Industrial Park neighborhood
- High Pointe neighborhood
- Highland Park neighborhood
- Hill Top neighborhood
- Hinchman Renton Garden neighborhood
- Holly Gardens Condominiums neighborhood
- Holly Heights neighborhood
- Holly Park neighborhood
- Hutchison Park neighborhood
- I-270 Industrial Park neighborhood
- I-76 Business Center neighborhood
- Irondale neighborhood
- Ivy Park neighborhood
- Jeffersons North Capitol Hill neighborhood
- Jessica Estates neighborhood
- Kearney Condominiums neighborhood
- Kearney Heights neighborhood
- Kenwood Homes neighborhood
- Kincora Gardens neighborhood
- Lake Estates neighborhood
- Lands of Franklin neighborhood
- Leeper Industrial Park neighborhood
- Leyden Townhomes neighborhood
- Lifetime neighborhood
- Linden neighborhood
- Lindsay Tract neighborhood
- Lirio De Los Valles neighborhood
- Longaker Estates neighborhood
- Magnolia Park neighborhood
- Martindale Industrial Park neighborhood
- Meadow Lark Farms neighborhood
- Memory Lane Gardens neighborhood
- Metro District neighborhood
- Monac Park neighborhood
- Monaco Manor neighborhood
- Monaco Village neighborhood
- Monaco Vista neighborhood
- Monaghan Rose Hill neighborhood
- Morehead neighborhood
- Morningdale neighborhood
- Mountainview Estates neighborhood
- Newport Industrial Park neighborhood
- North Kearney neighborhood
- North Park neighborhood
- North Range Village neighborhood
- Northridge Park Condominiums neighborhood
- Norwood Park neighborhood
- Oak Grove neighborhood
- Offen Industrial Park neighborhood
- One Yellow Rose neighborhood
- Open Skies neighborhood
- Orchard and Vegetable Gardens neighborhood
- Parkside at Reunion Condominiums neighborhood
- Pinecrest neighborhood
- Pontiac Estates neighborhood
- Pontiac Gardens neighborhood
- Post Rock Farms neighborhood
- Potomac Farms neighborhood
- Prairie Farm neighborhood
- Prairie Gateway neighborhood
- Quebec Estates neighborhood
- Quebec Heights neighborhood
- Quebec Plaza neighborhood
- Quinby Farm neighborhood
- Ra Mar neighborhood
- Rainbow Gardens neighborhood
- Range View neighborhood
- Reunion neighborhood
- Riethmann Gardens neighborhood
- Rincon Condominiums neighborhood
- Roberts Gardens neighborhood
- Rocky Mountain Bluffs neighborhood
- Rocky Mountain Industrial Park neighborhood
- Rosehill neighborhood
- Saturn Homes neighborhood
- Second Creek Farm neighborhood
- Shady Trees neighborhood
- Shasta Estates neighborhood
- Sheryl Estates neighborhood
- South Derby neighborhood
- Spencer Estates neighborhood
- Stapleton Field Industrial Park neighborhood
- Starship Manor neighborhood
- Sterling Estates neighborhood
- Stonehenge neighborhood
- Stonehenge Industrial Park neighborhood
- Stonehouse Farm neighborhood
- Sun Ray neighborhood
- The Greens at Buffalo Run neighborhood
- Third Creek Country Ranchettes neighborhood
- Thomond Gardens neighborhood
- Town and Country neighborhood
- Turnberry neighborhood
- Twin Oaks Estates neighborhood
- Valentia Industrial Park neighborhood
- Valley View Gardens neighborhood
- Vantage Estates neighborhood
- Village Crest Apartments neighborhood
- Werth Industrial Park neighborhood
- West Derby Gardens neighborhood
- Wikiup Mobile Home Club neighborhood
- Wilson Park neighborhood
- Wittmus neighborhood
- Woodridge neighborhood
Religion statistics for Commerce City, CO (based on Adams County data)
| Religion | Adherents | Congregations |
|---|---|---|
| Catholic | 70,598 | 11 |
| Evangelical Protestant | 34,568 | 159 |
| Other | 17,157 | 38 |
| Mainline Protestant | 7,133 | 33 |
| Black Protestant | 195 | 2 |
| Orthodox | - | 1 |
| None | 311,952 | - |
Food Environment Statistics:
| Adams County: | 1.16 / 10,000 pop. |
| Colorado: | 1.50 / 10,000 pop. |
| This county: | 0.17 / 10,000 pop. |
| State: | 0.15 / 10,000 pop. |
| This county: | 0.21 / 10,000 pop. |
| State: | 0.45 / 10,000 pop. |
| This county: | 2.47 / 10,000 pop. |
| Colorado: | 3.13 / 10,000 pop. |
| Adams County: | 4.66 / 10,000 pop. |
| Colorado: | 8.99 / 10,000 pop. |
| Adams County: | 6.8% |
| Colorado: | 5.3% |
| Adams County: | 24.3% |
| Colorado: | 18.4% |
| Here: | 10.0% |
| State: | 9.6% |
Health and Nutrition:
| Commerce City: | 47.4% |
| Colorado: | 49.4% |
| Commerce City: | 46.7% |
| Colorado: | 47.8% |
| This city: | 28.4 |
| Colorado: | 28.5 |
| Commerce City: | 21.6% |
| Colorado: | 20.7% |
| Here: | 9.5% |
| Colorado: | 9.7% |
| This city: | 6.8 |
| Colorado: | 6.8 |
| Commerce City: | 32.0% |
| State: | 33.3% |
| Here: | 55.5% |
| State: | 57.3% |
| Commerce City: | 80.7% |
| Colorado: | 80.2% |
More about Health and Nutrition of Commerce City, CO Residents
Commerce City government finances - Expenditure in 2021 (per resident):
- Construction - Regular Highways: $16,917,000 ($255.87)
Parks and Recreation: $3,812,000 ($57.66)
Central Staff Services: $795,000 ($12.02)
Housing and Community Development: $582,000 ($8.80)
- Current Operations - Police Protection: $23,190,000 ($350.75)
Central Staff Services: $14,526,000 ($219.71)
Regular Highways: $12,387,000 ($187.36)
Parks and Recreation: $10,437,000 ($157.86)
Housing and Community Development: $7,020,000 ($106.18)
Solid Waste Management: $2,707,000 ($40.94)
Financial Administration: $2,543,000 ($38.46)
General - Other: $2,189,000 ($33.11)
Judicial and Legal Services: $1,540,000 ($23.29)
Protective Inspection and Regulation - Other: $1,374,000 ($20.78)
- General - Interest on Debt: $12,103,000 ($183.06)
- Total Salaries and Wages: $30,012,000 ($453.94)
Commerce City government finances - Revenue in 2021 (per resident):
- Charges - Other: $8,781,000 ($132.81)
Parks and Recreation: $3,167,000 ($47.90)
Solid Waste Management: $1,146,000 ($17.33)
- Federal Intergovernmental - Other: $1,031,000 ($15.59)
Housing and Community Development: $582,000 ($8.80)
- Local Intergovernmental - Other: $1,423,000 ($21.52)
Highways: $726,000 ($10.98)
- Miscellaneous - General Revenue - Other: $8,806,000 ($133.19)
Interest Earnings: $3,402,000 ($51.46)
Fines and Forfeits: $1,321,000 ($19.98)
Sale of Property: $71,000 ($1.07)
Special Assessments: $14,000 ($0.21)
- State Intergovernmental - Other: $2,201,000 ($33.29)
Highways: $1,741,000 ($26.33)
- Tax - General Sales and Gross Receipts: $71,654,000 ($1083.78)
Property: $12,020,000 ($181.80)
Other: $4,898,000 ($74.08)
Other License: $3,744,000 ($56.63)
Motor Vehicle License: $209,000 ($3.16)
Occupation and Business License - Other: $96,000 ($1.45)
Alcoholic Beverage License: $49,000 ($0.74)
Commerce City government finances - Debt in 2021 (per resident):
- Long Term Debt - Beginning Outstanding - Unspecified Public Purpose: $271,701,000 ($4109.52)
Outstanding Unspecified Public Purpose: $264,392,000 ($3998.97)
Retired Unspecified Public Purpose: $7,309,000 ($110.55)
Commerce City government finances - Cash and Securities in 2021 (per resident):
- Other Funds - Cash and Securities: $165,360,000 ($2501.10)
11.65% of this county's 2021 resident taxpayers lived in other counties in 2020 ($55,974 average adjusted gross income)
| Here: | 11.65% |
| Colorado average: | 11.28% |
0.01% of residents moved from foreign countries ($73 average AGI)
Adams County: 0.01% Colorado average: 0.05%
Top counties from which taxpayers relocated into this county between 2020 and 2021:
| from Denver County, CO | |
| from Jefferson County, CO | |
| from Arapahoe County, CO |
11.37% of this county's 2020 resident taxpayers moved to other counties in 2021 ($59,124 average adjusted gross income)
| Here: | 11.37% |
| Colorado average: | 11.05% |
0.01% of residents moved to foreign countries ($78 average AGI)
Adams County: 0.01% Colorado average: 0.03%
Top counties to which taxpayers relocated from this county between 2020 and 2021:
| to Denver County, CO | |
| to Jefferson County, CO | |
| to Arapahoe County, CO |
| Businesses in Commerce City, CO | ||||
| Name | Count | Name | Count | |
|---|---|---|---|---|
| 7-Eleven | 2 | Long John Silver's | 1 | |
| Ace Hardware | 1 | MasterBrand Cabinets | 3 | |
| Advance Auto Parts | 1 | McDonald's | 3 | |
| Arby's | 1 | Pizza Hut | 2 | |
| AutoZone | 1 | Popeyes | 1 | |
| Carl\s Jr. | 1 | SONIC Drive-In | 1 | |
| Chipotle | 1 | Starbucks | 1 | |
| Church's Chicken | 1 | Subway | 2 | |
| Cricket Wireless | 1 | T-Mobile | 1 | |
| Dairy Queen | 1 | Taco Bell | 1 | |
| Domino's Pizza | 1 | True Value | 1 | |
| FedEx | 6 | U-Haul | 3 | |
| H&R Block | 1 | UPS | 6 | |
| KFC | 1 | Walgreens | 1 | |
| Kroger | 1 | Walmart | 1 | |
| Little Caesars Pizza | 1 | Wendy's | 1 | |
Strongest AM radio stations in Commerce City:
- KLZ (560 AM; 5 kW; DENVER, CO; Owner: KLZ RADIO, INC.)
- KKFN (950 AM; 5 kW; DENVER, CO; Owner: JEFFERSON-PILOT COMMUNICATIONS COMPANY OF COLORADO)
- KLTT (670 AM; 50 kW; COMMERCE CITY, CO; Owner: KLZ RADIO, INC.)
- KJME (1390 AM; 5 kW; DENVER, CO; Owner: JO-MOR COMMUNICATIONS, INC.)
- KRKS (990 AM; 10 kW; DENVER, CO; Owner: SALEM MEDIA OF COLORADO, INC.)
- KKZN (760 AM; 50 kW; THORNTON, CO; Owner: JACOR BROADCASTING OF COLORADO, INC.)
- KHOW (630 AM; 5 kW; DENVER, CO; Owner: CITICASTERS LICENSES, L.P.)
- KBJD (1650 AM; 10 kW; DENVER, CO; Owner: SALEM MEDIA OF COLORADO, INC.)
- KMXA (1090 AM; 50 kW; AURORA, CO; Owner: ENTRAVISION HOLDINGS, LLC)
- KPOF (910 AM; 5 kW; DENVER, CO; Owner: PILLAR OF FIRE)
- KOA (850 AM; 50 kW; DENVER, CO; Owner: JACOR BROADCASTING OF COLORADO, INC.)
- KNUS (710 AM; 5 kW; DENVER, CO; Owner: SALEM MEDIA OF COLORADO, INC.)
- KLMO (1060 AM; 30 kW; LONGMONT, CO; Owner: PILGRIM COMMUNICATIONS, INC.)
Strongest FM radio stations in Commerce City:
- KQMT (99.5 FM; DENVER, CO; Owner: ENTERCOM DENVER LICENSE, LLC)
- KALC (105.9 FM; DENVER, CO; Owner: ENTERCOM DENVER LICENSE, LLC)
- KBPI (106.7 FM; DENVER, CO; Owner: JACOR BROADCASTING OF COLORADO, INC.)
- KOSI (101.1 FM; DENVER, CO; Owner: ENTERCOM DENVER LICENSE, LLC)
- KJCD (104.3 FM; LONGMONT, CO; Owner: JEFFERSON-PILOT COMMUNICATIONS COMPANY OF COLORADO)
- KFMD (95.7 FM; DENVER, CO; Owner: CITICASTERS LICENSES, L.P.)
- KRFX (103.5 FM; DENVER, CO; Owner: JACOR BROADCASTING OF COLORADO, INC.)
- KQKS (107.5 FM; LAKEWOOD, CO; Owner: JEFFERSON-PILOT COMMUNICATIONS COMPANY OF COLORADO)
- KDJM (92.5 FM; BROOMFIELD, CO; Owner: INFINITY RADIO OPERATIONS INC.)
- KBCO-FM (97.3 FM; BOULDER, CO; Owner: CITICASTERS LICENSES, L.P.)
- KTCL (93.3 FM; FORT COLLINS, CO; Owner: JACOR BROADCASTING OF COLORADO, INC.)
- KUVO (89.3 FM; DENVER, CO; Owner: DENVER EDUCATIONAL BROADCASTING)
- KIMN (100.3 FM; DENVER, CO; Owner: INFINITY RADIO OPERATIONS INC.)
- KVOD (90.1 FM; DENVER, CO; Owner: PUBLIC BROADCASTING OF COLORADO, INC)
- KXKL-FM (105.1 FM; DENVER, CO; Owner: INFINITY RADIO OPERATIONS INC.)
- KRKS-FM (94.7 FM; LAFAYETTE, CO; Owner: SALEM MEDIA OF COLORADO, INC)
- KLDV (91.1 FM; MORRISON, CO; Owner: EDUCATIONAL MEDIA FOUNDATION)
- KYGO-FM (98.5 FM; DENVER, CO; Owner: JEFFERSON-PILOT COMMUNICATIONS COMPANY OF COLORADO)
- KXPK (96.5 FM; EVERGREEN, CO; Owner: ENTRAVISION HOLDINGS, LLC)
- KJMN (92.1 FM; CASTLE ROCK, CO; Owner: ENTRAVISION HOLDINGS, LLC)
TV broadcast stations around Commerce City:
- KMGH-TV (Channel 7; DENVER, CO; Owner: MCGRAW-HILL BROADCASTING COMPANY, INC.)
- KRMA-TV (Channel 6; DENVER, CO; Owner: ROCKY MOUNTAIN PUBLIC BROADCASTING NETWORK, INC.)
- K48FW (Channel 48; DENVER, CO; Owner: TRINITY BROADCASTING NETWORK)
- KDEN (Channel 25; LONGMONT, CO; Owner: LONGMONT CHANNEL 25, INC.)
- KUSA-TV (Channel 9; DENVER, CO; Owner: MULTIMEDIA HOLDINGS CORPORATION)
- KDEO-LP (Channel 38; AURORA, CO; Owner: PETER B. VAN DE SANDE)
- KTVD (Channel 20; DENVER, CO; Owner: TWENVER BROADCAST, INC.)
- KCNC-TV (Channel 4; DENVER, CO; Owner: CBS TELEVISION STATIONS INC.)
- K66FB (Channel 66; DENVER, CO; Owner: TRINITY BROADCASTING NETWORK)
- KDEV-LP (Channel 62; AURORA, CO; Owner: TIGER EYE BROADCASTING CORPORATION)
- KWGN-TV (Channel 2; DENVER, CO; Owner: KWGN INC.)
- KMAS-LP (Channel 63; DENVER, CO; Owner: TELEMUNDO OF STEAMBOAT SPRINGS COLO. LIC. CORP.)
- KDVR (Channel 31; DENVER, CO; Owner: FOX TELEVISION STATIONS, INC.)
- KPXC-TV (Channel 59; DENVER, CO; Owner: PAXSON DENVER LICENSE, INC.)
- National Bridge Inventory (NBI) Statistics
- 119Number of bridges
- 1,775ft / 541mTotal length
- $51,324,000Total costs
- 2,301,580Total average daily traffic
- 265,658Total average daily truck traffic
- New bridges - historical statistics
- 51940-1949
- 41950-1959
- 141960-1969
- 111970-1979
- 61980-1989
- 301990-1999
- 352000-2009
- 132010-2019
- 12020-2022
| Home Mortgage Disclosure Act Aggregated Statistics For Year 2009 (Based on 3 full and 7 partial tracts) | ||||||||||||||
| A) FHA, FSA/RHS & VA Home Purchase Loans | B) Conventional Home Purchase Loans | C) Refinancings | D) Home Improvement Loans | E) Loans on Dwellings For 5+ Families | F) Non-occupant Loans on < 5 Family Dwellings (A B C & D) | G) Loans On Manufactured Home Dwelling (A B C & D) | ||||||||
|---|---|---|---|---|---|---|---|---|---|---|---|---|---|---|
| Number | Average Value | Number | Average Value | Number | Average Value | Number | Average Value | Number | Average Value | Number | Average Value | Number | Average Value | |
| LOANS ORIGINATED | 476 | $161,108 | 166 | $121,988 | 586 | $189,438 | 28 | $43,525 | 1 | $40,000 | 81 | $97,249 | 10 | $67,344 |
| APPLICATIONS APPROVED, NOT ACCEPTED | 33 | $159,934 | 11 | $151,614 | 84 | $185,948 | 5 | $48,104 | 0 | $0 | 6 | $182,578 | 0 | $0 |
| APPLICATIONS DENIED | 75 | $160,567 | 46 | $143,327 | 257 | $174,922 | 37 | $32,823 | 0 | $0 | 39 | $118,875 | 7 | $76,209 |
| APPLICATIONS WITHDRAWN | 41 | $149,361 | 24 | $131,356 | 163 | $182,819 | 6 | $83,438 | 0 | $0 | 14 | $96,803 | 1 | $51,810 |
| FILES CLOSED FOR INCOMPLETENESS | 4 | $127,052 | 8 | $119,015 | 67 | $173,887 | 2 | $145,325 | 0 | $0 | 4 | $84,015 | 1 | $49,040 |
Detailed HMDA statistics for the following Tracts: 0085.12 , 0085.23, 0087.03, 0087.05, 0087.06, 0088.01, 0088.02, 0089.01
| Private Mortgage Insurance Companies Aggregated Statistics For Year 2009 (Based on 3 full and 4 partial tracts) | ||||||
| A) Conventional Home Purchase Loans | B) Refinancings | C) Non-occupant Loans on < 5 Family Dwellings (A & B) | ||||
|---|---|---|---|---|---|---|
| Number | Average Value | Number | Average Value | Number | Average Value | |
| LOANS ORIGINATED | 24 | $187,467 | 21 | $206,445 | 1 | $222,540 |
| APPLICATIONS APPROVED, NOT ACCEPTED | 21 | $171,081 | 8 | $280,749 | 1 | $250,420 |
| APPLICATIONS DENIED | 8 | $145,042 | 8 | $207,170 | 0 | $0 |
| APPLICATIONS WITHDRAWN | 4 | $196,038 | 2 | $241,735 | 0 | $0 |
| FILES CLOSED FOR INCOMPLETENESS | 1 | $285,170 | 1 | $125,370 | 0 | $0 |
Detailed PMIC statistics for the following Tracts: 0085.12 , 0085.23, 0087.03, 0087.05, 0087.06, 0088.01, 0088.02, 0089.01
2003 - 2018 National Fire Incident Reporting System (NFIRS) incidents
- Fire incident types reported to NFIRS in Commerce City, CO
- 48836.8%Structure Fires
- 46435.0%Outside Fires
- 31023.4%Mobile Property/Vehicle Fires
- 634.8%Other
 According to the data from the years 2003 - 2018 the average number of fire incidents per year is 83. The highest number of reported fire incidents - 154 took place in 2004, and the least - 9 in 2007. The data has a growing trend.
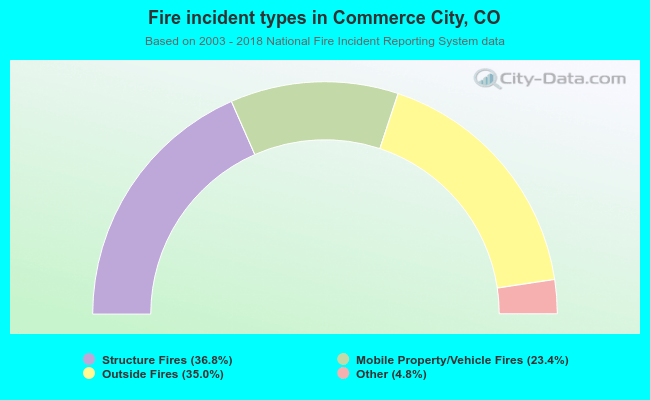 When looking into fire subcategories, the most reports belonged to: Structure Fires (36.8%), and Outside Fires (35.0%).
| Most common first names in Commerce City, CO among deceased individuals | ||
| Name | Count | Lived (average) |
|---|---|---|
| John | 134 | 72.2 years |
| William | 108 | 74.3 years |
| Mary | 100 | 75.1 years |
| Robert | 90 | 69.2 years |
| James | 74 | 70.6 years |
| George | 70 | 71.6 years |
| Charles | 57 | 72.6 years |
| Frank | 47 | 69.3 years |
| Edward | 46 | 72.6 years |
| Joe | 41 | 70.2 years |
| Most common last names in Commerce City, CO among deceased individuals | ||
| Last name | Count | Lived (average) |
|---|---|---|
| Martinez | 55 | 70.4 years |
| Smith | 44 | 74.7 years |
| Miller | 43 | 73.3 years |
| Garcia | 38 | 73.5 years |
| Romero | 31 | 68.4 years |
| Johnson | 31 | 72.8 years |
| Medina | 26 | 67.8 years |
| Brown | 25 | 66.9 years |
| Davis | 23 | 75.3 years |
| Jones | 22 | 71.7 years |
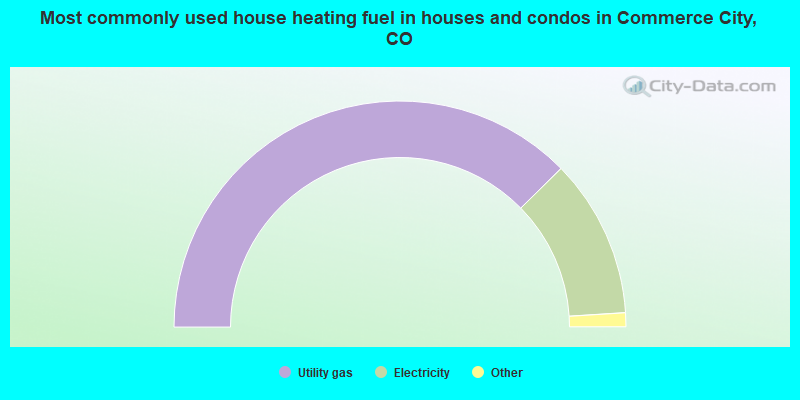
- 75.2%Utility gas
- 22.7%Electricity
- 0.8%Bottled, tank, or LP gas
- 0.7%Solar energy
- 0.2%Wood
- 0.2%No fuel used
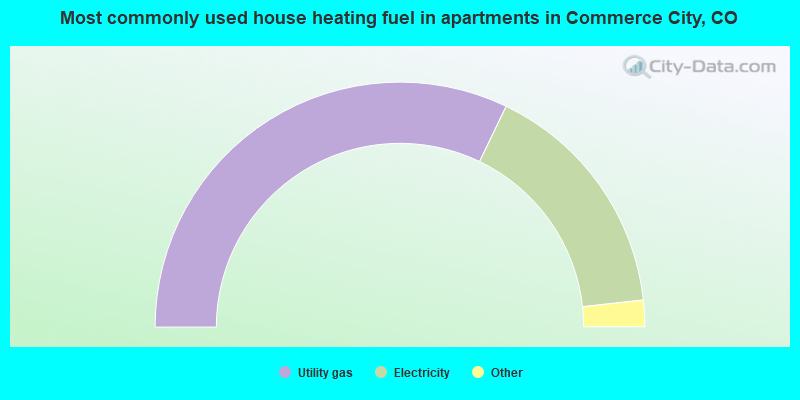
- 64.3%Utility gas
- 32.2%Electricity
- 2.2%Bottled, tank, or LP gas
- 0.9%No fuel used
- 0.4%Solar energy
Commerce City compared to Colorado state average:
- Unemployed percentage below state average.
- Hispanic race population percentage significantly above state average.
- Median age significantly below state average.
- Foreign-born population percentage significantly above state average.
- Length of stay since moving in below state average.
- House age below state average.
Commerce City on our top lists:
- #17 on the list of "Top 100 highest located cities (pop. 50,000+)"
- #21 on the list of "Top 100 fastest growing cities from 2000 to 2014 (pop. 50,000+)"
- #27 on the list of "Top 101 cities with the highest number of auto thefts per 100,000 residents, excludes tourist destinations and others with a lot of outsiders visiting based on city industries data (population 5,000+)"
- #56 on the list of "Top 100 low-educated but high-earning cities (pop. 50,000+)"
- #60 on the list of "Top 101 cities with the largest percentage population increase from 2000 (population 5,000+)"
- #67 on the list of "Top 100 cities with the largest percentage of males (pop. 50,000+)"
- #90 on the list of "Top 100 cities with highest median household income and median resident age less than 35 (pop. 50,000+)"
- #97 on the list of "Top 100 least-safe cities (highest city-data.com crime index) (pop. 50,000+)"
- #39 (80216) on the list of "Top 101 zip codes with the largest percentage of Scottish first ancestries (pop 5,000+)"
- #3 on the list of "Top 101 counties with the highest Nitrogen Dioxide air pollution readings in 2012 (ppm)"
- #24 on the list of "Top 101 counties with the highest carbon monoxide air pollution readings in 2012 (ppm)"
- #32 on the list of "Top 101 counties with the lowest percentage of residents that visited a dentist within the past year"
- #59 on the list of "Top 101 counties with the lowest percentage of residents relocating from foreign countries between 2010 and 2011 (pop. 50,000+)"
- #59 on the list of "Top 101 counties with the largest decrease in the number of infant deaths per 1000 residents 2000-2006 to 2007-2013 (pop. 50,000+)"

|
|
Total of 109 patent applications in 2008-2024.