Commerce City, CO (Colorado) Houses and Residents
| Commerce City: | $520,400 |
| Colorado: | $531,100 |
Mean price in 2022:
Detached houses: $546,623
Here: $546,623 State: $676,667 Townhouses or other attached units: $355,358
Here: $355,358 State: $526,340 In 3-to-4-unit structures: $510,609
Here: $510,609 State: $385,502 In 5-or-more-unit structures: $292,858
Here: $292,858 State: $417,586 Mobile homes: $39,890
Here: $39,890 State: $115,510
Total population: 51,762 (Urban population: 20,663, Rural population: 577 (all nonfarm))
Houses: 21,726 (20,917 occupied: 17,326 owner occupied, 3,591 renter occupied)
| % of renters here: | 17% |
| State: | 34% |
Housing density: 841 houses/condos per square mile
Median price asked for vacant for-sale houses and condos in 2022: $2,064,789.
Median contract rent in 2022: $1,047 (lower quartile is $669, upper quartile is $1,436)
Median rent asked for vacant for-rent units in 2022: $687
Median gross rent in Commerce City, CO in 2022: $1,119
Housing units in Commerce City with a mortgage: 13,581 (1,279 second mortgage, 0 home equity loan, 939 both second mortgage and home equity loan)
Houses without a mortgage: 65
Median household income for houses/condos with a mortgage: $128,009
Median household income for apartments without a mortgage: $91,801
Median monthly housing costs: $1,994
Compare current foreclosures in Commerce City, CO:
| Photo | Address | Area | Beds / Baths | Price | Details |
|---|---|---|---|---|---|

|
#1
E 62nd Pl
Commerce City, CO 80022
|
1,429 sq. feet
|
2 baths 3 beds |
show details | |

|
#2
Sedalia St
Commerce City, CO 80022
|
2,138 sq. feet
|
2 baths 3 beds |
show details | |

|
#3
E 96th Way Unit 30b
Commerce City, CO 80022
|
1,216 sq. feet
|
2 baths 2 beds |
show details | |

|
#4
Niagara St
Commerce City, CO 80022
|
1,092 sq. feet
|
1 baths 4 beds |
show details | |

|
#5
E 98th Pl
Commerce City, CO 80022
|
2,771 sq. feet
|
2 baths 4 beds |
show details | |

|
#6
E 113th Ave
Commerce City, CO 80022
|
1,820 sq. feet
|
2 baths 2 beds |
show details | |

|
#7
Leyden Ln
Commerce City, CO 80022
|
720 sq. feet
|
1 baths 2 beds |
show details | |

|
#8
Chambers Dr
Commerce City, CO 80022
|
2,026 sq. feet
|
2 baths 4 beds |
show details | |

|
#9
Quintero St
Commerce City, CO 80022
|
2,633 sq. feet
|
2 baths 3 beds |
show details | |

|
#10
Magnolia St
Commerce City, CO 80022
|
1,032 sq. feet
|
1 baths 3 beds |
show details |
| Photo | Address | Area | Beds / Baths | Price | Details |
|---|---|---|---|---|---|

|
#11
E 75th Pl
Commerce City, CO 80022
|
1,624 sq. feet
|
1 baths 3 beds |
show details | |

|
#12
E 106th Ave
Commerce City, CO 80022
|
2,786 sq. feet
|
3 baths 7 beds |
show details | |

|
#13
Lewiston St
Commerce City, CO 80022
|
1,571 sq. feet
|
2 baths 4 beds |
show details | |

|
#14
Richfield Cir
Commerce City, CO 80022
|
1,841 sq. feet
|
2 baths 3 beds |
show details | |

|
#15
E 77th Pl
Commerce City, CO 80022
|
672 sq. feet
|
1 baths 2 beds |
show details | |

|
#16
Chambers Dr
Commerce City, CO 80022
|
4,205 sq. feet
|
3 baths 2 beds |
show details | |

|
#17
Pontiac St
Commerce City, CO 80022
|
1,250 sq. feet
|
1 baths 2 beds |
show details | |

|
#18
Granby Dr
Commerce City, CO 80022
|
3,455 sq. feet
|
2 baths 4 beds |
show details | |

|
#19
Nucla St
Commerce City, CO 80022
|
2,004 sq. feet
|
3 baths 3 beds |
show details | |

|
#20
Danube St
Commerce City, CO 80022
|
1,801 sq. feet
|
2 baths 3 beds |
show details |
| Photo | Address | Area | Beds / Baths | Price | Details |
|---|---|---|---|---|---|

|
#21
Holly St
Commerce City, CO 80022
|
1,277 sq. feet
|
1 baths 3 beds |
show details | |

|
#22
Norfolk St
Commerce City, CO 80022
|
2,060 sq. feet
|
2 baths 4 beds |
show details | |

|
#23
E 78th Pl
Commerce City, CO 80022
|
1,104 sq. feet
|
1 baths 3 beds |
show details | |

|
#24
Xanadu St
Commerce City, CO 80022
|
2,116 sq. feet
|
2 baths 3 beds |
show details | |

|
#25
E 67th Pl
Commerce City, CO 80022
|
980 sq. feet
|
1 baths 3 beds |
show details | |

|
#26
Carson Way
Commerce City, CO 80022
|
2,388 sq. feet
|
2 baths 4 beds |
show details | |

|
#27
Unity Pkwy
Commerce City, CO 80022
|
3,286 sq. feet
|
3 baths 4 beds |
show details | |

|
#28
Victor St
Commerce City, CO 80022
|
2,206 sq. feet
|
3 baths 3 beds |
show details | |

|
#29
Telluride St
Commerce City, CO 80022
|
2,351 sq. feet
|
1 baths 3 beds |
show details | |

|
#30
Pontiac St
Commerce City, CO 80022
|
696 sq. feet
|
1 baths 2 beds |
show details |
| Photo | Address | Area | Beds / Baths | Price | Details |
|---|---|---|---|---|---|

|
#31
E 104th Pl
Commerce City, CO 80022
|
2,219 sq. feet
|
2 baths 3 beds |
show details | |

|
#32
Jasmine St
Commerce City, CO 80022
|
1,736 sq. feet
|
2 baths 3 beds |
show details | |

|
#33
E 104th Way
Commerce City, CO 80022
|
2,219 sq. feet
|
2 baths 4 beds |
show details | |

|
#34
Poplar St
Commerce City, CO 80022
|
1,768 sq. feet
|
2 baths 3 beds |
show details | |

|
#35
Hollywood St
Commerce City, CO 80022
|
816 sq. feet
|
1 baths 2 beds |
show details | |

|
#36
E 106th Dr
Commerce City, CO 80022
|
1,928 sq. feet
|
2 baths 3 beds |
show details | |

|
#37
E 105th Pl
Commerce City, CO 80022
|
1,572 sq. feet
|
3 baths 3 beds |
show details | |

|
#38
E 112th Ave Unit 28e
Commerce City, CO 80022
|
2,473 sq. feet
|
4 baths 2 beds |
show details | |

|
#39
E 62nd Pl
Commerce City, CO 80022
|
1,209 sq. feet
|
2 baths 3 beds |
show details | |

|
#40
E 96th Pl
Commerce City, CO 80022
|
1,484 sq. feet
|
3 baths 2 beds |
show details |
| Photo | Address | Area | Beds / Baths | Price | Details |
|---|---|---|---|---|---|

|
#41
Fraser St
Commerce City, CO 80022
|
3,455 sq. feet
|
3 baths 4 beds |
show details | |

|
#42
Poplar St
Commerce City, CO 80022
|
- sq. feet
|
1 baths 3 beds |
show details | |

|
#43
E 77th Ave
Commerce City, CO 80022
|
1,285 sq. feet
|
1 baths 3 beds |
show details | |

|
#44
Jasper St
Commerce City, CO 80022
|
3,270 sq. feet
|
3 baths 4 beds |
show details | |

|
#45
Fraser St
Commerce City, CO 80022
|
2,450 sq. feet
|
2 baths 4 beds |
show details | |

|
#46
E 106th Way
Commerce City, CO 80022
|
2,608 sq. feet
|
2 baths 3 beds |
show details | |

|
#47
Joliet Cir
Commerce City, CO 80022
|
1,703 sq. feet
|
3 baths 3 beds |
show details | |

|
#48
Laredo Dr
Commerce City, CO 80022
|
1,655 sq. feet
|
2 baths 3 beds |
show details | |

|
#49
E 117th Ave
Commerce City, CO 80022
|
2,364 sq. feet
|
2 baths 4 beds |
show details | |

|
Check over 1 million property listings on Foreclosure.com!
|
browse all offers | |||


 | Good apartments near Commerce City (5 replies) |
| Aurora - good areas to buy home -- and areas to avoid (20 replies) |
| The average home in metro Denver costs $540,624. Here's what that gets you. (158 replies) |
| COVID-19 General Colorado Thread (845 replies) |
| Stapleton - New Town Builders vs. David Weekley Homes (65 replies) |
| Need Help w/Area to Move To (Neighborhoods, Schools, Etc) (25 replies) |

Median year apartment built: 1992
Household type by relationship:
Households: 66,116- Male householders: 11,851 (1,002 living alone), Female householders: 9,066 (1,108 living alone)
13,363 spouses (13,363 opposite-sex spouses), 1,075 unmarried partners, (1,024 opposite-sex unmarried partners), 23,048 children (21,726 natural, 235 adopted, 1,087 stepchildren), 2,618 grandchildren, 767 brothers or sisters, 1,249 parents, 0 foster children, 1,691 other relatives, 1,059 non-relatives
- In group quarters: 329
Size of family households: 6,797 2-persons, 4,087 3-persons, 3,927 4-persons, 1,937 5-persons, 218 6-persons, 1,112 7-or-more-persons.
Size of nonfamily households: 2,110 1-person, 633 2-persons, 96 3-persons.
13,595 married couples with children.
4,031 single-parent households (1,374 men, 2,657 women).
67.6% of residents of Commerce City speak English at home.
27.0% of residents speak Spanish at home (60% speak English very well, 21% speak English well, 12% speak English not well, 7% don't speak English at all).
2.8% of residents speak other Indo-European language at home (71% speak English very well, 23% speak English well, 4% speak English not well, 2% don't speak English at all).
1.5% of residents speak Asian or Pacific Island language at home (56% speak English very well, 19% speak English well, 26% speak English not well).
0.6% of residents speak other language at home (56% speak English very well, 23% speak English well, 9% speak English not well, 12% don't speak English at all).
Foreign born population: 11,207 (17.0%)
(49.7% of them are naturalized citizens)
| Here: | 7.2 |
| State: | 6.8 |
| Here: | 4.4 |
| State: | 4.0 |

- Bedrooms in owner-occupied houses and condos in Commerce City, Colorado
- 96no bedroom
- 821 bedroom
- 1,6062 bedrooms
- 7,6873 bedrooms
- 5,0274 bedrooms
- 2,8285+ bedrooms

- Bedrooms in renter-occupied apartments in Commerce City, Colorado
- 122no bedroom
- 6261 bedroom
- 1,3222 bedrooms
- 1,3313 bedrooms
- 1904 bedrooms
- 05+ bedrooms

- Cars and other vehicles available in Commerce City in owner-occupied houses/condos
- 657no vehicle
- 2,1651 vehicle
- 8,7252 vehicles
- 3,0153 vehicles
- 1,8484 vehicles
- 9165+ vehicles

- Cars and other vehicles available in Commerce City in renter-occupied apartments
- 976no vehicle
- 8611 vehicle
- 1,2552 vehicles
- 2823 vehicles
- 954 vehicles
- 1225+ vehicles

- Rooms in owner-occupied houses in Commerce City, Colorado
- 961 room
- 02 rooms
- 2043 rooms
- 1,8404 rooms
- 1,9105 rooms
- 2,9766 rooms
- 2,5097 rooms
- 3,7078 rooms
- 4,0849+ rooms

- Rooms in renter-occupied apartments in Commerce City, Colorado
- 1221 room
- 4212 rooms
- 4923 rooms
- 8484 rooms
- 4865 rooms
- 4956 rooms
- 07 rooms
- 5818 rooms
- 1469+ rooms


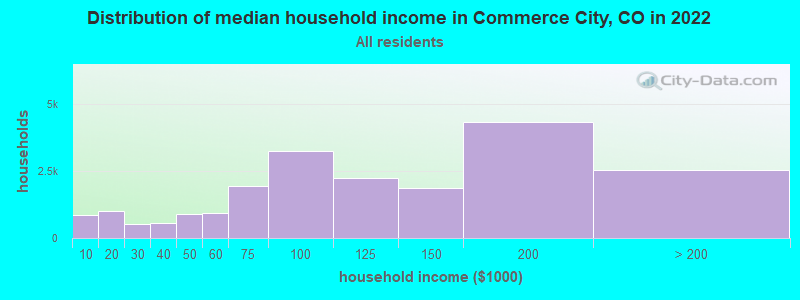
Commerce City, CO household income distribution

- 874Less than $10,000
- 990$10,000 to $19,999
- 512$20,000 to $29,999
- 560$30,000 to $39,999
- 913$40,000 to $49,999
- 933$50,000 to $59,999
- 1,924$60,000 to $74,999
- 3,255$75,000 to $99,999
- 2,243$100,000 to $124,999
- 1,856$125,000 to $149,999
- 4,332$150,000 to $199,999
- 2,525$200,000 or more
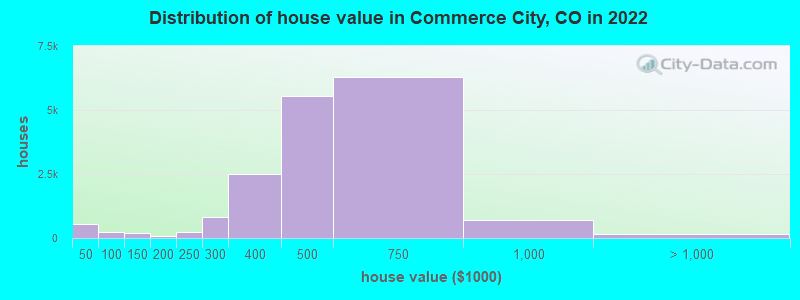
Home value of owner - occupied houses in 2022 in Commerce City, CO
-
- 204Less than $10,000
- 71$15,000 to $19,999
- 60$20,000 to $24,999
- 57$25,000 to $29,999
- 72$30,000 to $34,999
- 66$40,000 to $49,999
- 37$50,000 to $59,999
- 86$60,000 to $69,999
- 15$70,000 to $79,999
- 23$80,000 to $89,999
- 5$90,000 to $99,999
- 181$100,000 to $124,999
- 3$125,000 to $149,999
- 30$150,000 to $174,999
- 59$175,000 to $199,999
- 242$200,000 to $249,999
- 810$250,000 to $299,999
- 2,507$300,000 to $399,999
- 5,532$400,000 to $499,999
- 6,280$500,000 to $749,999
- 707$750,000 to $999,999
- 100$1,000,000 to $1,499,999
- 72$2,000,000 or more
Rent paid by renters in 2022 in Commerce City, CO
-
- 18$100 to $149
- 38$200 to $249
- 111$300 to $349
- 103$350 to $399
- 16$400 to $449
- 139$450 to $499
- 36$550 to $599
- 36$600 to $649
- 113$650 to $699
- 72$700 to $749
- 13$750 to $799
- 330$800 to $899
- 325$900 to $999
- 657$1,000 to $1,249
- 583$1,250 to $1,499
- 1,135$1,500 to $1,999
- 358$2,000 to $2,499
- 212$2,500 to $2,999
- 273$3,000 to $3,499
- 78No cash rent

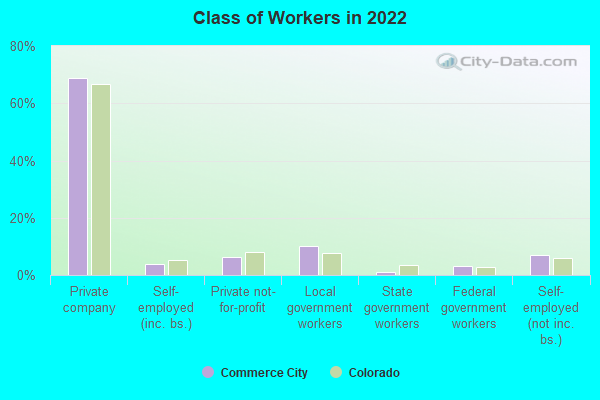
Percentage of workers working in this county: 56.3%
Number of people working at home: 6,271 (18.7% of all workers)
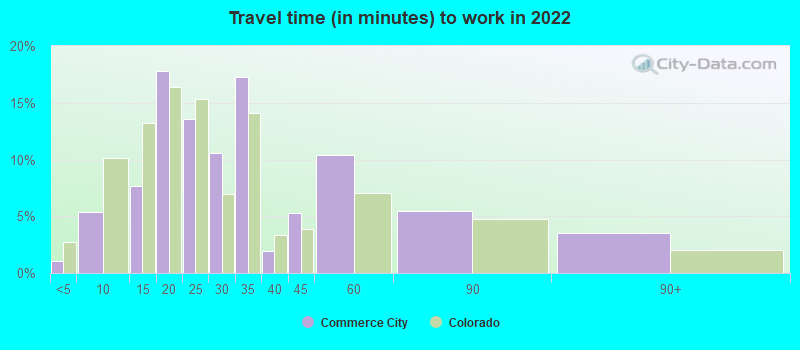
Travel time to work (commute)
- Less than 5 minutes: 214
- 5 to 9 minutes: 1,270
- 10 to 14 minutes: 1,657
- 15 to 19 minutes: 4,961
- 20 to 24 minutes: 4,772
- 25 to 29 minutes: 2,651
- 30 to 34 minutes: 5,131
- 35 to 39 minutes: 1,219
- 40 to 44 minutes: 816
- 45 to 59 minutes: 3,115
- 60 to 89 minutes: 1,215
- 90 or more minutes: 1,198
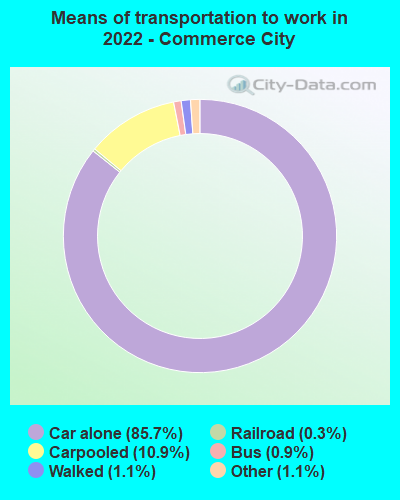
Means of transportation to work:
- Drove a car alone: 24,330 (69.8%)
- Carpooled: 3,286 (9.4%)
- Bus: 179 (0.5%)
- Subway or elevated rail: 8 (0.0%)
- Light rail, streetcar or trolley: 86 (0.2%)
- Taxi: 291 (0.8%)
- Walked: 269 (0.8%)
- Worked at home: 6,271 (18.0%)
- Unemployment by race in 2022
- Unemployment rate for White non-Hispanic residents
- 4.0%Males
- 4.3%Females
- Unemployment rate for Black residents
- 14.6%Females
- Unemployment rate for American Indian and Alaska Native residents
- 30.2%Females
- Unemployment rate for Asian residents
- 7.7%Males
- 4.2%Females
- Unemployment rate for other race residents
- 5.8%Males
- 8.3%Females
- Unemployment rate for two or more race residents
- 5.5%Males
- 4.7%Females
- Unemployment rate for Hispanic or Latino residents
- 2.6%Males
- 5.5%Females

- Year of entry for the foreign-born population in Commerce City, Colorado
- 1,9042010 or later
- 3,3072000 to 2009
- 2,7141990 to 1999
- 1,1771980 to 1989
- 3721970 to 1979
- 159Before 1970

First ancestries reported:
- American: 2,106 (6.5%)
- German: 1,892 (5.8%)
- English: 1,635 (5.0%)
- Irish: 1,200 (3.7%)
- European: 648 (2.0%)
- Norwegian: 470 (1.4%)
- Italian: 453 (1.4%)
- African: 422 (1.3%)
- Polish: 289 (0.9%)
- Jamaican: 211 (0.6%)
- Russian: 199 (0.6%)
- Ukrainian: 183 (0.6%)
- Dutch: 162 (0.5%)
- Swedish: 160 (0.5%)
- British: 140 (0.4%)
- Czech: 130 (0.4%)
- Scottish: 111 (0.3%)
- French: 92 (0.3%)
- Ghanaian: 89 (0.3%)
- Hungarian: 85 (0.3%)
- Scotch-Irish: 78 (0.2%)
- Somali: 57 (0.2%)
- Scandinavian: 52 (0.2%)
- French Canadian: 41 (0.1%)
- Maltese: 40 (0.1%)
- Canadian: 34 (0.1%)
- South African: 29 (0.09%)
- Portuguese: 28 (0.09%)
- Slovene: 27 (0.08%)
- Belgian: 26 (0.08%)
- Brazilian: 22 (0.07%)
- Basque: 20 (0.06%)
- Austrian: 17 (0.05%)
- Yugoslavian: 16 (0.05%)
- Czechoslovakian: 13 (0.04%)
- Pennsylvania German: 10 (0.03%)
- Moroccan: 8 (0.02%)
- Swiss: 5 (0.02%)
- Bahamian: 2 (0.01%)
Most common places of birth for foreign-born residents (%):
| Commerce City: | 65.1% (6,934) |
| Colorado: | 38.3% (209,491) |
| Commerce City: | 3.5% (369) |
| Colorado: | 0.3% (1,904) |
| Commerce City: | 2.3% (240) |
| Colorado: | 1.4% (7,860) |
| Commerce City: | 2.1% (225) |
| Colorado: | 1.1% (5,971) |
| Commerce City: | 1.9% (200) |
| Colorado: | 0.9% (4,810) |
| Commerce City: | 1.8% (188) |
| Colorado: | 0.9% (4,829) |
| Commerce City: | 1.7% (183) |
| Colorado: | 0.4% (1,940) |
| Commerce City: | 1.7% (176) |
| Colorado: | 2.2% (12,150) |
| Commerce City: | 1.6% (171) |
| Colorado: | 0.2% (1,172) |
| Commerce City: | 1.5% (160) |
| Colorado: | 2.9% (15,981) |
Place of birth for U.S.-born residents:
- This state: 33,961
- Other state: 20,188
- Northeast: 2,060
- Midwest: 5,348
- South: 5,975
- West: 6,805
88.7% of Commerce City residents lived in the same house 1 years ago.
Out of people who lived in different houses, 29.5% lived in this county.
Out of people who lived in different counties, 80.3% lived in Colorado.
| Commerce City: | 88.7% |
| State average: | 83.6% |
Education attainment for males 25 years and older:
- No schooling: 656
- Nursery to 4th grade: 293
- 5th and 6th grade: 558
- 7th and 8th grade: 175
- 9th grade: 815
- 10th grade: 290
- 11th grade: 185
- 12th grade, no diploma: 423
- High school graduate (or equivalency): 7,316
- Less than 1 year of college: 963
- Some college more than 1 year, no degree: 3,449
- Associate degree: 1,940
- Bachelor's degree: 2,639
- Master's degree: 514
- Professional school degree: 81
- Doctorate degree: 286

Education attainment for females 25 years and older:
- No schooling: 745
- Nursery to 4th grade: 89
- 5th and 6th grade: 677
- 7th and 8th grade: 0
- 9th grade: 453
- 10th grade: 586
- 11th grade: 304
- 12th grade, no diploma: 583
- High school graduate (or equivalency): 5,005
- Less than 1 year of college: 929
- Some college more than 1 year, no degree: 2,358
- Associate degree: 2,450
- Bachelor's degree: 4,029
- Master's degree: 1,770
- Professional school degree: 0
- Doctorate degree: 354


Housing units in structures:
- One, detached: 17,963
- One, attached: 1,985
- Two: 165
- 3 or 4: 349
- 5 to 9: 391
- 10 to 19: 670
- 20 to 49: 168
- 50 or more: 265
- Mobile homes: 431
House/condo owner moved in on average 6 years ago
Renter moved in on average 7 years ago

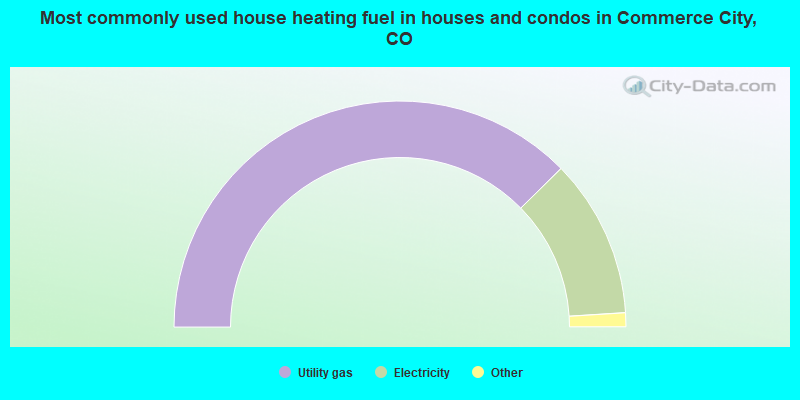
- 75.2%Utility gas
- 22.7%Electricity
- 0.8%Bottled, tank, or LP gas
- 0.7%Solar energy
- 0.2%Wood
- 0.2%No fuel used
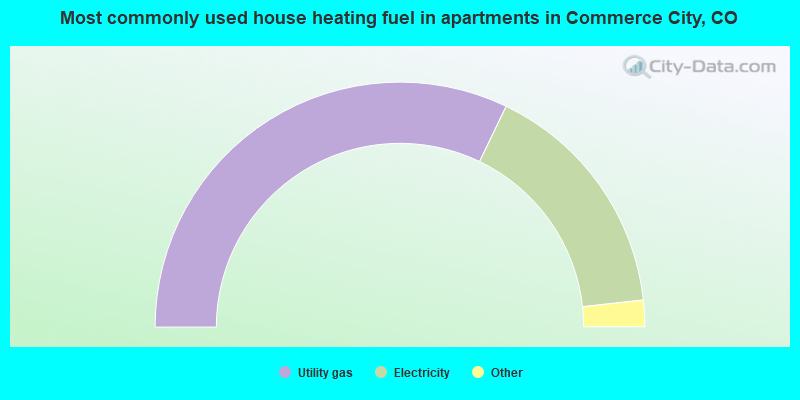
- 64.3%Utility gas
- 32.2%Electricity
- 2.2%Bottled, tank, or LP gas
- 0.9%No fuel used
- 0.4%Solar energy
Private vs. public school enrollment:
| Here: | 6.5% |
| Colorado: | 11.4% |
| Here: | 6.6% |
| Colorado: | 8.5% |
| Here: | 22.2% |
| Colorado: | 14.0% |


