Commerce City: Fire Incidents, Colorado (CO)
Where are fire incidents reported in Commerce City, CO
Something went wrong! Please refresh the page.
| Fire incidents reported | |
|---|---|
| Sreet name | Count |
| 60TH AVE | 106 |
| 88TH AVE | 104 |
| 104TH AVE | 78 |
| 72ND AVE | 70 |
| MONACO ST | 66 |
| INTERSTATE 76 | 64 |
| BRIGHTON BLVD | 62 |
| BRIGHTON RD | 62 |
| 64TH AVE | 50 |
| DAHLIA ST | 50 |
| STATE HIGHWAY 2 | 46 |
| TOWER RD | 46 |
| 56TH AVE | 44 |
| OLIVE ST | 42 |
| QUEBEC ST | 42 |
| KRAMERIA ST | 40 |
| 96TH AVE | 36 |
| ONEIDA ST | 34 |
| 112TH AVE | 30 |
| COLORADO BLVD | 30 |
| IVY ST | 30 |
| KEARNEY ST | 30 |
| 62ND AVE | 28 |
| MAGNOLIA ST | 28 |
| 74TH AVE | 26 |
| ROSEMARY ST | 26 |
| 80TH AVE | 24 |
| POPLAR ST | 24 |
| I-270 | 22 |
| LOCUST ST | 22 |
2003 - 2018 National Fire Incident Reporting System (NFIRS) incidents
- Incident types reported to NFIRS in Commerce City, CO
- 16,02069.5%Rescue & EMS
- 1,6677.2%Good Intent Call
- 1,5556.7%Hazardous Condition
- 1,3505.9%False Alarm
- 1,3255.7%Fire
- 1,0914.7%Service Call
- Fire incident types reported to NFIRS in Commerce City, CO
- 48836.8%Structure Fires
- 46435.0%Outside Fires
- 31023.4%Mobile Property/Vehicle Fires
- 634.8%Other
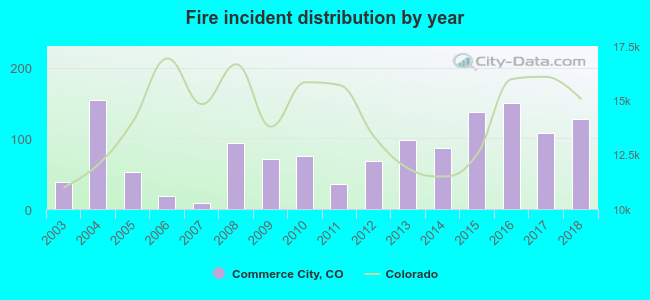 According to the data from the years 2003 - 2018 the average number of fire incidents per year is 83. The highest number of fire incidents - 154 took place in 2004, and the least - 9 in 2007. The data has a growing trend.
The average number of yearly fire incidents per 10k residents in Commerce City, CO compared to nearest cities:
(Note: Based on data for the last 3 years, including only cities with population 5,000 and above)
| Commerce City: | 24.8 |
| Welby: | 0.7 |
| Thornton: | 21.3 |
| Northglenn: | 25.4 |
| Federal Heights: | 36.4 |
| Westminster: | 19.6 |
| Denver: | 25.0 |
| Glendale: | 18.9 |
| Brighton: | 35.8 |
 The median response time based on all reported fire incidents is 5 minutes. This is lower compared to the Colorado median value.
The median response time in Commerce City, CO compared to nearest cities:
(Note: Based on data for all years, including only cities with at least 500 fire incidents)
| Commerce City: | 5 minutes |
| Thornton: | 7 minutes |
| Northglenn: | 6 minutes |
| Federal Heights: | 5 minutes |
| Westminster: | 5 minutes |
| Denver: | 4 minutes |
| Brighton: | 6 minutes |
| Broomfield: | 6 minutes |
| Aurora: | 6 minutes |
 Based on the data from the years 2003 - 2018 the average number of fire-related casualties per year is 1. The highest number of reported injuries - 6 took place in 2018, and the lowest - 0 in 2003. The data has an increasing trend.
The average number of injuries per 1,000 fire incidents is 11. This indicator was the highest - 47 in 2018, and the lowest 0 in 2003. The trend for casualties per 1,000 incidents is rising. Compared to the Colorado value the number of injuries per 1,000 fires is about the same.
Based on the data from the years 2003 - 2018 the average number of fire-related casualties per year is 1. The highest number of reported injuries - 6 took place in 2018, and the lowest - 0 in 2003. The data has an increasing trend.
The average number of injuries per 1,000 fire incidents is 11. This indicator was the highest - 47 in 2018, and the lowest 0 in 2003. The trend for casualties per 1,000 incidents is rising. Compared to the Colorado value the number of injuries per 1,000 fires is about the same.Casualties per 1,000 incidents in Commerce City, CO compared to nearest cities:
(Note: Based on data for all years, including only cities with at least 500 fire incidents)
| Commerce City: | 12.1 |
| Thornton: | 13.9 |
| Northglenn: | 9.4 |
| Federal Heights: | 21.2 |
| Westminster: | 34.0 |
| Denver: | 20.6 |
| Brighton: | 4.2 |
| Broomfield: | 11.7 |
| Aurora: | 10.6 |
 32.1% incidents where reported in the morning and 67.9% in the evening. The most fires (15.3%) took place on Sunday, and the least (13.0%) on Monday.
 According to the 1,325 fire incidents from years 2003 - 2018 most fires (14.1%) took place during July, and the least (6.5%) in October.
 Out of all 23,050 cases reported during the years 2003 - 2018, the most belonged to the categories: Rescue & EMS (69.5%), Good Intent Call (7.2%), and Hazardous Condition (6.7%).
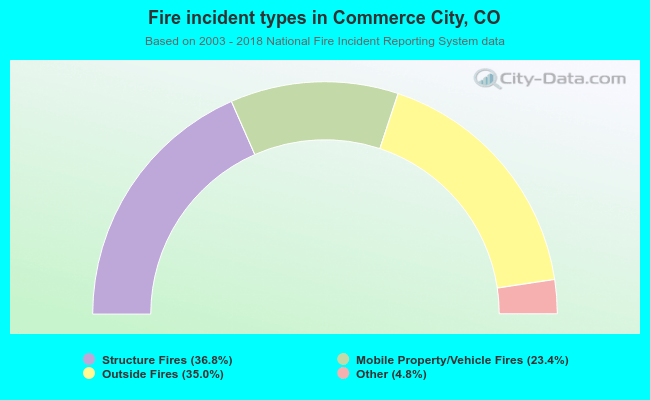 When looking into fire subcategories, the most incidents belonged to: Structure Fires (36.8%), and Outside Fires (35.0%).