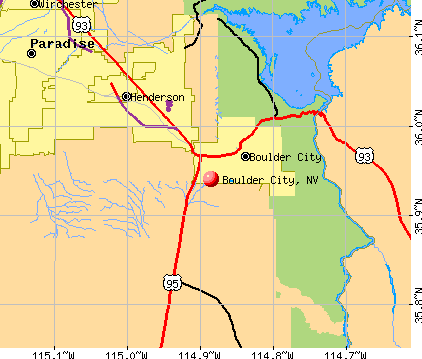
Boulder City, Nevada
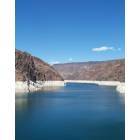
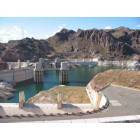
Boulder City: Lake Mead from Hoover Dam
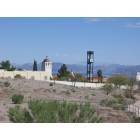
Boulder City: Church above Lake Mead
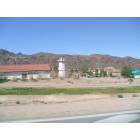
Boulder City: outskirts of Boulder City
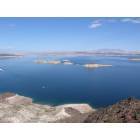
Boulder City: Looking down to Lake Mead
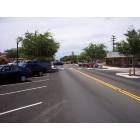
Boulder City: Boulder City Mainstreet
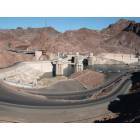
Boulder City: Hoover Dam looking towards Boulder City,NV
Boulder City: Hoover Dam, At Boulder City Nevada
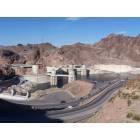
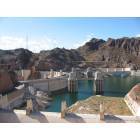
Boulder City: Hoover Dam
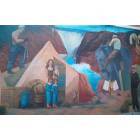
Boulder City: Downtown Mural
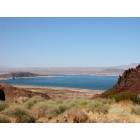
Boulder City: lake mead, boulder city, nv
Boulder City: Hoover Dam near Boulder Nevada
- see
24
more - add
your
Submit your own pictures of this city and show them to the world
- OSM Map
- General Map
- Google Map
- MSN Map
Population change since 2000: -0.5%
 |
| Males: 7,460 | |
| Females: 7,430 |
| Median resident age: | 51.8 years |
| Nevada median age: | 39.0 years |
| Boulder City: | $77,370 |
| NV: | $72,333 |
Estimated per capita income in 2022: $44,960 (it was $29,770 in 2000)
Boulder City city income, earnings, and wages data
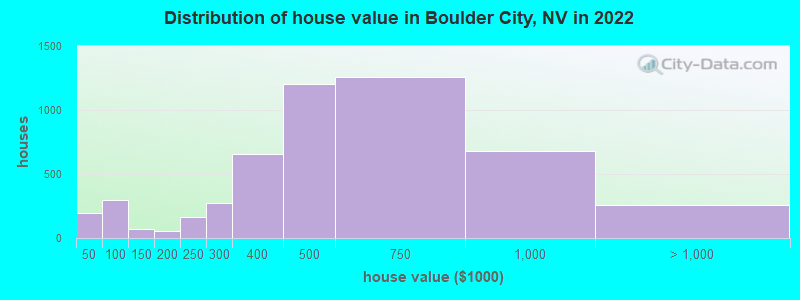
Estimated median house or condo value in 2022: $470,161 (it was $159,000 in 2000)
| Boulder City: | $470,161 |
| NV: | $434,700 |
Mean prices in 2022: all housing units: $593,269; detached houses: $751,408; townhouses or other attached units: $299,575; in 3-to-4-unit structures: $227,457; in 5-or-more-unit structures: $209,034; mobile homes: $100,297; occupied boats, rvs, vans, etc.: $205,347
Median gross rent in 2022: $1,332.
(9.7% for White Non-Hispanic residents, 17.8% for Black residents, 21.0% for Hispanic or Latino residents, 10.3% for American Indian residents, 19.7% for other race residents, 4.2% for two or more races residents)
Detailed information about poverty and poor residents in Boulder City, NV


Compare current foreclosures near Boulder City, NV:
| Photo | Address | Area | Beds / Baths | Price | Details |
|---|---|---|---|---|---|

|
#1
Fir St Apt 301
Boulder City, NV 89005
|
896 sq. feet
|
2 baths 2 beds |
show details | |

|
#2
Bronco Rd
Boulder City, NV 89005
|
1,967 sq. feet
|
3 baths 5 beds |
show details | |

|
#3
Avenue H # H
Boulder City, NV 89005
|
1,530 sq. feet
|
1 baths 3 beds |
show details | |

|
#4
Armada Pl
Boulder City, NV 89005
|
1,458 sq. feet
|
2 baths 4 beds |
show details | |

|
#5
Avenue L
Boulder City, NV 89005
|
- sq. feet
|
- baths - beds |
show details | |

|
#6
Buchanan Blvd Ste 115
Boulder City, NV 89005
|
- sq. feet
|
- baths - beds |
show details | |

|
#7
Avenue B Apt C
Boulder City, NV 89005
|
- sq. feet
|
- baths - beds |
show details | |

|
#8
Big Horn Dr
Boulder City, NV 89005
|
- sq. feet
|
- baths - beds |
show details | |

|
#9
Georgia Ave Apt C
Boulder City, NV 89005
|
- sq. feet
|
- baths - beds |
show details | |

|
#10
1/2 Avenue H
Boulder City, NV 89005
|
- sq. feet
|
- baths - beds |
show details |
| Photo | Address | Area | Beds / Baths | Price | Details |
|---|---|---|---|---|---|

|
#11
Forest Ln
Boulder City, NV 89005
|
- sq. feet
|
- baths - beds |
show details | |

|
#12
Avenue C
Boulder City, NV 89005
|
- sq. feet
|
- baths - beds |
show details | |

|
#13
Low Stakes Ct
Las Vegas, NV 89122
|
1,773 sq. feet
|
3 baths 3 beds |
$445,000
|
show details |

|
#14
Springville Way
Henderson, NV 89052
|
1,632 sq. feet
|
2 baths 2 beds |
$480,000
|
show details |

|
#15
Clark St
Las Vegas, NV 89122
|
1,750 sq. feet
|
4 baths 4 beds |
show details | |

|
#16
Sheer Paradise Ln Unit 1
Henderson, NV 89002
|
1,182 sq. feet
|
2 baths 2 beds |
show details | |

|
#17
Fieldbrook St
Henderson, NV 89052
|
1,336 sq. feet
|
2 baths 2 beds |
show details | |

|
#18
Gold Pan Ct
Las Vegas, NV 89183
|
1,886 sq. feet
|
3 baths 3 beds |
show details | |

|
#19
Blitzen Dr
Henderson, NV 89012
|
1,915 sq. feet
|
3 baths 4 beds |
show details | |

|
#20
Meadow Foxtail Dr
Las Vegas, NV 89122
|
1,601 sq. feet
|
2 baths 2 beds |
show details |
| Photo | Address | Area | Beds / Baths | Price | Details |
|---|---|---|---|---|---|

|
#21
Living Rose St
Las Vegas, NV 89123
|
1,179 sq. feet
|
2 baths 2 beds |
show details | |

|
#22
Via Panfilo Ave
Henderson, NV 89011
|
1,664 sq. feet
|
3 baths 2 beds |
show details | |

|
#23
Stone Dry Ave Unit 103
Henderson, NV 89011
|
1,553 sq. feet
|
3 baths 3 beds |
show details | |

|
#24
Ruby Slippers Ave
Las Vegas, NV 89183
|
1,582 sq. feet
|
2 baths 3 beds |
show details | |

|
#25
Village Arbor St
Las Vegas, NV 89183
|
1,718 sq. feet
|
3 baths 3 beds |
show details | |

|
#26
Bethany St
Henderson, NV 89074
|
2,951 sq. feet
|
3 baths 3 beds |
show details | |

|
#27
Blitzen Dr
Henderson, NV 89012
|
1,515 sq. feet
|
3 baths 3 beds |
show details | |

|
#28
Speyburn Ave
Henderson, NV 89044
|
2,379 sq. feet
|
3 baths 3 beds |
show details | |

|
#29
E Silverado Ranch Blvd Unit 2170
Las Vegas, NV 89183
|
1,089 sq. feet
|
2 baths 2 beds |
show details | |

|
#30
Sweeping Ivy Ct
Las Vegas, NV 89183
|
1,119 sq. feet
|
2 baths 3 beds |
show details |
| Photo | Address | Area | Beds / Baths | Price | Details |
|---|---|---|---|---|---|

|
#31
Sweeping Vine Ave
Las Vegas, NV 89183
|
1,429 sq. feet
|
3 baths 3 beds |
show details | |

|
#32
High Wager Way Unit 101
Las Vegas, NV 89122
|
1,218 sq. feet
|
2 baths 2 beds |
show details | |

|
#33
Clear Diamond Ave
Las Vegas, NV 89123
|
1,554 sq. feet
|
3 baths 3 beds |
show details | |

|
#34
Whispering Tree Ave
Las Vegas, NV 89183
|
3,922 sq. feet
|
4 baths 5 beds |
show details | |

|
#35
Grand Olympia Dr
Henderson, NV 89012
|
3,596 sq. feet
|
5 baths 5 beds |
show details | |

|
#36
E Silverado Ranch Blvd Unit 1079
Las Vegas, NV 89183
|
776 sq. feet
|
1 baths 1 beds |
show details | |

|
#37
Via Vannucci Way
Henderson, NV 89011
|
1,781 sq. feet
|
3 baths 4 beds |
show details | |

|
#38
Merano Ct
Las Vegas, NV 89123
|
2,436 sq. feet
|
3 baths 4 beds |
show details | |

|
#39
Baldurn Ave
Las Vegas, NV 89183
|
1,529 sq. feet
|
3 baths 3 beds |
show details | |

|
#40
Sun Valley Dr
Las Vegas, NV 89122
|
1,505 sq. feet
|
2 baths 3 beds |
show details |
| Photo | Address | Area | Beds / Baths | Price | Details |
|---|---|---|---|---|---|

|
#41
Summer Glow Ave
Henderson, NV 89012
|
1,621 sq. feet
|
3 baths 3 beds |
show details | |

|
#42
Mojave Ridge Ct
Las Vegas, NV 89183
|
1,467 sq. feet
|
3 baths 3 beds |
show details | |

|
#43
Castleton Tower Ct
Henderson, NV 89011
|
1,814 sq. feet
|
3 baths 3 beds |
show details | |

|
#44
Tree Bark St
Las Vegas, NV 89183
|
2,211 sq. feet
|
3 baths 2 beds |
show details | |

|
#45
Avenza Dr
Henderson, NV 89011
|
1,853 sq. feet
|
3 baths 3 beds |
show details | |

|
#46
Palmdesert Way
Las Vegas, NV 89120
|
2,065 sq. feet
|
2 baths 4 beds |
show details | |

|
#47
Robbers Roost Ave
Henderson, NV 89012
|
2,404 sq. feet
|
3 baths 4 beds |
show details | |

|
#48
Blanchard Dr
Henderson, NV 89074
|
1,562 sq. feet
|
2 baths 3 beds |
show details | |

|
#49
Merano Ct
Las Vegas, NV 89123
|
2,610 sq. feet
|
3 baths 5 beds |
show details | |

|
Check over 1 million property listings on Foreclosure.com!
|
browse all offers | |||


- 12,10979.4%White alone
- 1,4169.3%Hispanic
- 7374.8%Two or more races
- 2141.4%Black alone
- 1771.2%Asian alone
- 310.2%American Indian alone
- 20.01%Other race alone
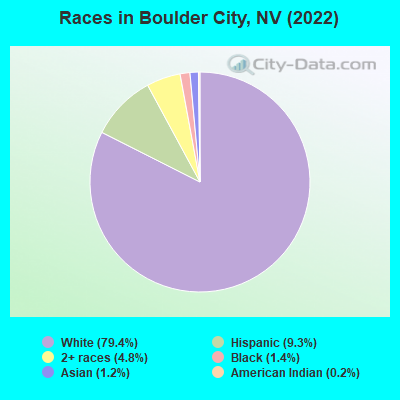
Races in Boulder City detailed stats: ancestries, foreign born residents, place of birth
According to our research of Nevada and other state lists, there were 43 registered sex offenders living in Boulder City, Nevada as of June 03, 2024.
The ratio of all residents to sex offenders in Boulder City is 372 to 1.
The ratio of registered sex offenders to all residents in this city is near the state average.
Type |
2009 |
2010 |
2011 |
2012 |
2013 |
2014 |
2015 |
2016 |
2017 |
2018 |
2019 |
2020 |
2021 |
2022 |
|---|---|---|---|---|---|---|---|---|---|---|---|---|---|---|
| Murders (per 100,000) | 0 (0.0) | 0 (0.0) | 0 (0.0) | 0 (0.0) | 2 (13.1) | 0 (0.0) | 0 (0.0) | 0 (0.0) | 0 (0.0) | 1 (6.2) | 1 (6.2) | 0 (0.0) | 0 (0.0) | 0 (0.0) |
| Rapes (per 100,000) | 0 (0.0) | 1 (6.7) | 1 (6.6) | 0 (0.0) | 4 (26.3) | 6 (39.4) | 1 (6.5) | 1 (6.4) | 3 (19.0) | 2 (12.4) | 2 (12.4) | 2 (12.2) | 5 (30.2) | 2 (13.5) |
| Robberies (per 100,000) | 2 (13.6) | 1 (6.7) | 2 (13.2) | 3 (19.5) | 1 (6.6) | 1 (6.6) | 2 (12.9) | 6 (38.3) | 0 (0.0) | 1 (6.2) | 3 (18.6) | 4 (24.5) | 2 (12.1) | 0 (0.0) |
| Assaults (per 100,000) | 11 (74.9) | 12 (79.9) | 11 (72.6) | 9 (58.6) | 15 (98.6) | 9 (59.1) | 10 (64.6) | 12 (76.6) | 6 (38.0) | 9 (55.9) | 13 (80.7) | 18 (110.1) | 21 (126.8) | 7 (47.1) |
| Burglaries (per 100,000) | 50 (340.5) | 49 (326.2) | 71 (468.6) | 94 (611.8) | 52 (341.7) | 37 (242.9) | 39 (251.9) | 60 (383.1) | 35 (221.5) | 50 (310.3) | 27 (167.7) | 26 (159.1) | 35 (211.4) | 31 (208.8) |
| Thefts (per 100,000) | 61 (415.4) | 53 (352.8) | 64 (422.4) | 117 (761.5) | 105 (689.9) | 82 (538.3) | 96 (620.1) | 91 (581.1) | 81 (512.5) | 81 (502.7) | 71 (440.9) | 84 (513.9) | 95 (573.8) | 106 (713.9) |
| Auto thefts (per 100,000) | 8 (54.5) | 18 (119.8) | 8 (52.8) | 7 (45.6) | 22 (144.6) | 19 (124.7) | 12 (77.5) | 13 (83.0) | 20 (126.6) | 16 (99.3) | 16 (99.4) | 30 (183.5) | 26 (157.0) | 22 (148.2) |
| Arson (per 100,000) | 2 (13.6) | 2 (13.3) | 2 (13.2) | 6 (39.1) | 2 (13.1) | 0 (0.0) | 0 (0.0) | 4 (25.5) | 2 (12.7) | 0 (0.0) | 0 (0.0) | 0 (0.0) | 1 (6.0) | 0 (0.0) |
| City-Data.com crime index | 63.9 | 69.8 | 77.7 | 94.5 | 132.1 | 93.8 | 70.6 | 88.6 | 68.9 | 85.2 | 81.4 | 85.5 | 103.5 | 75.2 |
The City-Data.com crime index weighs serious crimes and violent crimes more heavily. Higher means more crime, U.S. average is 246.1. It adjusts for the number of visitors and daily workers commuting into cities.
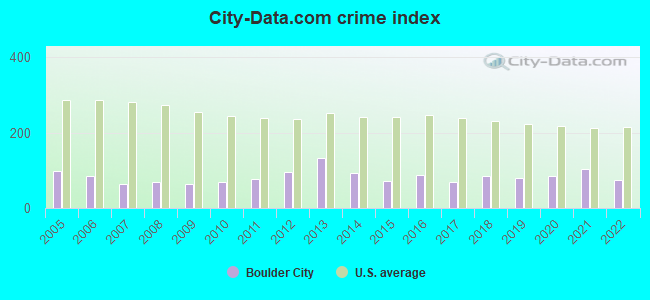
Crime rate in Boulder City detailed stats: murders, rapes, robberies, assaults, burglaries, thefts, arson
Full-time law enforcement employees in 2021, including police officers: 54 (37 officers - 34 male; 3 female).
| Officers per 1,000 residents here: | 2.23 |
| Nevada average: | 2.61 |
 Recent articles from our blog. Our writers, many of them Ph.D. graduates or candidates, create easy-to-read articles on a wide variety of topics.

 | Thoughts on Boulder City ? (20 replies) |
| Thinking About South Las Vegas (194 replies) |
| Boulder City vs Las Vegas (1 reply) |
| Interstate 11 (Boulder City Bypass) Is Open (23 replies) |
| Boulder City Post-Bypass Opening (0 replies) |
| COVID Shots in Clark County (146 replies) |
Latest news from Boulder City, NV collected exclusively by city-data.com from local newspapers, TV, and radio stations
Ancestries: English (15.4%), German (14.3%), Italian (9.1%), Irish (6.1%), Polish (3.5%), European (2.7%).
Current Local Time: PST time zone
Incorporated on 01/04/1960
Elevation: 2501 feet
Land area: 202.6 square miles.
Population density: 73 people per square mile (very low).
651 residents are foreign born (1.6% Europe, 1.3% Latin America, 1.3% Asia).
| This city: | 4.3% |
| Nevada: | 19.1% |
Median real estate property taxes paid for housing units with mortgages in 2022: $1,657 (0.3%)
Median real estate property taxes paid for housing units with no mortgage in 2022: $1,477 (0.4%)
Nearest city with pop. 50,000+: Henderson, NV  (10.0 miles , pop. 175,381).
Nearest city with pop. 200,000+: Las Vegas, NV (25.7 miles , pop. 478,434).
Nearest city with pop. 1,000,000+: Phoenix, AZ (230.9 miles , pop. 1,321,045).
Nearest cities:
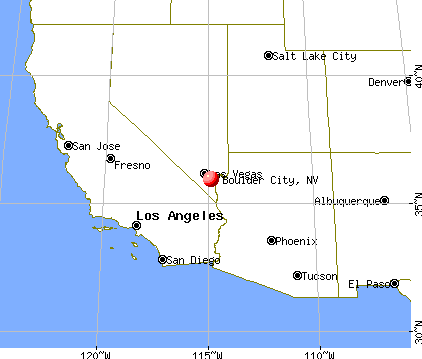
), ), Latitude: 35.94 N, Longitude: 114.89 W
Daytime population change due to commuting: -111 (-0.7%)
Workers who live and work in this city: 2,710 (45.7%)
Area code commonly used in this area: 702
Boulder City tourist attractions:
- Cascata Golf Course, Boulder City, Nevada ? a Rees Jones-Designed Golf Course That's Been Rated the #1 Facility in the Country
- Fortification Hill - Boulder City, Nevada - Extinct Volcano Overlooking Lake Mead
- Gold Strike Canyon Hot Springs - Boulder City, Nevada - Natural Hot Pools near Colorado River
- Lake Mead National Recreation Area Offers Vacation Fun
- Nevada Way - Boulder City, Nevada - Main Thoroughfare in a Quiet Town
- Red and Black Mountain Trail
- St. Jude's Children's Art Museum - Boulder City, Nevada - Art By, For and About Children
- Wilbur Square Park - Boulder City, Nevada - Historic Venue for Art Fairs and More
- Skydive Las Vegas - Boulder City, Nevada - Skydiving with Views of Lake Mead, Hoover Dam, and the Colorado River
Boulder City, Nevada accommodation & food services, waste management - Economy and Business Data
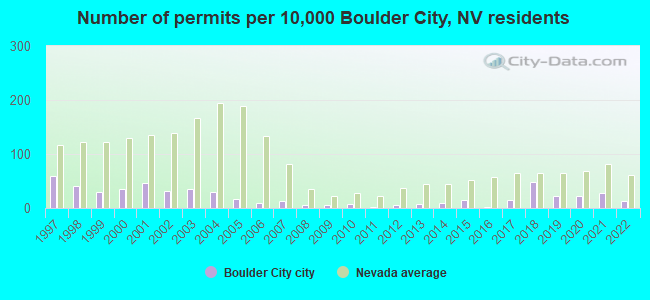
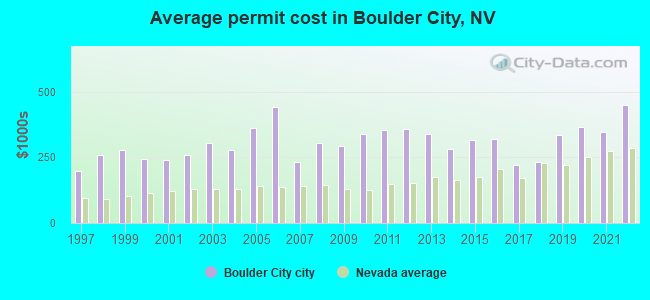
Single-family new house construction building permits:
- 2022: 20 buildings, average cost: $449,500
- 2021: 40 buildings, average cost: $347,200
- 2020: 34 buildings, average cost: $363,600
- 2019: 33 buildings, average cost: $334,300
- 2018: 74 buildings, average cost: $234,300
- 2017: 21 buildings, average cost: $220,600
- 2016: 3 buildings, average cost: $320,800
- 2015: 22 buildings, average cost: $317,100
- 2014: 15 buildings, average cost: $282,800
- 2013: 10 buildings, average cost: $340,100
- 2012: 9 buildings, average cost: $355,700
- 2011: 3 buildings, average cost: $353,100
- 2010: 11 buildings, average cost: $336,900
- 2009: 7 buildings, average cost: $292,900
- 2008: 9 buildings, average cost: $302,800
- 2007: 19 buildings, average cost: $233,200
- 2006: 13 buildings, average cost: $442,200
- 2005: 25 buildings, average cost: $363,100
- 2004: 45 buildings, average cost: $278,900
- 2003: 52 buildings, average cost: $302,900
- 2002: 46 buildings, average cost: $256,900
- 2001: 69 buildings, average cost: $239,800
- 2000: 52 buildings, average cost: $244,400
- 1999: 44 buildings, average cost: $276,000
- 1998: 60 buildings, average cost: $258,300
- 1997: 89 buildings, average cost: $199,000
| Here: | 5.3% |
| Nevada: | 5.0% |
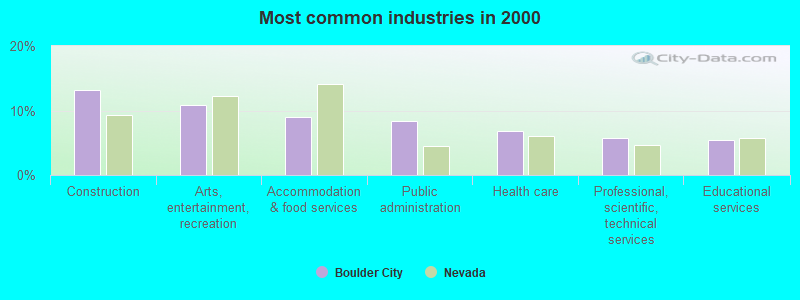
- Construction (13.2%)
- Arts, entertainment, recreation (10.8%)
- Accommodation & food services (8.9%)
- Public administration (8.4%)
- Health care (6.9%)
- Professional, scientific, technical services (5.7%)
- Educational services (5.5%)
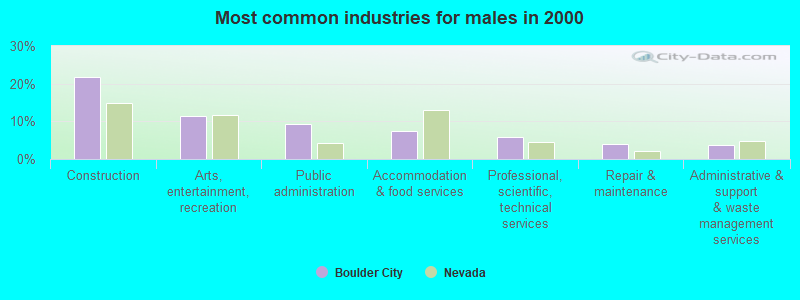
- Construction (21.8%)
- Arts, entertainment, recreation (11.4%)
- Public administration (9.4%)
- Accommodation & food services (7.3%)
- Professional, scientific, technical services (5.8%)
- Repair & maintenance (3.9%)
- Administrative & support & waste management services (3.7%)
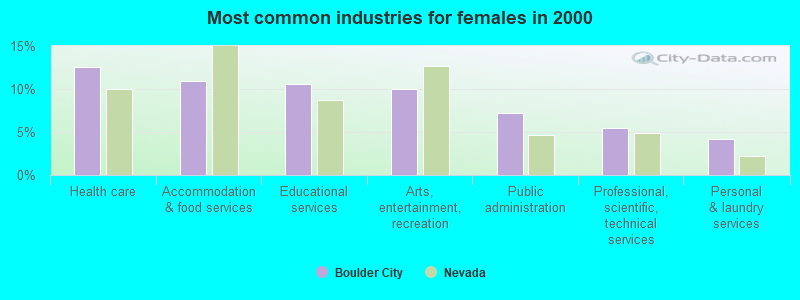
- Health care (12.6%)
- Accommodation & food services (10.9%)
- Educational services (10.6%)
- Arts, entertainment, recreation (10.1%)
- Public administration (7.2%)
- Professional, scientific, technical services (5.5%)
- Personal & laundry services (4.2%)
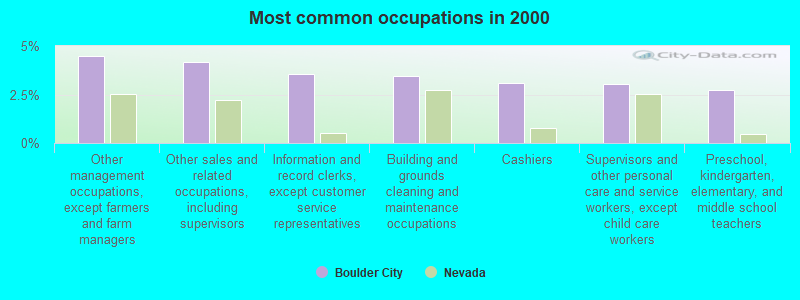
- Other management occupations, except farmers and farm managers (4.5%)
- Other sales and related occupations, including supervisors (4.2%)
- Information and record clerks, except customer service representatives (3.6%)
- Building and grounds cleaning and maintenance occupations (3.5%)
- Cashiers (3.1%)
- Supervisors and other personal care and service workers, except child care workers (3.0%)
- Preschool, kindergarten, elementary, and middle school teachers (2.7%)
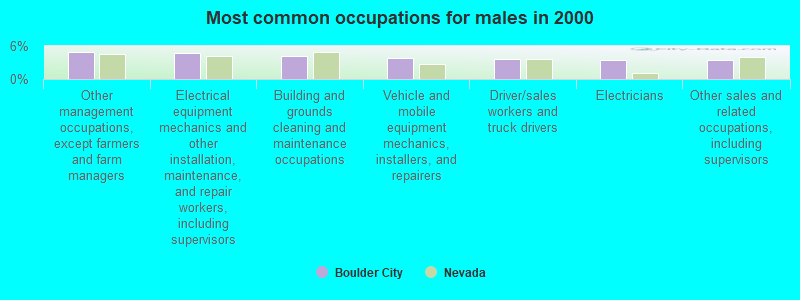
- Other management occupations, except farmers and farm managers (4.9%)
- Electrical equipment mechanics and other installation, maintenance, and repair workers, including supervisors (4.6%)
- Building and grounds cleaning and maintenance occupations (4.2%)
- Vehicle and mobile equipment mechanics, installers, and repairers (3.8%)
- Driver/sales workers and truck drivers (3.6%)
- Electricians (3.5%)
- Other sales and related occupations, including supervisors (3.4%)
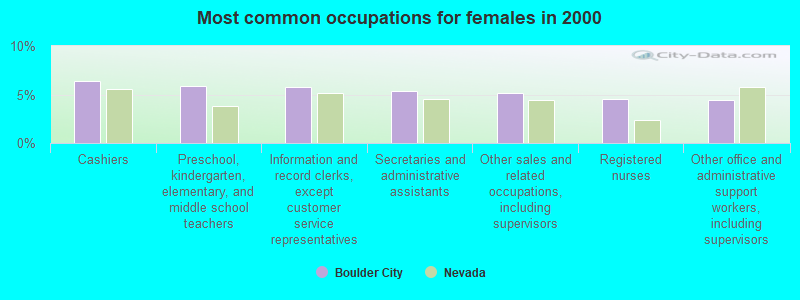
- Cashiers (6.4%)
- Preschool, kindergarten, elementary, and middle school teachers (5.9%)
- Information and record clerks, except customer service representatives (5.8%)
- Secretaries and administrative assistants (5.4%)
- Other sales and related occupations, including supervisors (5.1%)
- Registered nurses (4.5%)
- Other office and administrative support workers, including supervisors (4.4%)
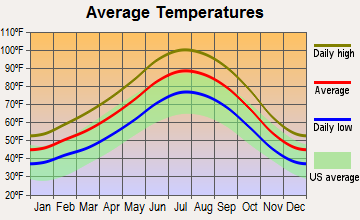
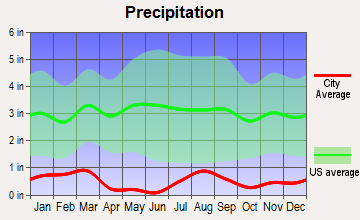
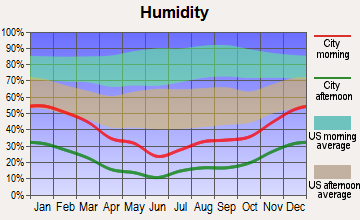
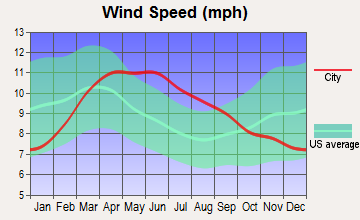
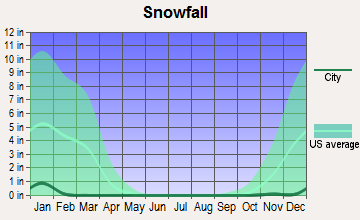
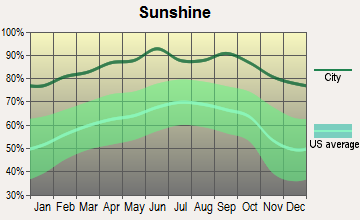
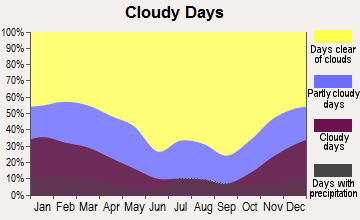
Average climate in Boulder City, Nevada
Based on data reported by over 4,000 weather stations
|
|

(lower is better)
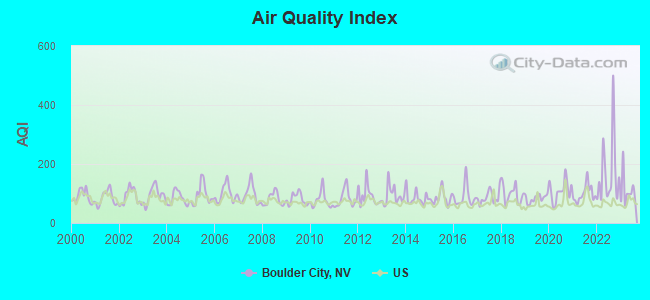
Air Quality Index (AQI) level in 2023 was 110. This is significantly worse than average.
| City: | 110 |
| U.S.: | 73 |
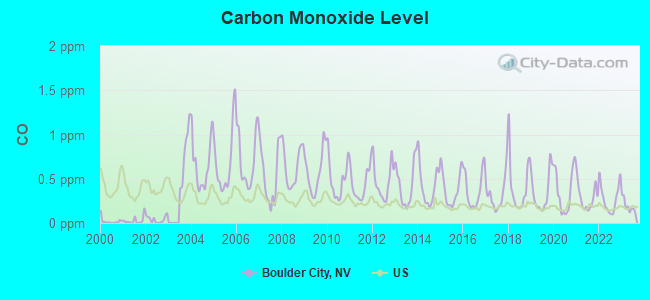
Carbon Monoxide (CO) [ppm] level in 2023 was 0.191. This is better than average. Closest monitor was 3.4 miles away from the city center.
| City: | 0.191 |
| U.S.: | 0.251 |
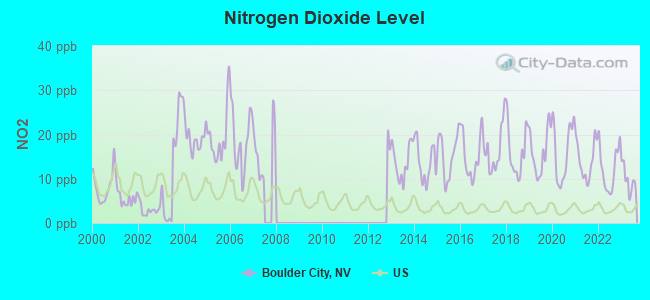
Nitrogen Dioxide (NO2) [ppb] level in 2023 was 9.85. This is significantly worse than average. Closest monitor was 3.4 miles away from the city center.
| City: | 9.85 |
| U.S.: | 5.11 |
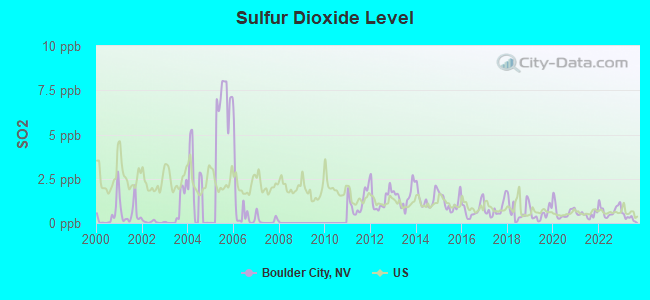
Sulfur Dioxide (SO2) [ppb] level in 2023 was 0.318. This is significantly better than average. Closest monitor was 3.4 miles away from the city center.
| City: | 0.318 |
| U.S.: | 1.515 |
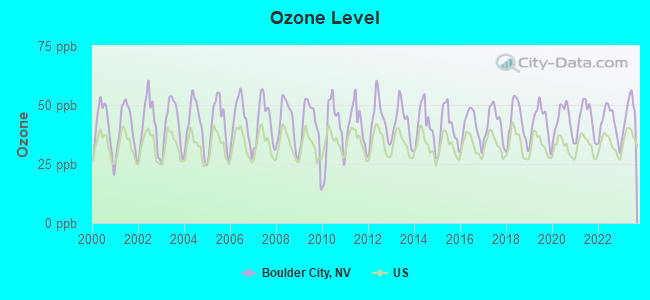
Ozone [ppb] level in 2023 was 46.8. This is significantly worse than average. Closest monitor was 3.4 miles away from the city center.
| City: | 46.8 |
| U.S.: | 33.3 |
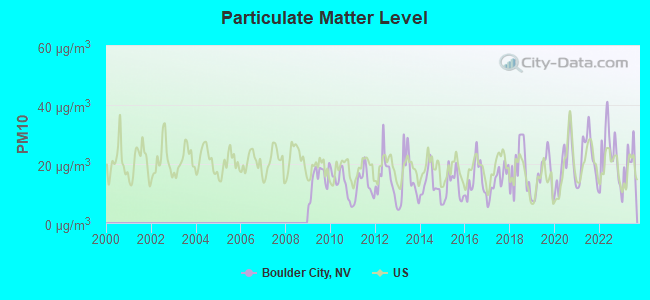
Particulate Matter (PM10) [µg/m3] level in 2023 was 19.0. This is about average. Closest monitor was 3.4 miles away from the city center.
| City: | 19.0 |
| U.S.: | 19.2 |
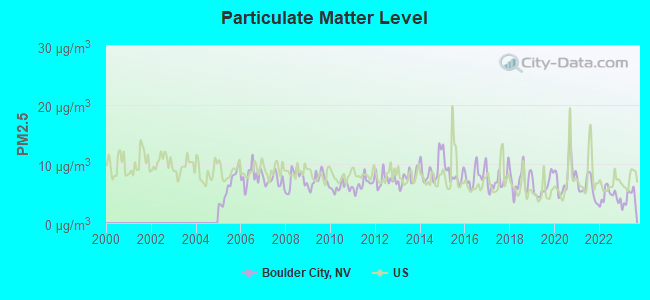
Particulate Matter (PM2.5) [µg/m3] level in 2023 was 4.24. This is significantly better than average. Closest monitor was 3.5 miles away from the city center.
| City: | 4.24 |
| U.S.: | 8.11 |
Earthquake activity:
Boulder City-area historical earthquake activity is significantly above Nevada state average. It is 5660% greater than the overall U.S. average.On 6/28/1992 at 11:57:34, a magnitude 7.6 (6.2 MB, 7.6 MS, 7.3 MW, Depth: 0.7 mi, Class: Major, Intensity: VIII - XII) earthquake occurred 153.1 miles away from the city center, causing 3 deaths (1 shaking deaths, 2 other deaths) and 400 injuries, causing $100,000,000 total damage and $40,000,000 insured losses
On 10/16/1999 at 09:46:44, a magnitude 7.4 (6.3 MB, 7.4 MS, 7.2 MW, 7.3 ML) earthquake occurred 131.8 miles away from Boulder City center
On 7/21/1952 at 11:52:14, a magnitude 7.7 (7.7 UK) earthquake occurred 240.7 miles away from the city center, causing $50,000,000 total damage
On 5/19/1940 at 04:36:40, a magnitude 7.2 (7.2 UK) earthquake occurred 193.6 miles away from the city center, causing $33,000,000 total damage
On 6/28/1992 at 15:05:30, a magnitude 6.9 (6.3 MB, 6.7 MS, 6.5 MW, 6.9 ME, Depth: 3.1 mi, Class: Strong, Intensity: VII - IX) earthquake occurred 158.1 miles away from Boulder City center
On 12/21/1932 at 06:10:09, a magnitude 7.2 (7.2 UK) earthquake occurred 250.2 miles away from the city center
Magnitude types: body-wave magnitude (MB), energy magnitude (ME), local magnitude (ML), surface-wave magnitude (MS), moment magnitude (MW)
Natural disasters:
The number of natural disasters in Clark County (12) is smaller than the US average (15).Major Disasters (Presidential) Declared: 4
Emergencies Declared: 3
Causes of natural disasters: Fires: 4, Floods: 3, Heavy Rains: 2, Snows: 2, Storms: 2, Flash Flood: 1, Hurricane: 1, Other: 1 (Note: some incidents may be assigned to more than one category).
Hospitals and medical centers in Boulder City:
- BOULDER CITY HOSPITAL (Voluntary non-profit - Private, provides emergency services, 901 ADAMS BLVD)
- BOULDER CITY HOSP HOME HEALTH (901 ADAMS BLVD)
- BOULDER CITY HOSPITAL SNF (901 ADAMS BLVD.)
- MOUNTAINVIEW CARE CENTER (601 ADAMS BOULEVARD)
- NEVADA STATE VETERANS HOME - BOULDER CITY (100 VETERANS MEMORIAL DR)
Airports and heliports located in Boulder City:
- Boulder City Municipal Airport (BVU) (Runways: 2, Air Taxi Ops: 64,296, Itinerant Ops: 6,570, Local Ops: 27,400, Military Ops: 496)
- Eldorado Substation Heliport (NV37)
Colleges/universities with over 2000 students nearest to Boulder City:
- Nevada State College (about 5 miles; Henderson, NV; Full-time enrollment: 2,346)
- University of Nevada-Las Vegas (about 19 miles; Las Vegas, NV; FT enrollment: 21,153)
- College of Southern Nevada (about 25 miles; Las Vegas, NV; FT enrollment: 18,996)
- Mohave Community College (about 67 miles; Kingman, AZ; FT enrollment: 3,309)
- Dixie State University (about 109 miles; Saint George, UT; FT enrollment: 6,485)
- Barstow Community College (about 142 miles; Barstow, CA; FT enrollment: 2,120)
- Southern Utah University (about 157 miles; Cedar City, UT; FT enrollment: 6,522)
Public high school in Boulder City:
- BOULDER CITY HIGH SCHOOL (Location: 1101 FIFTH ST., Grades: 9-12)
Public elementary/middle schools in Boulder City:
- ANDREW MITCHELL ELEMENTARY SCHOOL (Location: 900 AVE. B, Grades: PK-2)
- ELTON M GARRETT JUNIOR HIGH SCHOOL (Location: 1200 AVE. G, Grades: 6-8)
- MARTHA P KING ELEMENTARY SCHOOL (Location: 888 ADAMS BLVD, Grades: 1-5)
Private elementary/middle school in Boulder City:
User-submitted facts and corrections:
- christian center school is no longer in existence
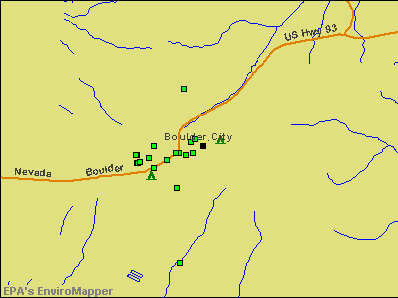
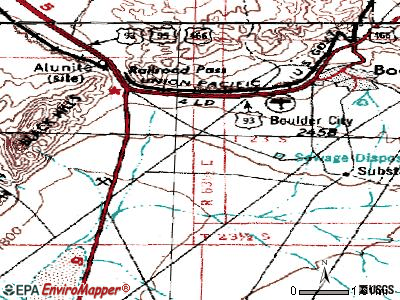
Points of interest:
Notable locations in Boulder City: Fredellen (A), Pumping Plant Number 5 (B), Boulder City Police Station (C), Boulder City Fire Department (D), Boulder City City Hall (E), Mercy Air Services 11 (F). Display/hide their locations on the map
Reservoirs: Mursha Reservoir (A), Dry Lake Reservoir (B), C C C Reservoir (C). Display/hide their locations on the map
Streams, rivers, and creeks: Bootleg Wash (A). Display/hide its location on the map
Tourist attractions: Boulder City Hoover Dam Museum (1305 Arizona Street) (1), Heliqwest (Ski & Helicopter Tours; 1100 Airport Road) (2), National Park Service (Recreation Areas; 502 Lakeshore Road) (3), Information Centers (100 Nevada Highway) (4), Black Canyon River Adventures (Tours & Charters; Highway 93) (5), Leading Edge Rotor Craft (Tours & Charters; 1201 Airport Road) (6). Display/hide their approximate locations on the map
Hotels: Flamingo Inn Boulder City (804 Nevada Highway) (1), Starview Motel of Boulder City (1017 Nevada Highway) (2), Best Western Lighthouse Inn (110 Ville Drive) (3), Nevada Inn (1009 Nevada Hwy) (4), Sands Motel of Boulder City (809 Nevada Highway) (5), Boulder City Super 8 Motel (704 Nevada Hwy) (6), Western Inn (921 Nevada Highway) (7), Desert Inn of Boulder City (800 Nevada Highway) (8), Hacienda Hotel & Casino (US 93 Highway) (9). Display/hide their approximate locations on the map
Birthplace of: Deanna Brooks - Film actor, G. Murray Snow - Federal judge, Kathy Evison - Actress.
Drinking water stations with addresses in Boulder City and their reported violations in the past:
BOULDER CITY (Population served: 15,000, Purch surface water):Past monitoring violations:HOOVER DAM (Address: HOOVER BUREAU OF RECLAMATION LCD 2300 , Population served: 3,000, Surface water):
- Initial Tap Sampling for Pb and Cu - In JAN-01-1993, Contaminant: Lead and Copper Rule. Follow-up actions: St Compliance achieved (FEB-09-2005)
Past health violations:NPS COTTONWOOD COVE (Population served: 1,354, Groundwater):
- MCL, Average - Between APR-2009 and JUN-2009, Contaminant: TTHM. Follow-up actions: St Violation/Reminder Notice (MAY-09-2008), St Public Notif requested (MAY-19-2008), St Public Notif received (JUL-13-2009), St Compliance achieved (AUG-27-2009)
- MCL, Average - Between JAN-2009 and MAR-2009, Contaminant: TTHM. Follow-up actions: St Violation/Reminder Notice (MAY-09-2008), St Public Notif requested (MAY-19-2008), St Public Notif received (APR-27-2009), St Compliance achieved (AUG-27-2009)
- MCL, Average - Between JUL-2008 and SEP-2008, Contaminant: TTHM. Follow-up actions: St Violation/Reminder Notice (MAY-09-2008), St Public Notif requested (MAY-19-2008), St Public Notif received (OCT-27-2008), St Compliance achieved (AUG-27-2009)
- MCL, Average - Between APR-2008 and JUN-2008, Contaminant: TTHM. Follow-up actions: St Violation/Reminder Notice (MAY-09-2008), St Public Notif requested (MAY-19-2008), St Compliance achieved (AUG-27-2009)
- MCL, Average - Between JAN-2008 and MAR-2008, Contaminant: TTHM. Follow-up actions: St Public Notif received (APR-09-2008), St Violation/Reminder Notice (MAY-09-2008), St Public Notif requested (MAY-19-2008), St Compliance achieved (AUG-27-2009)
- MCL, Average - Between OCT-2006 and DEC-2006, Contaminant: TTHM. Follow-up actions: St Public Notif requested (JAN-13-2007), St Violation/Reminder Notice (JAN-13-2007), St Public Notif received (JAN-19-2007), St Compliance achieved (JUL-25-2007)
Past monitoring violations:NPS BOULDER BEACH (Population served: 722, Purch surface water):
- 5 regular monitoring violations
Past health violations:NPS CALLVILLE BAY (Population served: 250, Surface water):Past monitoring violations:
- MCL, Average - Between JUL-2010 and SEP-2010, Contaminant: TTHM. Follow-up actions: St Public Notif requested (NOV-13-2008), St Violation/Reminder Notice (NOV-13-2008), St Public Notif received (OCT-06-2010), St Compliance achieved (DEC-10-2010)
- MCL, Average - Between APR-2010 and JUN-2010, Contaminant: TTHM. Follow-up actions: St Public Notif requested (NOV-13-2008), St Violation/Reminder Notice (NOV-13-2008), St Public Notif received (MAY-28-2010), St Compliance achieved (DEC-10-2010)
- MCL, Average - Between JAN-2010 and MAR-2010, Contaminant: TTHM. Follow-up actions: St Public Notif requested (NOV-13-2008), St Violation/Reminder Notice (NOV-13-2008), St Public Notif received (APR-28-2010), St Compliance achieved (DEC-10-2010)
- MCL, Average - Between OCT-2009 and DEC-2009, Contaminant: TTHM. Follow-up actions: St Public Notif requested (NOV-13-2008), St Violation/Reminder Notice (NOV-13-2008), St Public Notif received (DEC-11-2009), St Compliance achieved (DEC-10-2010)
- MCL, Average - Between JUL-2009 and SEP-2009, Contaminant: TTHM. Follow-up actions: St Public Notif requested (NOV-13-2008), St Violation/Reminder Notice (NOV-13-2008), St Public Notif received (SEP-18-2009), St Compliance achieved (DEC-10-2010)
- MCL, Average - Between APR-2009 and JUN-2009, Contaminant: TTHM. Follow-up actions: St Public Notif requested (NOV-13-2008), St Violation/Reminder Notice (NOV-13-2008), St Public Notif received (JUL-27-2009), St Compliance achieved (DEC-10-2010)
- 3 other older health violations
- Monitoring and Reporting (DBP) - Between APR-2006 and JUN-2006, Contaminant: Total Haloacetic Acids (HAA5). Follow-up actions: St Public Notif requested (DEC-21-2006), St Violation/Reminder Notice (DEC-21-2006), St Compliance achieved (MAR-30-2007)
- Monitoring and Reporting (DBP) - Between APR-2006 and JUN-2006, Contaminant: TTHM. Follow-up actions: St Public Notif requested (DEC-21-2006), St Violation/Reminder Notice (DEC-21-2006), St Compliance achieved (MAR-30-2007)
- Monitoring and Reporting (DBP) - Between JAN-2005 and MAR-2005, Contaminant: Total Haloacetic Acids (HAA5). Follow-up actions: St Public Notif requested (MAY-27-2005), St Violation/Reminder Notice (JUN-08-2005), St Compliance achieved (JUN-27-2005), St Public Notif received (JUN-27-2005), St Compliance achieved (SEP-16-2008)
- Monitoring and Reporting (DBP) - Between JAN-2005 and MAR-2005, Contaminant: TTHM. Follow-up actions: St Public Notif requested (MAY-27-2005), St Violation/Reminder Notice (JUN-08-2005), St Compliance achieved (JUN-27-2005), St Public Notif received (JUN-27-2005), St Compliance achieved (SEP-16-2008)
Past health violations:NPS ECHO BAY (Population served: 51, Surface water):Past monitoring violations:
- MCL, Average - Between JAN-2010 and MAR-2010, Contaminant: TTHM. Follow-up actions: St Public Notif requested (NOV-13-2008), St Violation/Reminder Notice (NOV-13-2008), St Public Notif received (APR-28-2010), St Compliance achieved (JUN-21-2010)
- MCL, Average - Between OCT-2009 and DEC-2009, Contaminant: TTHM. Follow-up actions: St Public Notif requested (NOV-13-2008), St Violation/Reminder Notice (NOV-13-2008), St Public Notif received (DEC-11-2009), St Compliance achieved (JUN-21-2010)
- MCL, Average - Between JUL-2009 and SEP-2009, Contaminant: TTHM. Follow-up actions: St Public Notif requested (NOV-13-2008), St Violation/Reminder Notice (NOV-13-2008), St Public Notif received (SEP-06-2009), St Compliance achieved (JUN-21-2010)
- MCL, Average - Between APR-2009 and JUN-2009, Contaminant: TTHM. Follow-up actions: St Public Notif requested (NOV-13-2008), St Violation/Reminder Notice (NOV-13-2008), St Public Notif received (JUL-27-2009), St Compliance achieved (JUN-21-2010)
- MCL, Average - Between JAN-2009 and MAR-2009, Contaminant: TTHM. Follow-up actions: St Public Notif requested (NOV-13-2008), St Violation/Reminder Notice (NOV-13-2008), St Public Notif received (MAY-14-2009), St Compliance achieved (JUN-21-2010)
- MCL, Average - Between OCT-2008 and DEC-2008, Contaminant: TTHM. Follow-up actions: St Public Notif requested (FEB-03-2009), St Violation/Reminder Notice (FEB-03-2009), St Public Notif received (FEB-09-2009), St Compliance achieved (JUN-21-2010)
- 7 other older health violations
- Monitoring of Treatment (SWTR-Filter) - In APR-2005. Follow-up actions: St Violation/Reminder Notice (MAY-11-2005), St Public Notif requested (MAY-11-2005), St Public Notif received (MAY-18-2005), St Site Visit (enforcement) (MAY-25-2005), St Compliance achieved (NOV-01-2010)
- One regular monitoring violation
Past health violations:Past monitoring violations:
- MCL, Average - Between APR-2012 and JUN-2012, Contaminant: TTHM. Follow-up actions: St Public Notif requested (MAY-08-2009), St Violation/Reminder Notice (MAY-08-2009), St Public Notif received (MAY-31-2012), St Compliance achieved (SEP-19-2012)
- MCL, Average - Between JAN-2012 and MAR-2012, Contaminant: TTHM. Follow-up actions: St Public Notif requested (MAY-08-2009), St Violation/Reminder Notice (MAY-08-2009), St Public Notif received (MAR-30-2012), St Compliance achieved (SEP-19-2012)
- MCL, Average - Between OCT-2011 and DEC-2011, Contaminant: TTHM. Follow-up actions: St Public Notif requested (MAY-08-2009), St Violation/Reminder Notice (MAY-08-2009), St Public Notif received (JAN-30-2012), St Compliance achieved (SEP-19-2012)
- MCL, Average - Between JUL-2011 and SEP-2011, Contaminant: TTHM. Follow-up actions: St Public Notif requested (MAY-08-2009), St Violation/Reminder Notice (MAY-08-2009), St Public Notif received (SEP-06-2011), St Compliance achieved (SEP-19-2012)
- MCL, Average - Between APR-2011 and JUN-2011, Contaminant: TTHM. Follow-up actions: St Public Notif requested (MAY-08-2009), St Violation/Reminder Notice (MAY-08-2009), St Public Notif received (MAY-23-2011), St Compliance achieved (SEP-19-2012)
- MCL, Average - Between JAN-2011 and MAR-2011, Contaminant: TTHM. Follow-up actions: St Public Notif requested (MAY-08-2009), St Violation/Reminder Notice (MAY-08-2009), St Public Notif received (MAR-02-2011), St Compliance achieved (SEP-19-2012)
- 8 other older health violations
- Monitoring of Treatment (SWTR-Filter) - In APR-2008. Follow-up actions: St Compliance achieved (APR-11-2008), St Public Notif requested (JUL-17-2008), St Violation/Reminder Notice (JUL-17-2008)
- One regular monitoring violation
Drinking water stations with addresses in Boulder City that have no violations reported:
- NPS LAS VEGAS BAY (Population served: 25, Primary Water Source Type: Purch surface water)
| This city: | 2.3 people |
| Nevada: | 2.6 people |
| This city: | 62.4% |
| Whole state: | 65.3% |
| This city: | 6.5% |
| Whole state: | 8.7% |
Likely homosexual households (counted as self-reported same-sex unmarried-partner households)
- Lesbian couples: 0.2% of all households
- Gay men: 0.1% of all households
People in group quarters in Boulder City in 2010:
- 280 people in nursing facilities/skilled-nursing facilities
- 54 people in workers' group living quarters and job corps centers
- 2 people in other noninstitutional facilities
People in group quarters in Boulder City in 2000:
- 115 people in nursing homes
- 70 people in other noninstitutional group quarters
- 61 people in other group homes
- 4 people in religious group quarters
Banks with branches in Boulder City (2011 data):
- U.S. Bank National Association: Boulder City Vons Branch at 1031 Nevada Highway, branch established on 2009/08/10. Info updated 2012/01/30: Bank assets: $330,470.8 mil, Deposits: $236,091.5 mil, headquarters in Cincinnati, OH, positive income, 3121 total offices, Holding Company: U.S. Bancorp
- Bank of America, National Association: Boulder City Branch at 900 Nevada Highway, branch established on 1968/08/23. Info updated 2009/11/18: Bank assets: $1,451,969.3 mil, Deposits: $1,077,176.8 mil, headquarters in Charlotte, NC, positive income, 5782 total offices, Holding Company: Bank Of America Corporation
- Wells Fargo Bank, National Association: Boulder City Branch at 412 Nevada Highway, branch established on 1943/09/21. Info updated 2011/04/05: Bank assets: $1,161,490.0 mil, Deposits: $905,653.0 mil, headquarters in Sioux Falls, SD, positive income, 6395 total offices, Holding Company: Wells Fargo & Company
- Nevada State Bank: Boulder City Branch at 1000 Nevada Highway, branch established on 2000/01/19. Info updated 2009/04/21: Bank assets: $4,101.1 mil, Deposits: $3,546.3 mil, headquarters in Las Vegas, NV, positive income, Commercial Lending Specialization, 53 total offices, Holding Company: Zions Bancorporation
For population 15 years and over in Boulder City:
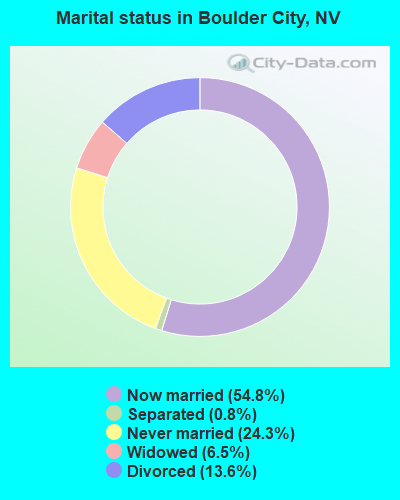
- Never married: 24.3%
- Now married: 54.8%
- Separated: 0.8%
- Widowed: 6.5%
- Divorced: 13.6%
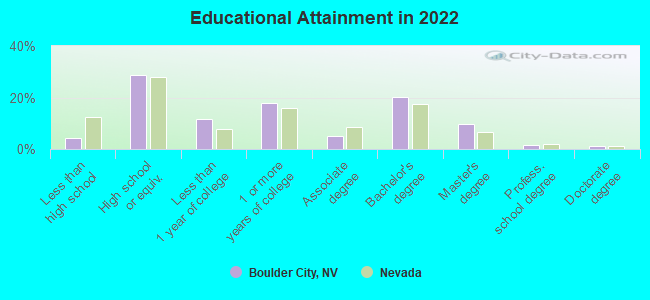
For population 25 years and over in Boulder City:
- High school or higher: 95.8%
- Bachelor's degree or higher: 31.9%
- Graduate or professional degree: 12.2%
- Unemployed: 5.8%
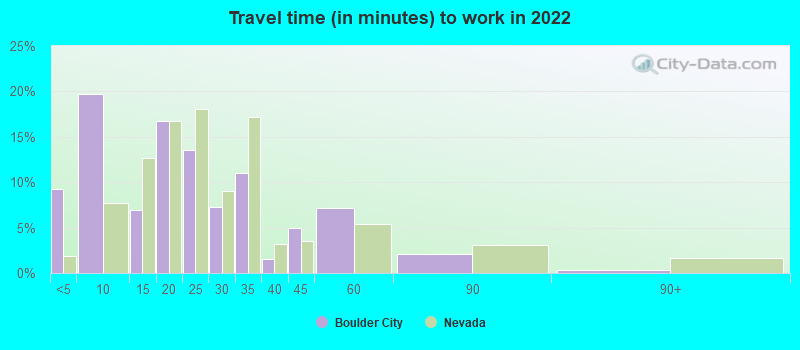
- Mean travel time to work (commute): 19.4 minutes
| Here: | 9.7 |
| Nevada average: | 12.5 |
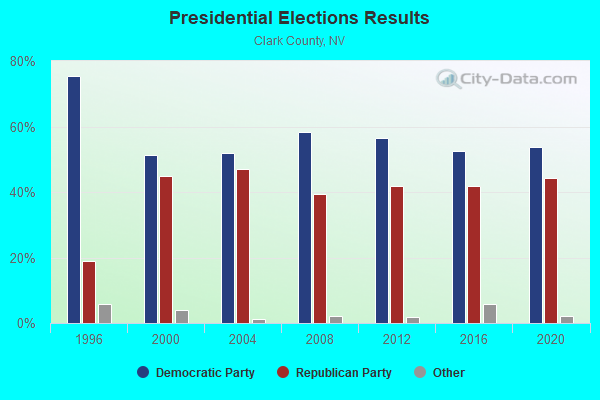
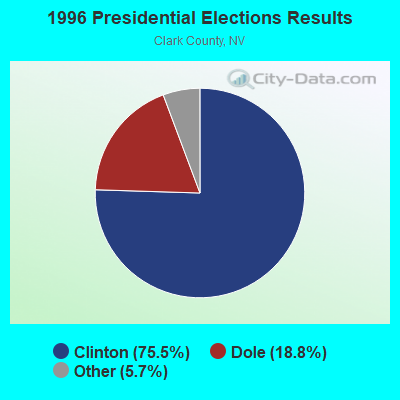
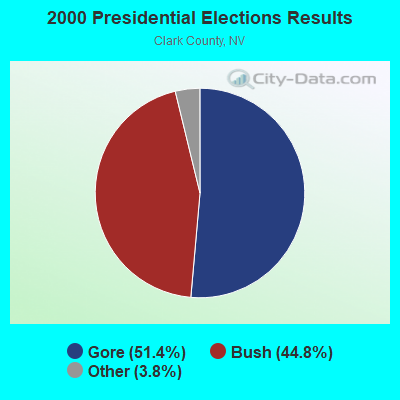
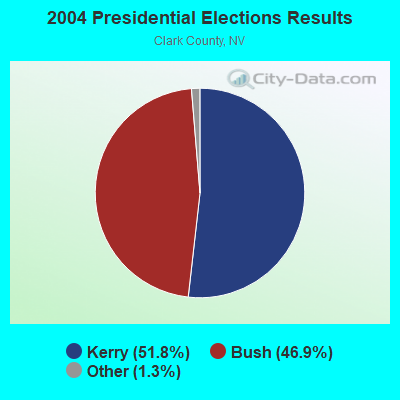
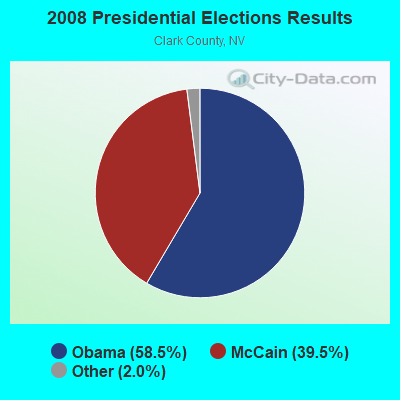
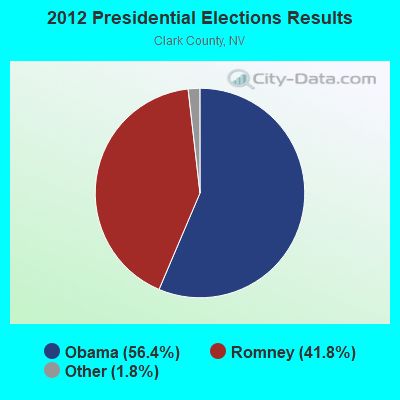
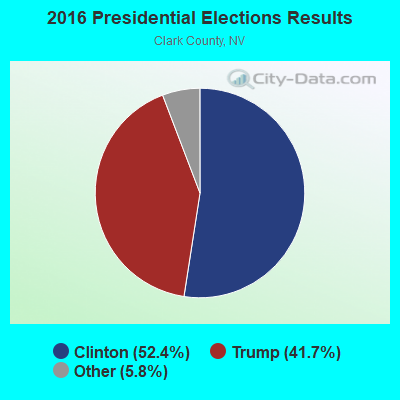
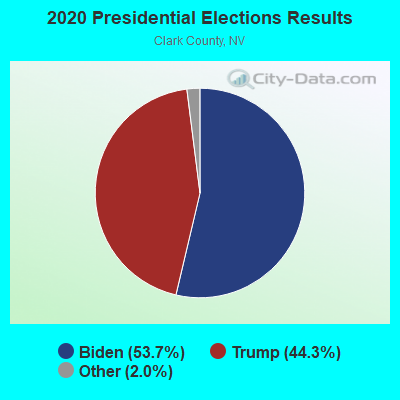
Graphs represent county-level data. Detailed 2008 Election Results
Religion statistics for Boulder City, NV (based on Clark County data)
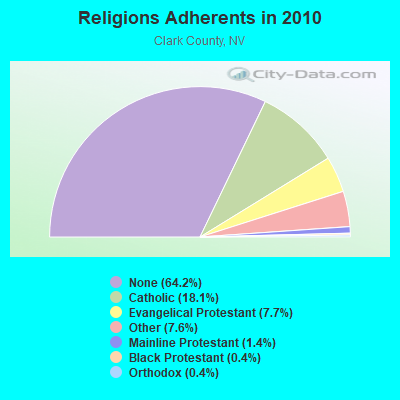
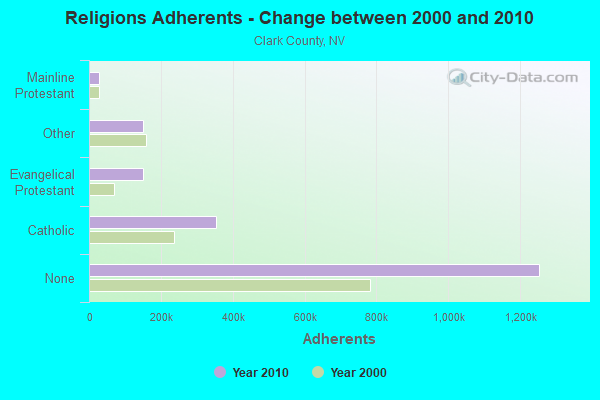
| Religion | Adherents | Congregations |
|---|---|---|
| Catholic | 354,110 | 32 |
| Evangelical Protestant | 150,709 | 349 |
| Other | 149,167 | 300 |
| Mainline Protestant | 27,072 | 72 |
| Black Protestant | 8,550 | 42 |
| Orthodox | 8,191 | 11 |
| None | 1,253,470 | - |
Food Environment Statistics:
| Clark County: | 1.41 / 10,000 pop. |
| Nevada: | 1.50 / 10,000 pop. |
| This county: | 0.08 / 10,000 pop. |
| State: | 0.10 / 10,000 pop. |
| Clark County: | 0.96 / 10,000 pop. |
| Nevada: | 1.00 / 10,000 pop. |
| Clark County: | 2.21 / 10,000 pop. |
| State: | 2.56 / 10,000 pop. |
| Here: | 5.68 / 10,000 pop. |
| State: | 6.14 / 10,000 pop. |
| This county: | 8.7% |
| Nevada: | 8.2% |
| Clark County: | 24.8% |
| Nevada: | 24.5% |
| This county: | 13.2% |
| State: | 13.2% |
Health and Nutrition:
| This city: | 51.7% |
| Nevada: | 48.6% |
| This city: | 48.0% |
| Nevada: | 45.9% |
| This city: | 28.7 |
| Nevada: | 28.6 |
| Boulder City: | 21.3% |
| State: | 21.3% |
| This city: | 10.0% |
| State: | 10.7% |
| This city: | 6.9 |
| Nevada: | 6.8 |
| Boulder City: | 36.5% |
| State: | 33.1% |
| Boulder City: | 55.5% |
| Nevada: | 55.6% |
| Here: | 75.4% |
| Nevada: | 79.4% |
More about Health and Nutrition of Boulder City, NV Residents
Boulder City government finances - Expenditure in 2021 (per resident):
- Current Operations - Police Protection: $9,169,000 ($615.78)
Water Utilities: $8,753,000 ($587.84)
Electric Utilities: $8,541,000 ($573.61)
Regular Highways: $6,897,000 ($463.20)
Local Fire Protection: $5,238,000 ($351.78)
Central Staff Services: $3,913,000 ($262.79)
Parks and Recreation: $3,626,000 ($243.52)
General - Other: $3,124,000 ($209.81)
Housing and Community Development: $2,263,000 ($151.98)
Judicial and Legal Services: $1,085,000 ($72.87)
Sewerage: $944,000 ($63.40)
Solid Waste Management: $939,000 ($63.06)
Air Transportation: $880,000 ($59.10)
Financial Administration: $771,000 ($51.78)
Miscellaneous Commercial Activities - Other: $92,000 ($6.18)
- General - Interest on Debt: $4,000 ($0.27)
- Other Capital Outlay - Electric Utilities: $5,997,000 ($402.75)
Air Transportation: $1,553,000 ($104.30)
Regular Highways: $1,254,000 ($84.22)
Police Protection: $308,000 ($20.69)
Water Utilities: $132,000 ($8.87)
Sewerage: $96,000 ($6.45)
Local Fire Protection: $10,000 ($0.67)
Miscellaneous Commercial Activities - Other: $2,000 ($0.13)
- Total Salaries and Wages: $19,005,000 ($1276.36)
- Water Utilities - Interest on Debt: $484,000 ($32.51)
Boulder City government finances - Revenue in 2021 (per resident):
- Charges - Parks and Recreation: $4,087,000 ($274.48)
Sewerage: $2,617,000 ($175.76)
Solid Waste Management: $1,598,000 ($107.32)
Other: $770,000 ($51.71)
Miscellaneous Commercial Activities: $196,000 ($13.16)
Air Transportation: $83,000 ($5.57)
- Federal Intergovernmental - Other: $1,508,000 ($101.28)
Air Transportation: $834,000 ($56.01)
Transit Utilities: $47,000 ($3.16)
- Local Intergovernmental - Transit Utilities: $1,381,000 ($92.75)
Other: $258,000 ($17.33)
- Miscellaneous - Rents: $22,621,000 ($1519.21)
Sale of Property: $2,907,000 ($195.23)
Fines and Forfeits: $708,000 ($47.55)
Interest Earnings: $302,000 ($20.28)
General Revenue - Other: $181,000 ($12.16)
- Revenue - Electric Utilities: $17,070,000 ($1146.41)
Water Utilities: $14,119,000 ($948.22)
- State Intergovernmental - General Local Government Support: $11,930,000 ($801.21)
Other: $1,566,000 ($105.17)
Highways: $448,000 ($30.09)
- Tax - Property: $3,059,000 ($205.44)
Other License: $2,152,000 ($144.53)
General Sales and Gross Receipts: $942,000 ($63.26)
Public Utilities Sales: $833,000 ($55.94)
Occupation and Business License - Other: $359,000 ($24.11)
Alcoholic Beverage License: $48,000 ($3.22)
Other Selective Sales: $38,000 ($2.55)
Motor Fuels Sales: $15,000 ($1.01)
Boulder City government finances - Debt in 2021 (per resident):
- Long Term Debt - Beginning Outstanding - Public Debt for Private Purpose: $23,495,000 ($1577.90)
Outstanding Nonguaranteed - Industrial Revenue: $21,749,000 ($1460.64)
Retired Unspecified Public Purpose: $1,852,000 ($124.38)
Beginning Outstanding - Unspecified Public Purpose: $1,852,000 ($124.38)
Retired Nonguaranteed - Public Debt for Private Purpose: $1,746,000 ($117.26)
Boulder City government finances - Cash and Securities in 2021 (per resident):
- Bond Funds - Cash and Securities: $5,513,000 ($370.25)
- Other Funds - Cash and Securities: $123,253,000 ($8277.57)
- Sinking Funds - Cash and Securities: $21,749,000 ($1460.64)
6.10% of this county's 2021 resident taxpayers lived in other counties in 2020 ($110,616 average adjusted gross income)
| Here: | 6.10% |
| Nevada average: | 6.67% |
0.06% of residents moved from foreign countries ($580 average AGI)
Clark County: 0.06% Nevada average: 0.05%
Top counties from which taxpayers relocated into this county between 2020 and 2021:
| from Los Angeles County, CA | |
| from Orange County, CA | |
| from San Diego County, CA |
5.29% of this county's 2020 resident taxpayers moved to other counties in 2021 ($64,726 average adjusted gross income)
| Here: | 5.29% |
| Nevada average: | 5.77% |
0.05% of residents moved to foreign countries ($695 average AGI)
Clark County: 0.05% Nevada average: 0.04%
Top counties to which taxpayers relocated from this county between 2020 and 2021:
| to Los Angeles County, CA | |
| to Maricopa County, AZ | |
| to San Diego County, CA |
| Businesses in Boulder City, NV | ||||
| Name | Count | Name | Count | |
|---|---|---|---|---|
| 7-Eleven | 2 | MasterBrand Cabinets | 1 | |
| Ace Hardware | 1 | McDonald's | 1 | |
| Albertsons | 1 | Nike | 2 | |
| AutoZone | 1 | Panda Express | 1 | |
| Big O Tires | 1 | Pizza Hut | 1 | |
| CVS | 1 | RadioShack | 1 | |
| Curves | 1 | Safeway | 1 | |
| Dairy Queen | 1 | Starbucks | 1 | |
| Domino's Pizza | 1 | T-Mobile | 1 | |
| FedEx | 3 | True Value | 1 | |
| GNC | 1 | U-Haul | 1 | |
| H&R Block | 1 | UPS | 4 | |
| KFC | 1 | Vons | 1 | |
Strongest AM radio stations in Boulder City:
- KDWN (720 AM; 50 kW; LAS VEGAS, NV; Owner: RADIO NEVADA CORP.)
- KLSQ (870 AM; 10 kW; WHITNEY, NV; Owner: KLSQ-AM LICENSE CORPORATION)
- KXNT (840 AM; 50 kW; NORTH LAS VEGAS, NV; Owner: INFINITY RADIO OPERATIONS INC.)
- KDOX (1280 AM; 5 kW; HENDERSON, NV; Owner: S & R BROADCASTING, INC.)
- KSFN (1140 AM; 10 kW; NORTH LAS VEGAS, NV; Owner: INFINITY RADIO OPERATIONS INC.)
- KENO (1460 AM; 10 kW; LAS VEGAS, NV; Owner: LOTUS BROADCASTING CORP.)
- KNUU (970 AM; 5 kW; PARADISE, NV; Owner: NEVADA MEDIA GROUP, INC.)
- KBAD (920 AM; 5 kW; LAS VEGAS, NV; Owner: LOTUS BROADCASTING CORP.)
- KKVV (1060 AM; 5 kW; LAS VEGAS, NV; Owner: LAS VEGAS BROADCASTERS, INC.)
- KSHP (1400 AM; 5 kW; NORTH LAS VEGAS, NV; Owner: LAS VEGAS RADIO CO. INC)
- KLAC (570 AM; 50 kW; LOS ANGELES, CA; Owner: AMFM RADIO LICENSES, L.L.C.)
- KMIA (710 AM; 50 kW; BLACK CANYON CITY, AZ; Owner: ENTRAVISION HOLDINGS, LLC)
- KLAV (1230 AM; 1 kW; LAS VEGAS, NV; Owner: GOR-OVERGAARD BROADCASTING, INC.)
Strongest FM radio stations in Boulder City:
- KSTJ (102.7 FM; BOULDER CITY, NV; Owner: KJUL LICENSE, LLC)
- KJUL (104.3 FM; NORTH LAS VEGAS, NV; Owner: KJUL LICENSE, LLC)
- KXPT (97.1 FM; LAS VEGAS, NV; Owner: LOTUS BROADCASTING CORP.)
- KNPR (89.5 FM; LAS VEGAS, NV; Owner: NEVADA PUBLIC RADIO CORPORATION)
- KOAS (105.7 FM; DOLAN SPRINGS, AZ; Owner: DESERT SKY MEDIA, LLC)
- K295AJ (106.9 FM; NORTH LAS VEGAS, NV; Owner: CSN INTERNATIONAL)
- KRRN-FM1 (92.7 FM; EAST LAS VEGAS, NV; Owner: ENTRAVISION HOLDINGS, LLC)
- KKLZ (96.3 FM; LAS VEGAS, NV; Owner: KJUL LICENSE, LLC)
- KILA (90.5 FM; LAS VEGAS, NV; Owner: FAITH COMMUNICATIONS CORP.)
- KSNE-FM (106.5 FM; LAS VEGAS, NV; Owner: CITICASTERS LICENSES, L.P.)
- KMXB (94.1 FM; HENDERSON, NV; Owner: INFINITY RADIO OPERATIONS INC.)
- KCEP (88.1 FM; LAS VEGAS, NV; Owner: ECONOMIC OPPORTUNITY BOARD OF CLARK COUNTY)
- KWID (101.9 FM; LAS VEGAS, NV; Owner: CITICASTERS LICENSES, L.P.)
- KMZQ-FM (100.5 FM; HENDERSON, NV; Owner: INFINITY RADIO OPERATIONS INC.)
- KWNR (95.5 FM; HENDERSON, NV; Owner: CITICASTERS LICENSES, L.P.)
- KVEG-FM1 (97.5 FM; HENDERSON, NV; Owner: KEMP BROADCASTING, INC.)
- KUNV (91.5 FM; LAS VEGAS, NV; Owner: UNIV OF NEVADA SYSTEM BD OF REGENTS)
- K211DC (90.1 FM; PAHRUMP, NV; Owner: CALVARY CHAPEL OF TWIN FALLS, INC.)
- KQOL-FM (93.1 FM; LAS VEGAS, NV; Owner: CITICASTERS LICENSES, L.P.)
- KXTE (107.5 FM; PAHRUMP, NV; Owner: INFINITY RADIO OPERATIONS INC.)
TV broadcast stations around Boulder City:
- K57FA (Channel 57; LAS VEGAS, NV; Owner: TRINITY BROADCASTING NETWORK)
- KVBC (Channel 3; LAS VEGAS, NV; Owner: VALLEY BROADCASTING COMPANY)
- KVVU-TV (Channel 5; HENDERSON, NV; Owner: KVVU BROADCASTING CORPORATION)
- KBLR (Channel 39; PARADISE, NV; Owner: SUMMIT MEDIA LIMITED PARTNERSHIP)
- K67GB (Channel 67; LAS VEGAS, NV; Owner: WORD OF GOD FELLOWSHIP, INC.)
- KLAS-TV (Channel 8; LAS VEGAS, NV; Owner: KLAS, INC. (A NEVADA CORPORATION))
- K43FO (Channel 43; LAS VEGAS, NV; Owner: THREE ANGELS BROADCASTING NETWORK, INC.)
- KTNV (Channel 13; LAS VEGAS, NV; Owner: JOURNAL BROADCAST CORPORATION)
- KFBT (Channel 33; LAS VEGAS, NV; Owner: CHANNEL 33, INC.)
- KLSV-LP (Channel 50; LAS VEGAS, NV; Owner: BILTMORE BROADCASTING CORPORATION)
- KVWB (Channel 21; LAS VEGAS, NV; Owner: KUPN LICENSEE, LLC)
- KLVX (Channel 10; LAS VEGAS, NV; Owner: CLARK COUNTY SCHOOL DISTRICT)
- KINC (Channel 15; LAS VEGAS, NV; Owner: ENTRAVISION HOLDINGS, LLC)
- KTVY-LP (Channel 63; LAS VEGAS, NV; Owner: KALEIDOSCOPE AFFILIATES OF LAS VEGAS)
- KVPX-LP (Channel 59; LAS VEGAS, NV; Owner: LOCALONE TEXAS, LTD.)
- K11DS (Channel 11; BOULDER CITY, NV; Owner: JOURNAL BROADCAST CORPORATION)
- KNBX-LP (Channel 31; LAS VEGAS, NV; Owner: EQUITY BROADCASTING CORPORATION)
- KYRK-LP (Channel 35; LAS VEGAS, NV; Owner: MAKO COMMUNICATIONS, LLC)
- K46GX (Channel 46; HENDERSON, NV; Owner: KLAS, INC. (A NEVADA CORPORATION))
- KTUD-LP (Channel 25; LAS VEGAS, NV; Owner: FOUR SEASONS LAS VEGAS, LLC)
- KGNG-LP (Channel 47; LAS VEGAS, NV; Owner: KING KONG BROADCASTING, INC.)
- KELV-LP (Channel 27; LAS VEGAS, NV; Owner: ENTRAVISION HOLDINGS, LLC)
- National Bridge Inventory (NBI) Statistics
- 54Number of bridges
- 814ft / 248mTotal length
- 1,508,325Total average daily traffic
- 48,944Total average daily truck traffic
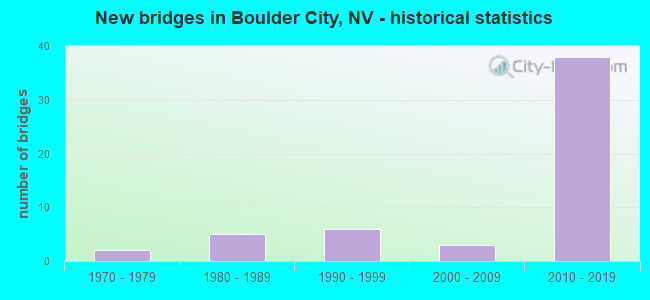
- New bridges - historical statistics
- 21970-1979
- 51980-1989
- 61990-1999
- 32000-2009
- 382010-2019
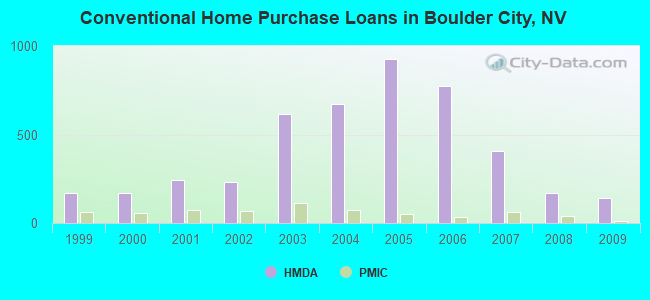
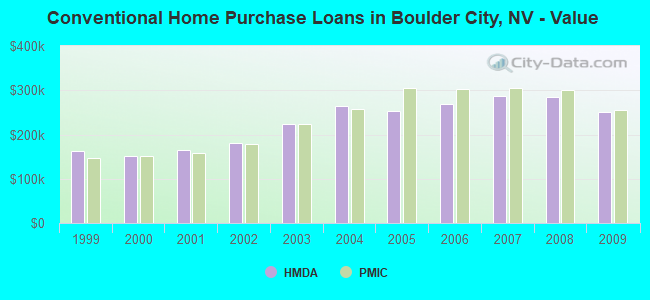
| Home Mortgage Disclosure Act Aggregated Statistics For Year 2009 (Based on 3 full and 2 partial tracts) | ||||||||||||
| A) FHA, FSA/RHS & VA Home Purchase Loans | B) Conventional Home Purchase Loans | C) Refinancings | D) Home Improvement Loans | F) Non-occupant Loans on < 5 Family Dwellings (A B C & D) | G) Loans On Manufactured Home Dwelling (A B C & D) | |||||||
|---|---|---|---|---|---|---|---|---|---|---|---|---|
| Number | Average Value | Number | Average Value | Number | Average Value | Number | Average Value | Number | Average Value | Number | Average Value | |
| LOANS ORIGINATED | 121 | $233,932 | 139 | $250,659 | 405 | $240,818 | 7 | $155,143 | 89 | $206,386 | 4 | $139,972 |
| APPLICATIONS APPROVED, NOT ACCEPTED | 8 | $207,710 | 8 | $250,182 | 43 | $324,920 | 4 | $65,035 | 8 | $170,519 | 2 | $71,090 |
| APPLICATIONS DENIED | 22 | $228,838 | 26 | $286,278 | 169 | $279,256 | 5 | $173,310 | 27 | $227,363 | 3 | $75,343 |
| APPLICATIONS WITHDRAWN | 14 | $225,331 | 17 | $260,112 | 102 | $265,915 | 4 | $92,290 | 16 | $213,443 | 3 | $120,100 |
| FILES CLOSED FOR INCOMPLETENESS | 2 | $161,465 | 3 | $276,547 | 23 | $331,088 | 3 | $420,100 | 2 | $295,980 | 0 | $0 |
Detailed HMDA statistics for the following Tracts: 0055.01 , 0055.02, 0055.03, 0055.04, 0057.10
| Private Mortgage Insurance Companies Aggregated Statistics For Year 2009 (Based on 3 full and 2 partial tracts) | ||||||
| A) Conventional Home Purchase Loans | B) Refinancings | C) Non-occupant Loans on < 5 Family Dwellings (A & B) | ||||
|---|---|---|---|---|---|---|
| Number | Average Value | Number | Average Value | Number | Average Value | |
| LOANS ORIGINATED | 12 | $254,364 | 4 | $276,912 | 1 | $153,550 |
| APPLICATIONS APPROVED, NOT ACCEPTED | 6 | $271,138 | 3 | $300,810 | 1 | $292,500 |
| APPLICATIONS DENIED | 3 | $214,873 | 1 | $229,200 | 1 | $166,940 |
| APPLICATIONS WITHDRAWN | 1 | $257,550 | 2 | $233,300 | 0 | $0 |
| FILES CLOSED FOR INCOMPLETENESS | 0 | $0 | 0 | $0 | 0 | $0 |
Detailed PMIC statistics for the following Tracts: 0055.01 , 0055.02, 0055.03, 0055.04, 0057.10
2002 - 2018 National Fire Incident Reporting System (NFIRS) incidents
- Fire incident types reported to NFIRS in Boulder City, NV
- 20135.9%Outside Fires
- 16930.2%Mobile Property/Vehicle Fires
- 11821.1%Structure Fires
- 7212.9%Other
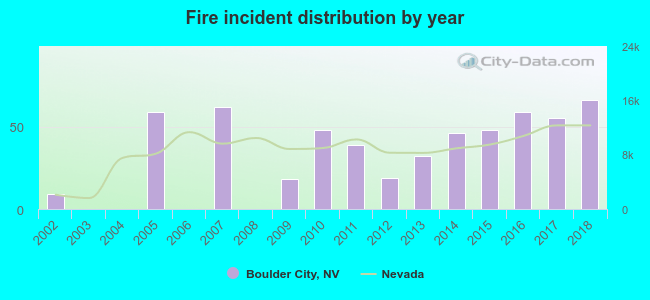 According to the data from the years 2002 - 2018 the average number of fires per year is 33. The highest number of fires - 66 took place in 2018, and the least - 0 in 2003. The data has a growing trend.
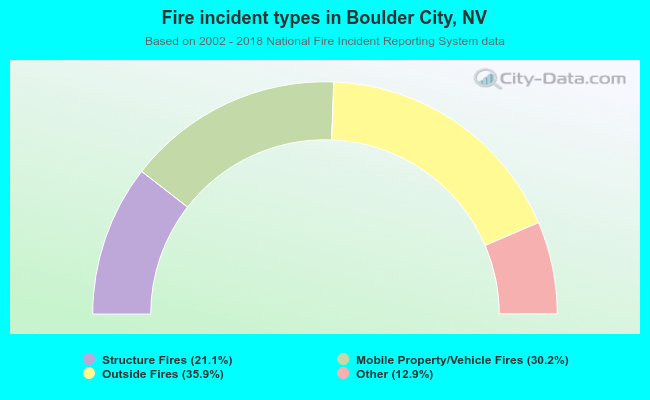 When looking into fire subcategories, the most reports belonged to: Outside Fires (35.9%), and Mobile Property/Vehicle Fires (30.2%).
Fire-safe hotels and motels in Boulder City, Nevada:
- Starview Motel, 1017 NV Hwy, Boulder City, Nevada 89005 , Phone: (702) 293-1658
- Boulder Inn & Suites, 704 Nevada Hwy, Boulder City, Nevada 89005 , Phone: (702) 369-1000, Fax: (702) 293-4344
- Boulder Dam Hotel, 1305 Arizona, Boulder City, Nevada 89005 , Phone: (702) 293-3510, Fax: (702) 293-3093
- Sands Motel Of Boulder City, 809 Nevada Way, Boulder City, Nevada 89005 , Phone: (702) 293-2589, Fax: (702) 294-0160
| Most common first names in Boulder City, NV among deceased individuals | ||
| Name | Count | Lived (average) |
|---|---|---|
| John | 140 | 77.5 years |
| Robert | 126 | 74.8 years |
| William | 121 | 74.9 years |
| James | 104 | 74.0 years |
| Mary | 86 | 79.9 years |
| Charles | 77 | 78.0 years |
| George | 62 | 76.5 years |
| Joseph | 57 | 77.5 years |
| Margaret | 54 | 79.8 years |
| Ruth | 50 | 82.2 years |
| Most common last names in Boulder City, NV among deceased individuals | ||
| Last name | Count | Lived (average) |
|---|---|---|
| Smith | 47 | 79.9 years |
| Johnson | 33 | 79.0 years |
| Miller | 22 | 77.5 years |
| Thomas | 21 | 70.6 years |
| Williams | 21 | 77.4 years |
| Jones | 19 | 79.5 years |
| Brown | 18 | 72.0 years |
| Wilson | 17 | 75.5 years |
| Anderson | 17 | 80.7 years |
| White | 15 | 75.6 years |
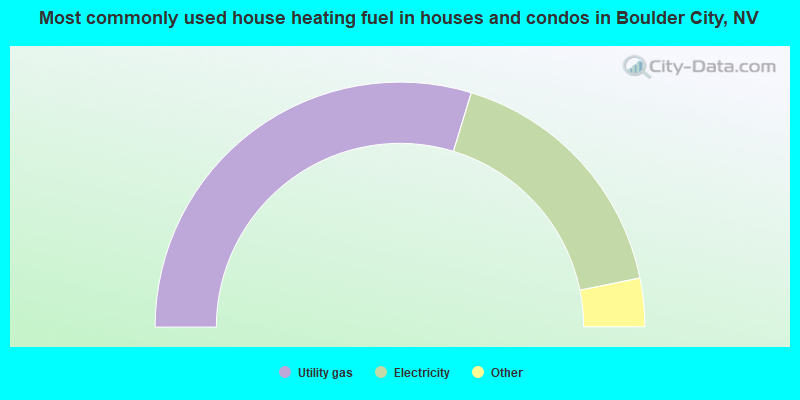
- 59.4%Utility gas
- 34.2%Electricity
- 2.7%Bottled, tank, or LP gas
- 2.4%Fuel oil, kerosene, etc.
- 1.0%Solar energy
- 0.3%Wood
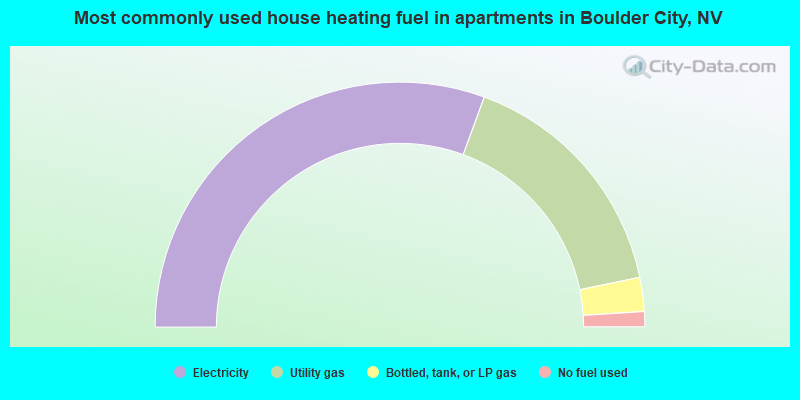
- 61.2%Electricity
- 32.3%Utility gas
- 4.5%Bottled, tank, or LP gas
- 2.0%No fuel used
Boulder City compared to Nevada state average:
- Unemployed percentage below state average.
- Black race population percentage significantly below state average.
- Hispanic race population percentage significantly below state average.
- Median age significantly above state average.
- Foreign-born population percentage significantly below state average.
- Length of stay since moving in significantly above state average.
- House age above state average.
- Percentage of population with a bachelor's degree or higher above state average.
Boulder City on our top lists:
- #43 on the list of "Top 101 cities with the most local government spending on current operations of parks and recreation per resident (population 10,000+)"
- #60 on the list of "Top 101 cities with the most people born in other U.S. states (population 5,000+)"
- #98 on the list of "Top 101 cities with the most users submitting photos to our site per 10,000 residents (population 5,000+)"
- #37 (89046) on the list of "Top 101 zip codes with the most casinos in 2005"
- #7 on the list of "Top 101 counties with the highest total withdrawal of fresh water for public supply"
- #9 on the list of "Top 101 counties with the highest surface withdrawal of fresh water for public supply"
- #9 on the list of "Top 101 counties with the highest carbon monoxide air pollution readings in 2012 (ppm)"
- #12 on the list of "Top 101 counties with the most Other adherents"
- #13 on the list of "Top 101 counties with the most Other congregations (pop. 50,000+)"

|
|
Total of 69 patent applications in 2008-2024.