Estimated zip code population in 2022: 322 Zip code population in 2010: 660 Zip code population in 2000: 813
Houses and condos: 498 Renter-occupied apartments: 65
% of renters here:
29%
State:
40%
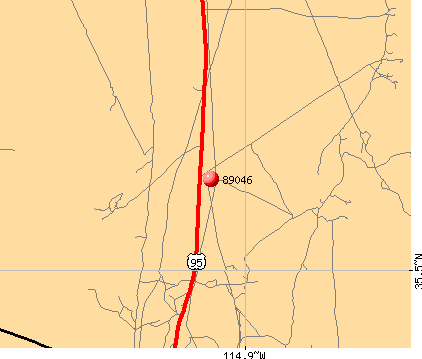
March 2022 cost of living index in zip code 89046: 89.1 (less than average, U.S. average is 100)
Land area: 863.5 sq. mi. Water area: 21.5 sq. mi.
Population density: 0.373 people per square mile
(very low).
OSM Map
General Map
Google Map
MSN Map
OSM Map
General Map
Google Map
MSN Map
OSM Map
General Map
Google Map
MSN Map
OSM Map
General Map
Google Map
MSN Map
Please wait while loading the map...
Real estate property taxes paid for housing units in 2022:
This zip code:
0.5% ($707)
Nevada:
0.4% ($1,889)
Median real estate property taxes paid for housing units with mortgages in 2022: $741 (0.3%) Median real estate property taxes paid for housing units with no mortgage in 2022: $687 (0.6%)
Averages for the 2020 tax year for zip code 89046, filed in 2021:
Average Adjusted Gross Income (AGI) in 2020: $45,304 (Individual Income Tax Returns)
Here:
$45,304
State:
$78,964
Salary/wage: $43,888 (reported on 68.0% of returns)
Here:
$43,888
State:
$54,472
(% of AGI for various income ranges: 1382.9% for AGIs below $25k, 3857.5% for AGIs $25k-50k, 4857.5% for AGIs $50k-75k)
Taxable interest for individuals: $200 (reported on 24.0% of returns)
This zip code:
$200
Nevada:
$3,521
(% of AGI for various income ranges: 10.0% for AGIs below $25k, 12.5% for AGIs $50k-75k)
Earned income credit: $1,640 (reported on 20.0% of returns)
Here:
$1,640
State:
$2,214
(% of AGI for various income ranges: 117.1% for AGIs below $25k)
Percentage of individuals using paid preparers for their 2020 taxes: 92.0%
Here:
92%
State:
93%
(% for various income ranges: 90.9% for AGIs below $25k, 85.7% for AGIs $25k-50k, 100.0% for AGIs $50k-75k, 100.0% for AGIs $100k-200k)
Averages for the 2012 tax year for zip code 89046, filed in 2013:
Average Adjusted Gross Income (AGI) in 2012: $32,029 (Individual Income Tax Returns)
Here:
$32,029
State:
$61,164
Salary/wage: $27,900 (reported on 71.0% of returns)
Here:
$27,900
State:
$45,924
(% of AGI for various income ranges: 72.8% for AGIs below $25k, 63.2% for AGIs $25k-50k, 63.6% for AGIs $50k-75k, 52.6% for AGIs $75k-100k)
Taxable interest for individuals: $350 (reported on 19.4% of returns)
This zip code:
$350
Nevada:
$3,137
Profit/loss from business: +$3,733 (reported on 9.7% of returns)
Here:
+$3,733
State:
+$12,567
Taxable individual retirement arrangement distribution: $9,000 (reported on 6.5% of returns)
89046:
$9,000
Nevada:
$20,808
Total itemized deductions: $20,600 (25% of AGI, reported on 12.9% of returns)
Here:
$20,600
State:
$26,148
Here:
25.1% of AGI
State:
20.0% of AGI
Charity contributions: $2,067 (reported on 9.7% of returns)
Here:
$2,067
State:
$4,329
Taxes paid: $3,050 (reported on 12.9% of returns)
89046:
$3,050
State:
$5,116
Earned income credit: $1,700 (reported on 19.4% of returns)
Here:
$1,700
State:
$2,279
(% of AGI for various income ranges: 4.8% for AGIs below $25k)
Percentage of individuals using paid preparers for their 2012 taxes: 38.7%
Here:
39%
State:
55%
(% for various income ranges: 29.4% for AGIs below $25k, 42.9% for AGIs $25k-50k, 50.0% for AGIs $50k-75k, 66.7% for AGIs $75k-100k)
Averages for the 2004 tax year for zip code 89046, filed in 2005:
Average Adjusted Gross Income (AGI) in 2004: $30,246 (Individual Income Tax Returns)
Here:
$30,246
State:
$58,367
Salary/wage: $25,432 (reported on 76.5% of returns)
Here:
$25,432
State:
$42,695
(% of AGI for various income ranges: 71.8% for AGIs below $10k, 69.0% for AGIs $10k-25k, 70.2% for AGIs $25k-50k, 65.2% for AGIs $50k-75k, 51.6% for AGIs $75k-100k)
Taxable interest for individuals: $1,041 (reported on 35.7% of returns)
This zip code:
$1,041
Nevada:
$3,867
(% of AGI for various income ranges: 6.8% for AGIs below $10k, 2.1% for AGIs $10k-25k, 1.3% for AGIs $25k-50k, 0.4% for AGIs $50k-75k, 0.4% for AGIs $75k-100k)
Taxable dividends: $1,722 (reported on 10.4% of returns)
Here:
$1,722
State:
$5,770
Net capital gain/loss: +$10,000 (reported on 9.6% of returns)
Here:
+$10,000
State:
+$50,644
Profit/loss from business: +$192 (reported on 7.5% of returns)
Here:
+$192
State:
+$13,618
Total itemized deductions: $15,352 (31% of AGI, reported on 15.7% of returns)
Here:
$15,352
State:
$22,990
Here:
31.5% of AGI
State:
21.8% of AGI
Charity contributions deductions: $1,429 (3% of AGI, reported on 12.2% of returns)
Here:
$1,429
State:
$3,443
Here:
2.7% of AGI
State:
3.1% of AGI
Total tax: $3,469 (reported on 74.2% of returns)
89046:
$3,469
State:
$10,585
(% of AGI for various income ranges: 0.8% for AGIs below $10k, 4.0% for AGIs $10k-25k, 7.1% for AGIs $25k-50k, 9.9% for AGIs $50k-75k, 13.6% for AGIs $75k-100k)
Earned income credit: $1,392 (reported on 14.8% of returns)
Here:
$1,392
State:
$1,676
Percentage of individuals using paid preparers for their 2004 taxes: 49.6%
Here:
50%
State:
60%
(% for various income ranges: 44.4% for AGIs below $10k, 32.1% for AGIs $10k-25k, 62.7% for AGIs $25k-50k, 80.0% for AGIs $50k-75k, 63.6% for AGIs $75k-100k)
Household received Food Stamps/SNAP in the past 12 months: 13 Household did not receive Food Stamps/SNAP in the past 12 months: 211
Women who did not have a birth in the past 12 months: 26 (10 now married, 15 unmarried)
Housing units in zip code 89046 with a mortgage: 36 Median monthly owner costs for units with a mortgage: $1,166 Median monthly owner costs for units without a mortgage: $367
Residents with income below the poverty level in 2022:
This zip code:
29.7%
Whole state:
12.5%
Residents with income below 50% of the poverty level in 2022:
This zip code:
7.7%
Whole state:
5.9%
Median number of rooms in houses and condos:
Here:
5.0
State:
6.0
Median number of rooms in apartments:
Here:
2.5
State:
4.2
Notable locations in this zip code not listed on our city pages
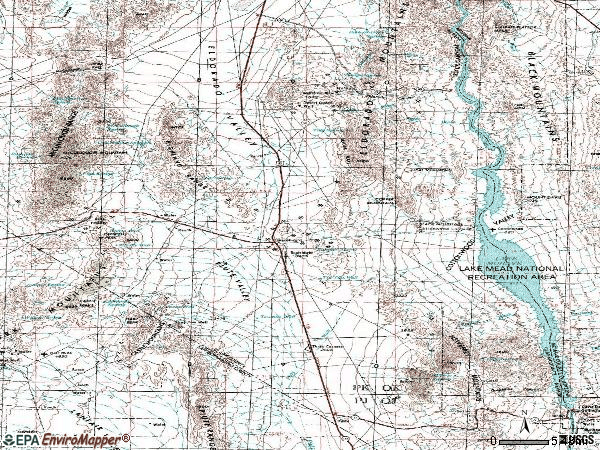
Notable locations in zip code 89046: Nippeno Mill (A), Boyd Rucker Ranch (B), Lake Mead Recreation Ranger Headquarters (C), Abbottsville (D), Searchlight Ferry (E), Eldorado Mine (F), YKL Ranch (G), Camp Thurman (H), Capitol Camp (I), Cottonwood Cove (J), Cow Camp (K), Aztec Wash Light (L), Juan (M), Nelsons Landing (N), Searchlight Community Center (O), Searchlight Senior Center (P), Searchlight Youth and Teen Center (Q), Clark County Fire Department Station 75 (R). Display/hide their locations on the map
Streams, rivers, and creeks: Sacatone Wash (A), White Rock Wash (B), Techatticup Wash (C), Roman Wash (D), Power Line Wash (E), Nellis Wash (F), Morning Star Wash (G), Montana Wash (H), Lonesome Wash (I). Display/hide their locations on the map
In group quarters: 6 (-1 institutionalized population)
Size of family households: 60 2-persons, 12 3-persons
Size of nonfamily households: 147 1-person, 6 2-persons
94.1% of residents of 89046 zip code speak English at home.
7.2% of residents speak Spanish at home (100% very well).
Foreign born population: 1 (0.3%) (100.0% of them are naturalized citizens)
This zip code:
0.3%
Whole state:
18.9%
100%Ireland
21%American
21%German
11%English
8%Irish
5%Scandinavian
2%Norwegian
Year of entry for the foreign-born population
02010 or later
12000 to 2009
01990 to 1999
10Before 1990
Facilities with environmental interests located in this zip code:
REID, HARRY ELEM (300 MICHAEL WENDELL WAY in SEARCHLIGHT, NV)
(National Center for Education Statistics) - STATE ID-02-104 Organizations: CLARK CO SCH DIST (SCHOOL DISTRICT)
AMER. TELE & TELE. CO. SEARCHLIGHT (11.5 MILES WNW OF in SEARCHLIGHT, NV)
(Resource Conservation and Recovery Act (tracking hazardous waste)) Organizations: AMERICAN TELEPHONE AND TELEGRAPH COMPANY (CONTACT/OWNER)
USCG LORAN STA TION SEARCHLIGHT (10 MI S OF SEARCHLIGHT NV in SEARCHLIGHT, NV) . Federal Facility. COAST GUARD
(Resource Conservation and Recovery Act (tracking hazardous waste)) Organizations: U S COAST GUARD DISTRICT 11 (CONTACT/OWNER)
CRESCENT PEAK RD. COMPLAINT (CRESCENT PEAK RD. AND SR164 in SEARCHLIGHT, NV)
(Resource Conservation and Recovery Act (tracking hazardous waste))
EAGLE 1 MILL SITE (T26S, R64E, SEC 14 in NELSON, NV)
SUPERFUND (Superfund database)
Housing units lacking complete plumbing facilities: 6.6% Housing units lacking complete kitchen facilities: 8.9%
57.2%Electricity
25.2%Utility gas
9.6%Bottled, tank, or LP gas
6.4%Fuel oil, kerosene, etc.
2.7%Solar energy
Population in 1990: 948.
Place of birth for U.S.-born residents:
This state: 36
Northeast: 13
Midwest: 148
West: 106
48% of the 89046 zip code residents lived in the same house 5 years ago. Out of people who lived in different houses, 30% lived in this county. Out of people who lived in different counties, 50% lived in Nevada.
92% of the 89046 zip code residents lived in the same house 1 year ago. Out of people who lived in different houses, 46% moved from this county. Out of people who lived in different houses, 58% moved from different state.
Students in private schools in grades 9 to 12 (high school):
Here:
0.0%
Nevada:
6.9%
Top industries in this zip code by the number of employees in 2005:
Utilities: Fossil Fuel Electric Power Generation (250-499: 1)
Other Services (except Public Administration): Commercial and Industrial Machinery and Equipment (except Automotive and Electronic) Repair and Maintenance (50-99: 1)
Arts, Entertainment, and Recreation: Marinas (50-99: 1)
Mining: Construction Sand and Gravel Mining (50-99: 1)
Arts, Entertainment, and Recreation: Casinos (except Casino Hotels) (50-99: 1)
Accommodation and Food Services: Limited-Service Restaurants (20-49: 1)
Arts, Entertainment, and Recreation: Other Gambling Industries (10-19: 1)
People in group quarters in 2010:
8 people in workers' group living quarters and job corps centers
People in group quarters in 2000:
22 people in other workers' dormitories
Fatal accident statistics in 2012:
Fatal accident count: 1
Vehicles involved in fatal accidents: 1
Fatal accidents caused by drunken drivers: 1
Fatalities: 1
Persons involved in fatal accidents: 1
Pedestrians involved in fatal accidents: 0
Fatal accident statistics in 2010:
Fatal accident count: 1
Vehicles involved in fatal accidents: 1
Fatal accidents caused by drunken drivers: 0
Fatalities: 1
Persons involved in fatal accidents: 1
Pedestrians involved in fatal accidents: 0
Home Mortgage Disclosure Act Aggregated Statistics For Year 2009 (Based on 2 partial tracts)
A) FHA, FSA/RHS & VA Home Purchase Loans
B) Conventional Home Purchase Loans
C) Refinancings
D) Home Improvement Loans
F) Non-occupant Loans on < 5 Family Dwellings (A B C & D)
G) Loans On Manufactured Home Dwelling (A B C & D)
Number
Average Value
Number
Average Value
Number
Average Value
Number
Average Value
Number
Average Value
Number
Average Value
LOANS ORIGINATED
2
$395,485
2
$137,335
2
$111,520
0
$0
1
$181,740
1
$62,990
APPLICATIONS APPROVED, NOT ACCEPTED
0
$0
0
$0
0
$0
0
$0
0
$0
0
$0
APPLICATIONS DENIED
0
$0
1
$92,930
8
$160,828
0
$0
0
$0
2
$122,880
APPLICATIONS WITHDRAWN
1
$137,340
0
$0
3
$82,607
1
$56,790
0
$0
2
$56,795
FILES CLOSED FOR INCOMPLETENESS
0
$0
0
$0
3
$101,540
0
$0
0
$0
1
$87,770
Aggregated Statistics For Year 2008 (Based on 2 partial tracts)
B) Conventional Home Purchase Loans
C) Refinancings
D) Home Improvement Loans
F) Non-occupant Loans on < 5 Family Dwellings (A B C & D)
G) Loans On Manufactured Home Dwelling (A B C & D)
Number
Average Value
Number
Average Value
Number
Average Value
Number
Average Value
Number
Average Value
LOANS ORIGINATED
3
$190,343
9
$207,782
0
$0
6
$220,460
3
$153,857
APPLICATIONS APPROVED, NOT ACCEPTED
1
$81,580
3
$93,623
0
$0
0
$0
2
$141,465
APPLICATIONS DENIED
1
$103,260
3
$160,740
2
$197,225
2
$126,495
3
$165,903
APPLICATIONS WITHDRAWN
3
$224,420
1
$198,260
1
$30,980
0
$0
1
$198,260
FILES CLOSED FOR INCOMPLETENESS
1
$367,610
0
$0
0
$0
0
$0
0
$0
Aggregated Statistics For Year 2007 (Based on 2 partial tracts)
A) FHA, FSA/RHS & VA Home Purchase Loans
B) Conventional Home Purchase Loans
C) Refinancings
D) Home Improvement Loans
F) Non-occupant Loans on < 5 Family Dwellings (A B C & D)
G) Loans On Manufactured Home Dwelling (A B C & D)
Number
Average Value
Number
Average Value
Number
Average Value
Number
Average Value
Number
Average Value
Number
Average Value
LOANS ORIGINATED
2
$214,780
10
$167,488
8
$143,144
2
$186,900
5
$168,934
11
$181,362
APPLICATIONS APPROVED, NOT ACCEPTED
0
$0
1
$418,200
5
$216,020
1
$30,980
0
$0
2
$196,195
APPLICATIONS DENIED
2
$178,125
5
$274,258
21
$160,446
3
$46,810
1
$231,300
11
$153,670
APPLICATIONS WITHDRAWN
0
$0
1
$185,870
7
$92,787
0
$0
1
$185,870
1
$25,810
FILES CLOSED FOR INCOMPLETENESS
0
$0
1
$113,590
1
$164,180
0
$0
0
$0
1
$113,590
Aggregated Statistics For Year 2006 (Based on 2 partial tracts)
A) FHA, FSA/RHS & VA Home Purchase Loans
B) Conventional Home Purchase Loans
C) Refinancings
D) Home Improvement Loans
F) Non-occupant Loans on < 5 Family Dwellings (A B C & D)
G) Loans On Manufactured Home Dwelling (A B C & D)
Number
Average Value
Number
Average Value
Number
Average Value
Number
Average Value
Number
Average Value
Number
Average Value
LOANS ORIGINATED
2
$170,895
6
$95,343
12
$142,585
2
$129,075
2
$161,085
11
$136,022
APPLICATIONS APPROVED, NOT ACCEPTED
0
$0
1
$81,580
0
$0
0
$0
0
$0
1
$81,580
APPLICATIONS DENIED
1
$185,870
4
$191,290
13
$159,576
3
$113,243
2
$193,610
5
$116,478
APPLICATIONS WITHDRAWN
1
$276,740
3
$252,987
5
$172,444
3
$216,157
0
$0
3
$197,570
FILES CLOSED FOR INCOMPLETENESS
0
$0
0
$0
1
$91,900
0
$0
0
$0
0
$0
Aggregated Statistics For Year 2005 (Based on 2 partial tracts)
B) Conventional Home Purchase Loans
C) Refinancings
D) Home Improvement Loans
F) Non-occupant Loans on < 5 Family Dwellings (A B C & D)
G) Loans On Manufactured Home Dwelling (A B C & D)
Number
Average Value
Number
Average Value
Number
Average Value
Number
Average Value
Number
Average Value
LOANS ORIGINATED
7
$150,170
5
$160,052
0
$0
3
$206,863
3
$99,130
APPLICATIONS APPROVED, NOT ACCEPTED
1
$186,900
4
$103,002
0
$0
1
$86,740
3
$116,683
APPLICATIONS DENIED
11
$141,560
21
$117,077
5
$123,292
1
$295,320
11
$61,675
APPLICATIONS WITHDRAWN
3
$135,613
13
$132,570
0
$0
0
$0
4
$120,815
FILES CLOSED FOR INCOMPLETENESS
0
$0
2
$157,470
0
$0
0
$0
0
$0
Aggregated Statistics For Year 2004 (Based on 2 partial tracts)
B) Conventional Home Purchase Loans
C) Refinancings
D) Home Improvement Loans
F) Non-occupant Loans on < 5 Family Dwellings (A B C & D)
G) Loans On Manufactured Home Dwelling (A B C & D)
Number
Average Value
Number
Average Value
Number
Average Value
Number
Average Value
Number
Average Value
LOANS ORIGINATED
15
$112,278
9
$135,156
2
$30,460
3
$164,527
10
$78,065
APPLICATIONS APPROVED, NOT ACCEPTED
9
$75,150
4
$115,910
0
$0
4
$99,130
12
$86,222
APPLICATIONS DENIED
5
$107,184
18
$115,881
1
$36,140
0
$0
5
$90,868
APPLICATIONS WITHDRAWN
1
$208,590
6
$100,507
0
$0
1
$208,590
1
$108,420
FILES CLOSED FOR INCOMPLETENESS
0
$0
2
$103,775
0
$0
0
$0
1
$83,640
Aggregated Statistics For Year 2003 (Based on 2 partial tracts)
B) Conventional Home Purchase Loans
C) Refinancings
D) Home Improvement Loans
F) Non-occupant Loans on < 5 Family Dwellings (A B C & D)
Number
Average Value
Number
Average Value
Number
Average Value
Number
Average Value
LOANS ORIGINATED
19
$116,901
13
$113,427
0
$0
6
$118,577
APPLICATIONS APPROVED, NOT ACCEPTED
3
$78,477
3
$64,020
1
$25,810
2
$81,575
APPLICATIONS DENIED
8
$122,621
13
$88,645
0
$0
1
$46,470
APPLICATIONS WITHDRAWN
10
$113,896
8
$88,675
0
$0
6
$73,315
FILES CLOSED FOR INCOMPLETENESS
0
$0
0
$0
0
$0
0
$0
Aggregated Statistics For Year 1999 (Based on 1 partial tract)
A) FHA, FSA/RHS & VA Home Purchase Loans
B) Conventional Home Purchase Loans
C) Refinancings
D) Home Improvement Loans
F) Non-occupant Loans on < 5 Family Dwellings (A B C & D)
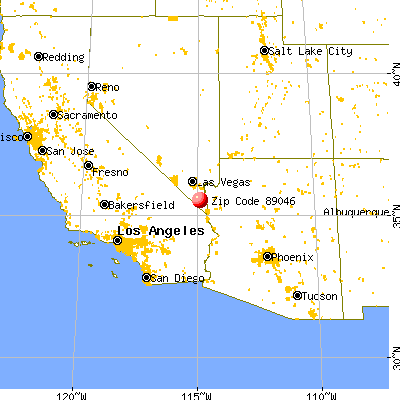


 Nearest zip codes: 89039, 89029, 86445, 89026, 89052, 89005.