Virginia Beach: Fire Incidents, Virginia (VA)
Where are fire incidents reported in Virginia Beach, VA
Something went wrong! Please refresh the page.
| Fire incidents reported | |
|---|---|
| Sreet name | Count |
| VIRGINIA BEACH BL | 1,240 |
| PRINCESS ANNE RD | 768 |
| LYNNHAVEN PW | 596 |
| SHORE DR | 456 |
| ATLANTIC AV | 416 |
| INDEPENDENCE BL | 390 |
| HOLLAND RD | 352 |
| INDIAN RIVER RD | 348 |
| GENERAL BOOTH BL | 276 |
| FIRST COLONIAL RD | 270 |
| LASKIN RD | 260 |
| NORTHAMPTON BL | 244 |
| INDEPENDENCE BL S | 174 |
| BONNEY RD | 172 |
| DIAMOND SPRINGS RD | 158 |
| BAKER RD | 156 |
| LONDON BRIDGE RD | 154 |
| KEMPSVILLE RD | 152 |
| NEWTOWN RD | 152 |
| PROVIDENCE RD | 150 |
| ROSEMONT RD S | 140 |
| MILITARY HY S | 128 |
| CENTERVILLE TP | 124 |
| BLACKWATER RD | 116 |
| 19TH ST | 112 |
| DAM NECK RD | 106 |
| WITCHDUCK RD N | 106 |
| GREAT NECK RD N | 104 |
| SANDPIPER RD | 96 |
| CLUB HOUSE RD S | 94 |
| Other | 9,246 |
2003 - 2018 National Fire Incident Reporting System (NFIRS) incidents
- Incident types reported to NFIRS in Virginia Beach, VA
- 100,98852.1%Rescue & EMS
- 22,50211.6%Hazardous Condition
- 20,12410.4%Service Call
- 17,7599.2%Good Intent Call
- 17,2568.9%Fire
- 14,2517.3%False Alarm
- 5560.3%Special Incident
- 2840.1%Overpressure Rupture
- 2450.1%Severe Weather
- Fire incident types reported to NFIRS in Virginia Beach, VA
- 6,97940.4%Outside Fires
- 6,71738.9%Structure Fires
- 3,02417.5%Mobile Property/Vehicle Fires
- 5363.1%Other
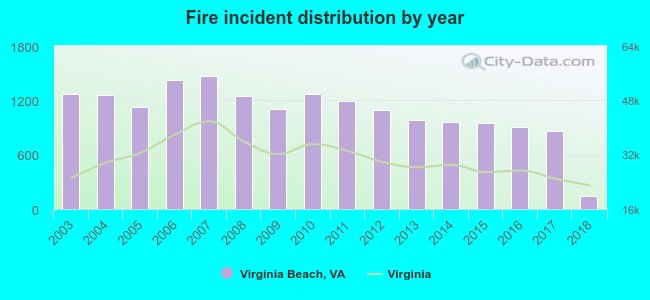 Based on the data from the years 2003 - 2018 the average number of fire incidents per year is 1,079. The highest number of fire incidents - 1,469 took place in 2007, and the least - 147 in 2018. The data has a declining trend.
The average number of yearly fire incidents per 10k residents in Virginia Beach, VA compared to nearest cities:
(Note: Based on data for the last 3 years, including only cities with population 5,000 and above)
| Virginia Beach: | 14.1 |
| Norfolk: | 30.1 |
| Brambleton: | 3.6 |
| Chesapeake: | 18.5 |
| Meadowbrook: | 8.5 |
| Portsmouth: | 39.2 |
| Hampton: | 28.4 |
| Poquoson: | 23.2 |
| Newport News: | 28.0 |
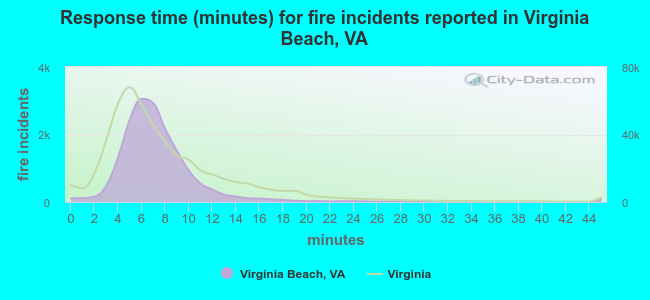 The median response time based on all reported fire incidents is 7 minutes. This is comparable to the state median value.
The median response time in Virginia Beach, VA compared to nearest cities:
(Note: Based on data for all years, including only cities with at least 500 fire incidents)
| Virginia Beach: | 7 minutes |
| Norfolk: | 4 minutes |
| Chesapeake: | 7 minutes |
| Portsmouth: | 5 minutes |
| Hampton: | 5 minutes |
| Poquoson: | 4 minutes |
| Newport News: | 5 minutes |
| Suffolk: | 6 minutes |
| Smithfield: | 7 minutes |
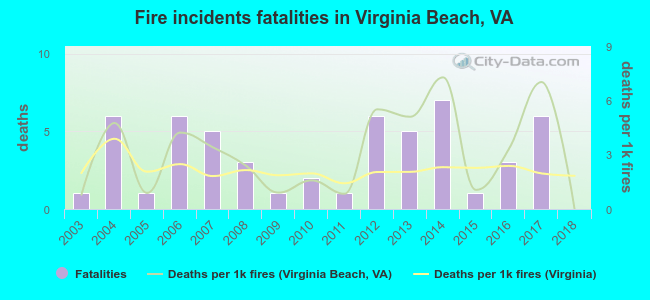 Based on the reports from the years 2003 - 2018 the average number of fire-related yearly deaths is 3. The highest number of deaths - 7 took place in 2014, and the lowest - 0 in 2018. The data has a dropping trend.
The average number of fatalities per 1,000 fire incidents is 3. This indicator was the highest - 7 in 2014, and the lowest 0 in 2018. The trend for fatalities per 1,000 incidents is declining. Compared to the state value the number of deaths per 1,000 incidents is higher.
Based on the reports from the years 2003 - 2018 the average number of fire-related yearly deaths is 3. The highest number of deaths - 7 took place in 2014, and the lowest - 0 in 2018. The data has a dropping trend.
The average number of fatalities per 1,000 fire incidents is 3. This indicator was the highest - 7 in 2014, and the lowest 0 in 2018. The trend for fatalities per 1,000 incidents is declining. Compared to the state value the number of deaths per 1,000 incidents is higher.Deaths per 1,000 incidents in Virginia Beach, VA compared to nearest cities:
(Note: Based on data for all years, including only cities with at least 2,500 fire incidents)
| Virginia Beach: | 3.1 |
| Norfolk: | 1.0 |
| Chesapeake: | 2.6 |
| Portsmouth: | 2.1 |
| Hampton: | 2.5 |
| Newport News: | 2.1 |
| Suffolk: | 1.7 |
| Elizabeth City: | 0.4 |
| Williamsburg: | 2.2 |
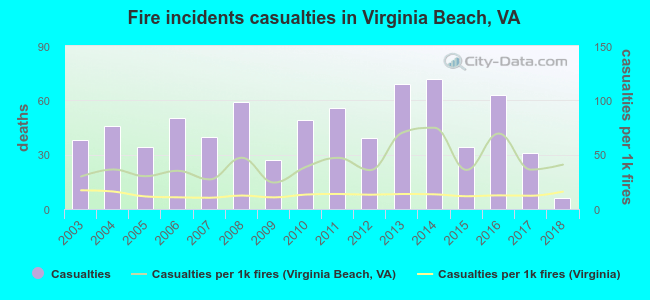 Based on the data from the years 2003 - 2018 the average number of fire-related casualties per year is 45. The highest number of casualties - 72 took place in 2014, and the lowest - 6 in 2018. The data has a declining trend.
The average number of injuries per 1,000 fire incidents is 42. This indicator was the highest - 75 in 2014, and the lowest 24 in 2009. The trend for injuries per 1,000 fire incidents is growing. Compared to the state value the number of casualties per 1,000 fires is much higher.
Based on the data from the years 2003 - 2018 the average number of fire-related casualties per year is 45. The highest number of casualties - 72 took place in 2014, and the lowest - 6 in 2018. The data has a declining trend.
The average number of injuries per 1,000 fire incidents is 42. This indicator was the highest - 75 in 2014, and the lowest 24 in 2009. The trend for injuries per 1,000 fire incidents is growing. Compared to the state value the number of casualties per 1,000 fires is much higher.Casualties per 1,000 incidents in Virginia Beach, VA compared to nearest cities:
(Note: Based on data for all years, including only cities with at least 500 fire incidents)
| Virginia Beach: | 41.3 |
| Norfolk: | 9.0 |
| Chesapeake: | 37.9 |
| Portsmouth: | 3.9 |
| Hampton: | 19.6 |
| Poquoson: | 17.4 |
| Newport News: | 39.0 |
| Suffolk: | 5.5 |
| Smithfield: | 4.9 |
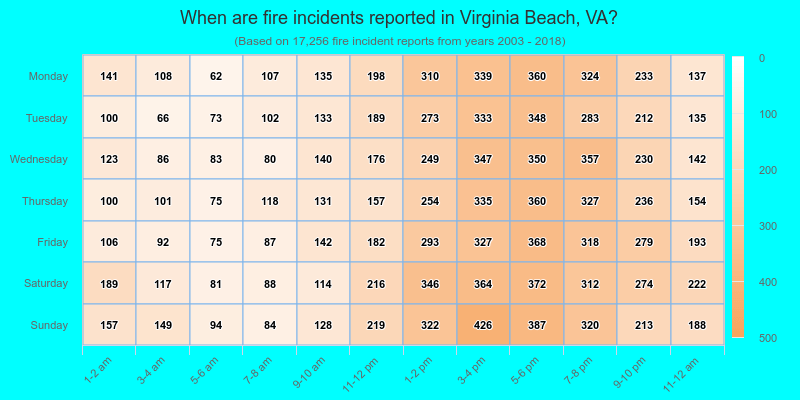
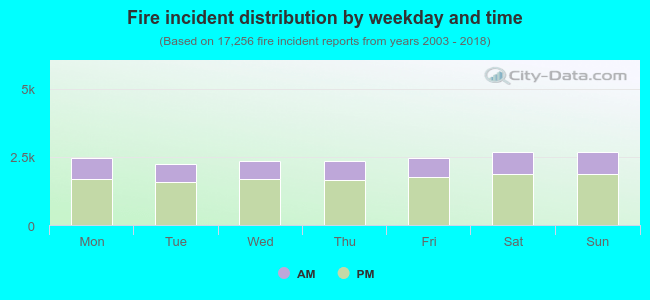 29.6% incidents where reported in the morning and 70.4% in the evening. The most fires (15.6%) took place on Saturday, and the least (13.0%) on Tuesday.
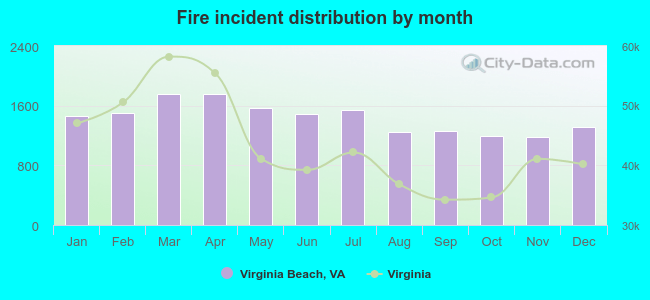 According to the 17,256 fires from years 2003 - 2018 most fires (10.2%) took place during March, and the least (6.8%) in November.
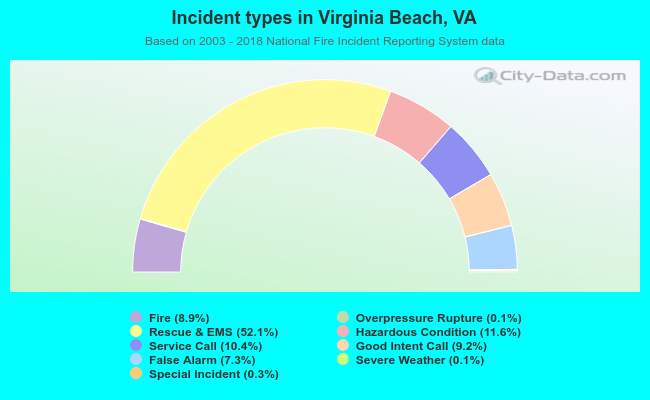 Out of all 193,965 cases reported during the years 2003 - 2018, the most belonged to the categories: Rescue & EMS (52.1%), Hazardous Condition (11.6%), and Service Call (10.4%).
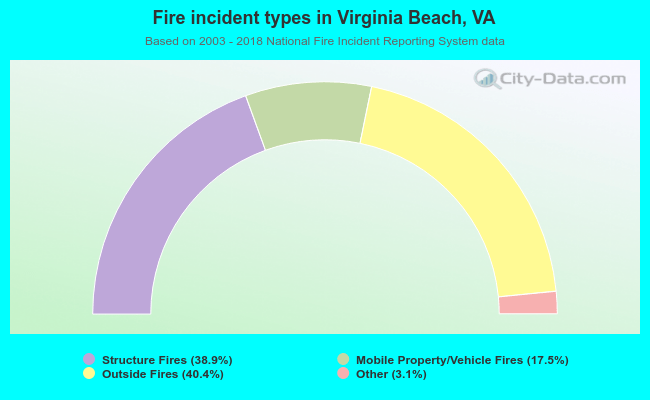 When looking into fire subcategories, the most incidents belonged to: Outside Fires (40.4%), and Structure Fires (38.9%).