Norfolk: Fire Incidents, Virginia (VA)
Where are fire incidents reported in Norfolk, VA
Something went wrong! Please refresh the page.
| Fire incidents reported | |
|---|---|
| Sreet name | Count |
| MILITARY HWY | 654 |
| VIRGINIA BEACH BLVD | 550 |
| LITTLE CREEK RD | 538 |
| TIDEWATER DR | 520 |
| OCEAN VIEW AV | 396 |
| CHESAPEAKE BLVD | 364 |
| GRANBY ST | 326 |
| PRINCESS ANNE RD | 314 |
| HAMPTON BLVD | 236 |
| SEWELLS POINT RD | 208 |
| I-64E HWY | 158 |
| AZALEA GARDEN RD | 150 |
| I64E HWY | 142 |
| OCEAN VIEW | 138 |
| BALLENTINE BLVD | 126 |
| I64W HWY | 122 |
| I-64W HWY | 118 |
| CHURCH ST | 110 |
| 38TH ST | 108 |
| BRAMBLETON AV | 100 |
| 27TH ST | 98 |
| KEMPSVILLE RD | 98 |
| 29TH ST | 96 |
| 26TH ST | 92 |
| MONTICELLO AV | 92 |
| KIMBALL TER | 90 |
| COLONIAL AV | 88 |
| GOFF ST | 88 |
| NORTHAMPTON BLVD | 88 |
| BAYVIEW BLVD | 86 |
| Other | 4,718 |
2003 - 2018 National Fire Incident Reporting System (NFIRS) incidents
- Incident types reported to NFIRS in Norfolk, VA
- 173,10873.6%Rescue & EMS
- 16,0466.8%Hazardous Condition
- 14,2496.1%False Alarm
- 11,0124.7%Fire
- 10,3374.4%Good Intent Call
- 10,0314.3%Service Call
- Fire incident types reported to NFIRS in Norfolk, VA
- 4,27638.8%Outside Fires
- 3,38530.7%Structure Fires
- 2,57023.3%Mobile Property/Vehicle Fires
- 7817.1%Other
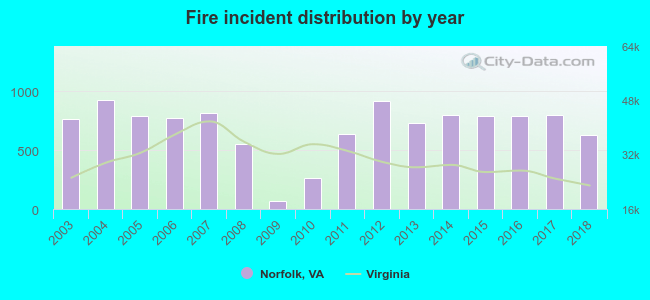 According to the data from the years 2003 - 2018 the average number of fire incidents per year is 688. The highest number of reported fires - 921 took place in 2004, and the least - 66 in 2009. The data has a declining trend.
The average number of yearly fire incidents per 10k residents in Norfolk, VA compared to nearest cities:
(Note: Based on data for the last 3 years, including only cities with population 5,000 and above)
| Norfolk: | 30.1 |
| Brambleton: | 3.6 |
| Meadowbrook: | 8.5 |
| Portsmouth: | 39.2 |
| Chesapeake: | 18.5 |
| Virginia Beach: | 14.1 |
| Hampton: | 28.4 |
| Newport News: | 28.0 |
| Poquoson: | 23.2 |
 The median response time based on all reported fire incidents is 4 minutes. This is lower than the state median value.
The median response time in Norfolk, VA compared to nearest cities:
(Note: Based on data for all years, including only cities with at least 500 fire incidents)
| Norfolk: | 4 minutes |
| Portsmouth: | 5 minutes |
| Chesapeake: | 7 minutes |
| Virginia Beach: | 7 minutes |
| Hampton: | 5 minutes |
| Newport News: | 5 minutes |
| Poquoson: | 4 minutes |
| Smithfield: | 7 minutes |
| Suffolk: | 6 minutes |
 Based on the data from the years 2003 - 2018 the average number of fire-related fatalities per year is 1. The highest number of deaths - 4 took place in 2005, and the lowest - 0 in 2003. The data has an increasing trend.
The average number of deaths per 1,000 fires is 1. This indicator was the highest - 5 in 2005, and the lowest 0 in 2003. The trend for deaths per 1,000 fire incidents is growing. Compared to the state value the number of deaths per 1,000 fires is much lower.
Based on the data from the years 2003 - 2018 the average number of fire-related fatalities per year is 1. The highest number of deaths - 4 took place in 2005, and the lowest - 0 in 2003. The data has an increasing trend.
The average number of deaths per 1,000 fires is 1. This indicator was the highest - 5 in 2005, and the lowest 0 in 2003. The trend for deaths per 1,000 fire incidents is growing. Compared to the state value the number of deaths per 1,000 fires is much lower.Deaths per 1,000 incidents in Norfolk, VA compared to nearest cities:
(Note: Based on data for all years, including only cities with at least 2,500 fire incidents)
| Norfolk: | 1.0 |
| Portsmouth: | 2.1 |
| Chesapeake: | 2.6 |
| Virginia Beach: | 3.1 |
| Hampton: | 2.5 |
| Newport News: | 2.1 |
| Suffolk: | 1.7 |
| Williamsburg: | 2.2 |
| Elizabeth City: | 0.4 |
 Based on the reports from the years 2003 - 2018 the average number of fire-related casualties per year is 6. The highest number of casualties - 16 took place in 2003, and the lowest - 0 in 2014. The data has a dropping trend.
The average number of injuries per 1,000 fires is 12. This indicator was the highest - 45 in 2009, and the lowest 0 in 2014. The trend for casualties per 1,000 fire incidents is rising. Compared to the state value the number of injuries per 1,000 fire incidents is lower.
Based on the reports from the years 2003 - 2018 the average number of fire-related casualties per year is 6. The highest number of casualties - 16 took place in 2003, and the lowest - 0 in 2014. The data has a dropping trend.
The average number of injuries per 1,000 fires is 12. This indicator was the highest - 45 in 2009, and the lowest 0 in 2014. The trend for casualties per 1,000 fire incidents is rising. Compared to the state value the number of injuries per 1,000 fire incidents is lower.Casualties per 1,000 incidents in Norfolk, VA compared to nearest cities:
(Note: Based on data for all years, including only cities with at least 500 fire incidents)
| Norfolk: | 9.0 |
| Portsmouth: | 3.9 |
| Chesapeake: | 37.9 |
| Virginia Beach: | 41.3 |
| Hampton: | 19.6 |
| Newport News: | 39.0 |
| Poquoson: | 17.4 |
| Smithfield: | 4.9 |
| Suffolk: | 5.5 |
 30.1% incidents where reported in the morning and 69.9% in the evening. The most fires (15.2%) took place on Sunday, and the least (13.4%) on Wednesday.
 Based on the 11,012 reports from years 2003 - 2018 most fires (10.2%) took place during July, and the least (6.6%) in January.
 Out of all 235,273 cases reported during the years 2003 - 2018, the most belonged to the categories: Rescue & EMS (73.6%), Hazardous Condition (6.8%), and False Alarm (6.1%).
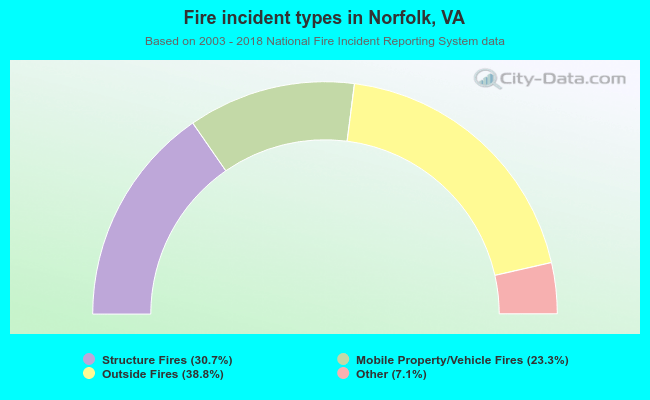 When looking into fire subcategories, the most incidents belonged to: Outside Fires (38.8%), and Structure Fires (30.7%).