Portsmouth: Fire Incidents, Virginia (VA)
Where are fire incidents reported in Portsmouth, VA
Something went wrong! Please refresh the page.
| Fire incidents reported | |
|---|---|
| Sreet name | Count |
| HIGH ST | 546 |
| VICTORY BLVD | 534 |
| MADISON ST | 340 |
| PORTSMOUTH BLVD | 302 |
| FREDERICK BLVD | 296 |
| GEORGE WASHINGTON HWY | 294 |
| COUNTY ST | 254 |
| WILSON PKWY | 236 |
| AIRLINE BLVD | 234 |
| ELM AVE | 182 |
| TURNPIKE RD | 166 |
| DALE DR | 154 |
| DEEP CREEK BLVD | 144 |
| LONDON BLVD | 144 |
| EFFINGHAM ST | 142 |
| GREENWOOD DR | 140 |
| WEST NORFOLK RD | 130 |
| COLUMBUS AVE | 124 |
| SOUTH ST | 116 |
| MT VERNON AVE | 110 |
| CAVALIER BLVD | 106 |
| CEDAR LN | 102 |
| I-264 | 102 |
| KING ST | 96 |
| LEXINGTON DR | 92 |
| COURT ST | 90 |
| DUNEDIN RD | 88 |
| CHEROKEE RD | 86 |
| TOWNE POINT RD | 86 |
| BROAD ST | 82 |
| Other | 2,894 |
2002 - 2018 National Fire Incident Reporting System (NFIRS) incidents
- Incident types reported to NFIRS in Portsmouth, VA
- 71,10866.7%Rescue & EMS
- 8,4127.9%Fire
- 7,7647.3%Hazardous Condition
- 7,6717.2%Service Call
- 6,3806.0%Good Intent Call
- 5,0004.7%False Alarm
- 1140.1%Overpressure Rupture
- 1070.1%Special Incident
- Fire incident types reported to NFIRS in Portsmouth, VA
- 3,52641.9%Structure Fires
- 3,33639.7%Outside Fires
- 1,41916.9%Mobile Property/Vehicle Fires
- 1311.6%Other
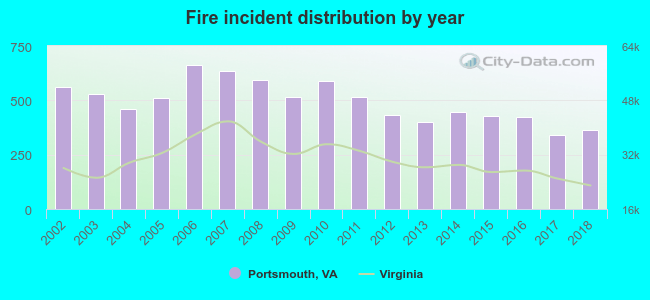 According to the data from the years 2002 - 2018 the average number of fire incidents per year is 495. The highest number of fire incidents - 664 took place in 2006, and the least - 341 in 2017. The data has a decreasing trend.
The average number of yearly fire incidents per 10k residents in Portsmouth, VA compared to nearest cities:
(Note: Based on data for the last 3 years, including only cities with population 5,000 and above)
| Portsmouth: | 39.2 |
| Brambleton: | 3.6 |
| Chesapeake: | 18.5 |
| Norfolk: | 30.1 |
| Meadowbrook: | 8.5 |
| Hampton: | 28.4 |
| Virginia Beach: | 14.1 |
| Suffolk: | 23.3 |
| Smithfield: | 57.1 |
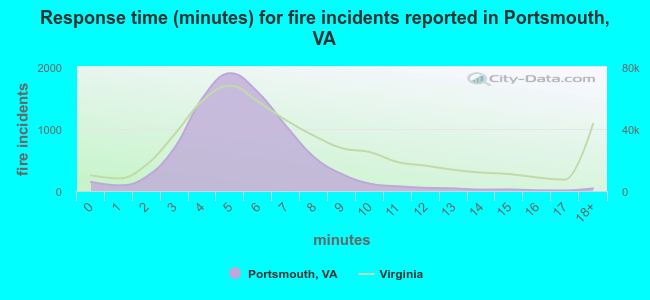 The median response time based on all reported fire incidents is 5 minutes. This is lower than the state median value.
The median response time in Portsmouth, VA compared to nearest cities:
(Note: Based on data for all years, including only cities with at least 500 fire incidents)
| Portsmouth: | 5 minutes |
| Chesapeake: | 7 minutes |
| Norfolk: | 4 minutes |
| Hampton: | 5 minutes |
| Virginia Beach: | 7 minutes |
| Suffolk: | 6 minutes |
| Smithfield: | 7 minutes |
| Newport News: | 5 minutes |
| Poquoson: | 4 minutes |
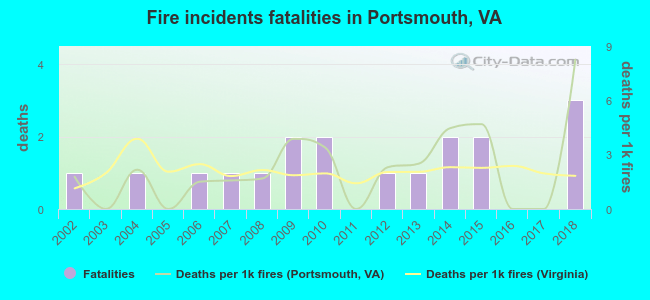 According to the data from the years 2002 - 2018 the average number of fire-related yearly deaths is 1. The highest number of deaths - 3 took place in 2018, and the lowest - 0 in 2003. The data has a rising trend.
The average number of deaths per 1,000 fire incidents is 2. This indicator was the highest - 8 in 2018, and the lowest 0 in 2003. The trend for deaths per 1,000 incidents is increasing. Compared to the Virginia value the number of fatalities per 1,000 incidents is about the same.
According to the data from the years 2002 - 2018 the average number of fire-related yearly deaths is 1. The highest number of deaths - 3 took place in 2018, and the lowest - 0 in 2003. The data has a rising trend.
The average number of deaths per 1,000 fire incidents is 2. This indicator was the highest - 8 in 2018, and the lowest 0 in 2003. The trend for deaths per 1,000 incidents is increasing. Compared to the Virginia value the number of fatalities per 1,000 incidents is about the same.Deaths per 1,000 incidents in Portsmouth, VA compared to nearest cities:
(Note: Based on data for all years, including only cities with at least 2,500 fire incidents)
| Portsmouth: | 2.1 |
| Chesapeake: | 2.6 |
| Norfolk: | 1.0 |
| Hampton: | 2.5 |
| Virginia Beach: | 3.1 |
| Suffolk: | 1.7 |
| Newport News: | 2.1 |
| Williamsburg: | 2.2 |
| Elizabeth City: | 0.4 |
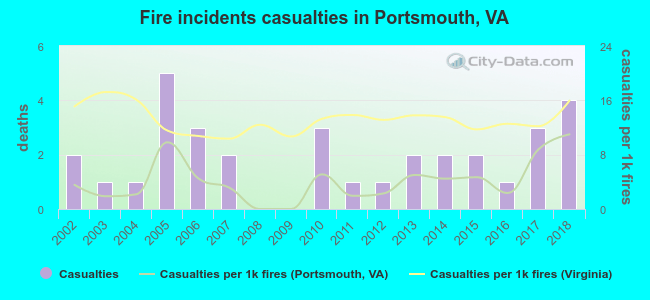 Based on the data from the years 2002 - 2018 the average number of fire-related casualties per year is 2. The highest number of casualties - 5 took place in 2005, and the lowest - 0 in 2008. The data has an increasing trend.
The average number of casualties per 1,000 fire incidents is 4. This indicator was the highest - 11 in 2018, and the lowest 0 in 2008. The trend for injuries per 1,000 fire incidents is increasing. Compared to the Virginia value the number of casualties per 1,000 fire incidents is much lower.
Based on the data from the years 2002 - 2018 the average number of fire-related casualties per year is 2. The highest number of casualties - 5 took place in 2005, and the lowest - 0 in 2008. The data has an increasing trend.
The average number of casualties per 1,000 fire incidents is 4. This indicator was the highest - 11 in 2018, and the lowest 0 in 2008. The trend for injuries per 1,000 fire incidents is increasing. Compared to the Virginia value the number of casualties per 1,000 fire incidents is much lower.Casualties per 1,000 incidents in Portsmouth, VA compared to nearest cities:
(Note: Based on data for all years, including only cities with at least 500 fire incidents)
| Portsmouth: | 3.9 |
| Chesapeake: | 37.9 |
| Norfolk: | 9.0 |
| Hampton: | 19.6 |
| Virginia Beach: | 41.3 |
| Suffolk: | 5.5 |
| Smithfield: | 4.9 |
| Newport News: | 39.0 |
| Poquoson: | 17.4 |
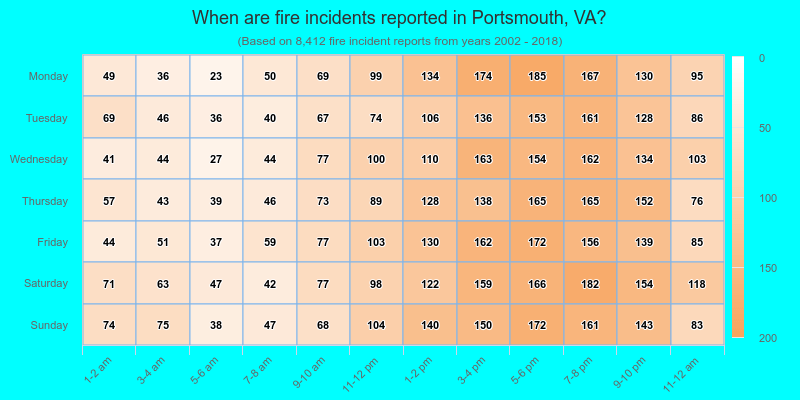
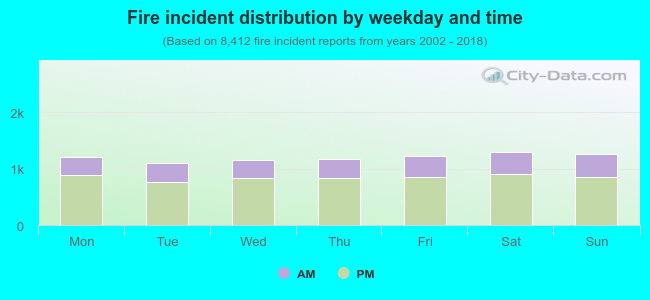 29.9% incidents where reported in the morning and 70.1% in the evening. The most fires (15.4%) took place on Saturday, and the least (13.1%) on Tuesday.
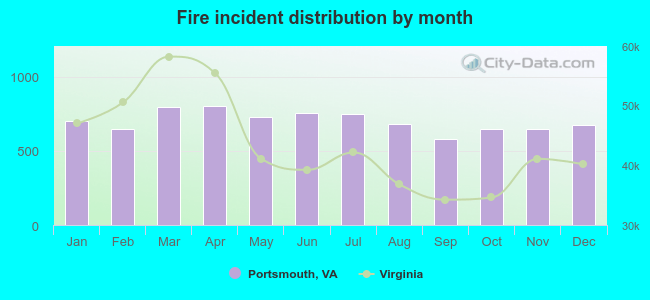 According to the 8,412 fires from years 2002 - 2018 most fires (9.6%) took place during April, and the least (6.9%) in September.
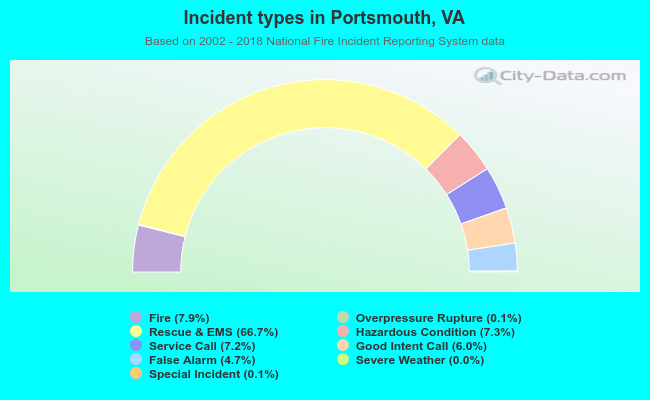 Out of all 106,584 cases reported during the years 2002 - 2018, the most belonged to the categories: Rescue & EMS (66.7%), Fire (7.9%), and Hazardous Condition (7.3%).
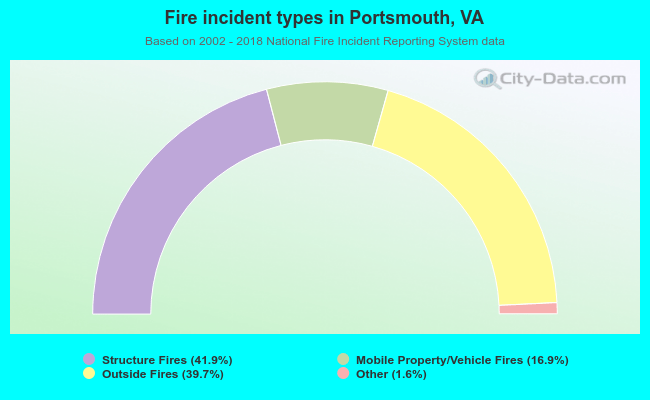 When looking into fire subcategories, the most incidents belonged to: Structure Fires (41.9%), and Outside Fires (39.7%).