Elizabeth City: Fire Incidents, North Carolina (NC)
Where are fire incidents reported in Elizabeth City, NC
Something went wrong! Please refresh the page.
| Fire incidents reported | |
|---|---|
| Sreet name | Count |
| ROAD ST | 206 |
| EHRINGHAUS ST | 158 |
| NORTHSIDE RD | 140 |
| MAIN ST | 138 |
| WEEKSVILLE RD | 138 |
| US 17 HWY | 122 |
| HUGHES BLVD | 114 |
| NIXONTON RD | 112 |
| PEARTREE RD | 76 |
| US 158 HWY | 72 |
| HALSTEAD BLVD | 62 |
| MILLPOND RD | 58 |
| WALKERS AVE | 58 |
| RIVER RD | 54 |
| SALEM CHURCH RD | 46 |
| CREEK RD | 44 |
| SOUNDNECK RD | 44 |
| BODY RD | 42 |
| OAK STUMP RD | 42 |
| OKISKO RD | 42 |
| SIMPSON DITCH RD | 42 |
| CROOKED RUN RD | 40 |
| TURNPIKE RD | 40 |
| OLIVET CIR | 38 |
| ROANOKE AVE | 36 |
| BURGESS ST | 34 |
| LAMBS GROVE RD | 34 |
| PARKVIEW DR | 32 |
| BROAD ST | 30 |
| PITTS CHAPEL RD | 30 |
| Other | 634 |
2002 - 2018 National Fire Incident Reporting System (NFIRS) incidents
- Incident types reported to NFIRS in Elizabeth City, NC
- 4,66934.6%Hazardous Condition
- 2,75820.4%Fire
- 2,47018.3%Rescue & EMS
- 1,69112.5%False Alarm
- 1,0397.7%Good Intent Call
- 7705.7%Service Call
- 610.5%Severe Weather
- 280.2%Overpressure Rupture
- Fire incident types reported to NFIRS in Elizabeth City, NC
- 1,08739.4%Structure Fires
- 1,05738.3%Outside Fires
- 51518.7%Mobile Property/Vehicle Fires
- 993.6%Other
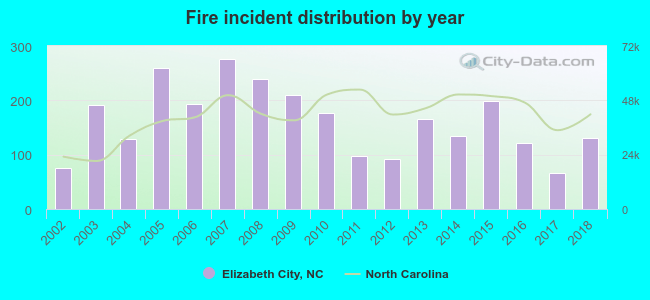 According to the data from the years 2002 - 2018 the average number of fire incidents per year is 162. The highest number of reported fire incidents - 276 took place in 2007, and the least - 67 in 2017. The data has a rising trend.
The average number of yearly fire incidents per 10k residents in Elizabeth City, NC compared to nearest cities:
(Note: Based on data for the last 3 years, including only cities with population 5,000 and above)
| Elizabeth City: | 58.9 |
| Kill Devil Hills: | 66.4 |
| Williamston: | 114.0 |
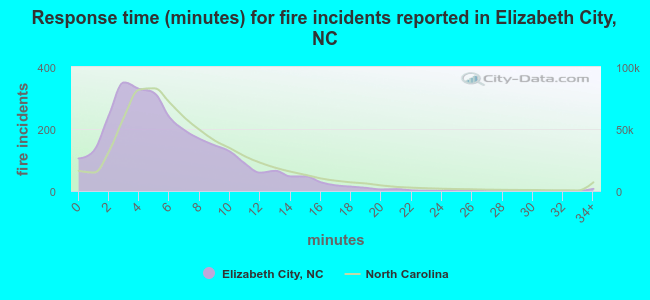 The median response time based on all reported fire incidents is 5 minutes. This is lower than the state median value.
The median response time in Elizabeth City, NC compared to nearest cities:
(Note: Based on data for all years, including only cities with at least 500 fire incidents)
| Elizabeth City: | 5 minutes |
| Hertford: | 11 minutes |
| Edenton: | 6 minutes |
| Kitty Hawk: | 6 minutes |
| Kill Devil Hills: | 5 minutes |
| Plymouth: | 7 minutes |
| Nags Head: | 6 minutes |
| Ahoskie: | 6 minutes |
| Williamston: | 5 minutes |
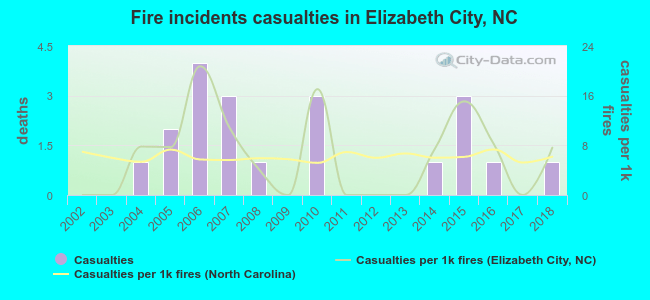 Based on the reports from the years 2002 - 2018 the average number of fire-related casualties per year is 1. The highest number of injuries - 4 took place in 2006, and the lowest - 0 in 2002. The data has a rising trend.
The average number of casualties per 1,000 fire incidents is 6. This indicator was the highest - 21 in 2006, and the lowest 0 in 2002. The trend for casualties per 1,000 incidents is increasing. Compared to the North Carolina value the number of casualties per 1,000 fire incidents is about the same.
Based on the reports from the years 2002 - 2018 the average number of fire-related casualties per year is 1. The highest number of injuries - 4 took place in 2006, and the lowest - 0 in 2002. The data has a rising trend.
The average number of casualties per 1,000 fire incidents is 6. This indicator was the highest - 21 in 2006, and the lowest 0 in 2002. The trend for casualties per 1,000 incidents is increasing. Compared to the North Carolina value the number of casualties per 1,000 fire incidents is about the same.Casualties per 1,000 incidents in Elizabeth City, NC compared to nearest cities:
(Note: Based on data for all years, including only cities with at least 500 fire incidents)
| Elizabeth City: | 7.3 |
| Hertford: | 1.2 |
| Edenton: | 4.4 |
| Kitty Hawk: | 0.0 |
| Kill Devil Hills: | 9.3 |
| Plymouth: | 0.0 |
| Nags Head: | 8.5 |
| Ahoskie: | 15.9 |
| Williamston: | 13.8 |
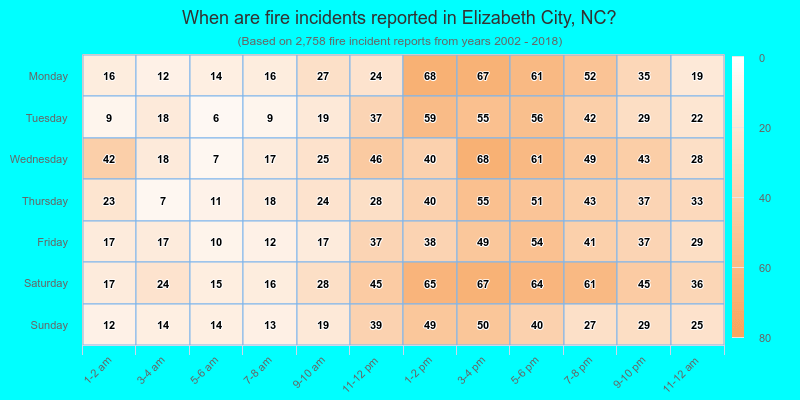
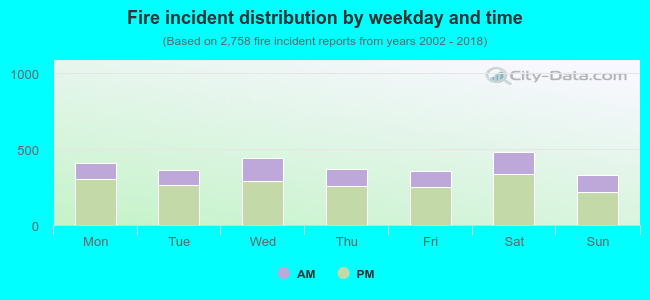 30.4% incidents where reported in the morning and 69.6% in the evening. The most fires (17.5%) took place on Saturday, and the least (12.0%) on Sunday.
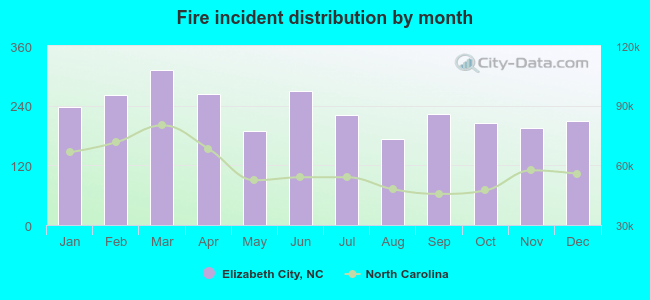 According to the 2,758 fire incidents from years 2002 - 2018 most fires (11.3%) took place during March, and the least (6.2%) in August.
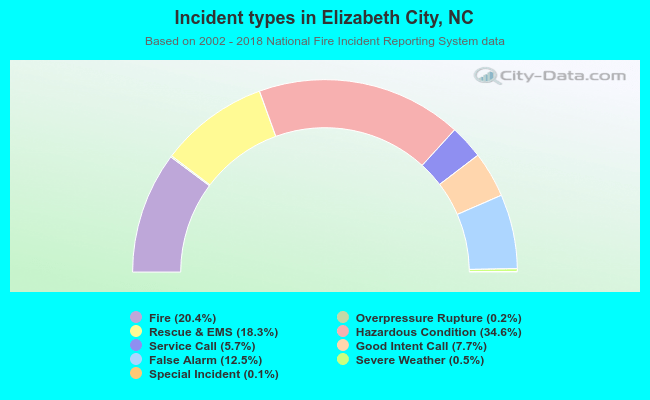 Out of all 13,496 cases reported during the years 2002 - 2018, the most belonged to the categories: Hazardous Condition (34.6%), Fire (20.4%), and Rescue & EMS (18.3%).
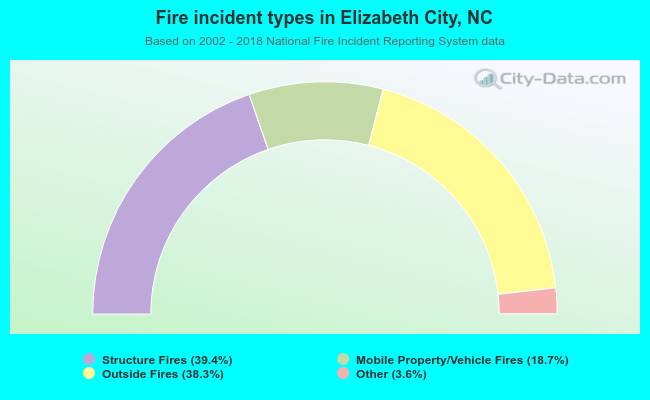 When looking into fire subcategories, the most reports belonged to: Structure Fires (39.4%), and Outside Fires (38.3%).