Shelton: Fire Incidents, Washington (WA)
Where are fire incidents reported in Shelton, WA
Something went wrong! Please refresh the page.
| Fire incidents reported | |
|---|---|
| Sreet name | Count |
| US HIGHWAY 101 | 234 |
| RAILROAD AVE | 188 |
| JOHNS PRAIRIE RD | 184 |
| STATE ROUTE 3 | 132 |
| OLYMPIC HWY | 120 |
| ARCADIA RD | 118 |
| WALLACE KNEELAND BLVD | 118 |
| FRONT ST | 102 |
| SHELTON SPRINGS RD | 90 |
| FRANKLIN ST | 88 |
| 1ST ST | 84 |
| AGATE RD | 84 |
| BROCKDALE RD | 78 |
| LYNCH RD | 76 |
| 13TH ST | 66 |
| EELLS HILL RD | 58 |
| STATE ROUTE 108 | 58 |
| COTA ST | 56 |
| OLD OLYMPIC HWY | 56 |
| W CLOQUALLUM RD | 56 |
| SHELTON MATLOCK RD | 54 |
| CLOQUALLUM RD | 52 |
| DAYTON AIRPORT RD | 50 |
| SKOKOMISH VALLEY RD | 50 |
| 5TH ST | 46 |
| HIGHLAND RD | 46 |
| TURNER AVE | 46 |
| ISLAND LAKE DR | 44 |
| COLE RD | 40 |
| ELLINOR AVE | 40 |
| Other | 1,874 |
2002 - 2018 National Fire Incident Reporting System (NFIRS) incidents
- Incident types reported to NFIRS in Shelton, WA
- 19,37560.5%Rescue & EMS
- 4,38813.7%Fire
- 2,6418.3%Good Intent Call
- 2,5538.0%Service Call
- 1,4044.4%Hazardous Condition
- 1,3834.3%False Alarm
- 1740.5%Severe Weather
- 760.2%Special Incident
- Fire incident types reported to NFIRS in Shelton, WA
- 1,83041.7%Structure Fires
- 1,65637.7%Outside Fires
- 50711.6%Mobile Property/Vehicle Fires
- 3959.0%Other
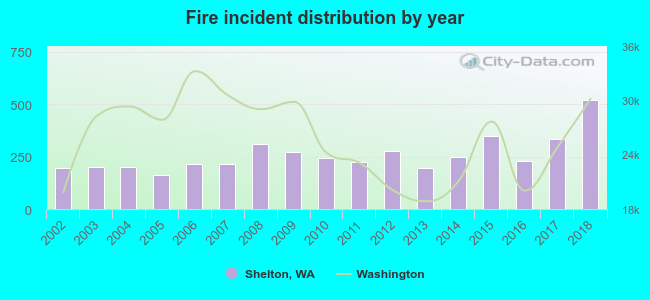 Based on the data from the years 2002 - 2018 the average number of fires per year is 258. The highest number of reported fires - 519 took place in 2018, and the least - 163 in 2005. The data has a growing trend.
The average number of yearly fire incidents per 10k residents in Shelton, WA compared to nearest cities:
(Note: Based on data for the last 3 years, including only cities with population 5,000 and above)
| Shelton: | 368.9 |
| Olympic: | 1.6 |
| Olympia: | 118.4 |
| Tumwater: | 58.6 |
| Tahuya: | 32.4 |
| Belfair: | 138.8 |
| Lacey: | 35.4 |
| DuPont: | 2.9 |
| Steilacoom: | 8.1 |
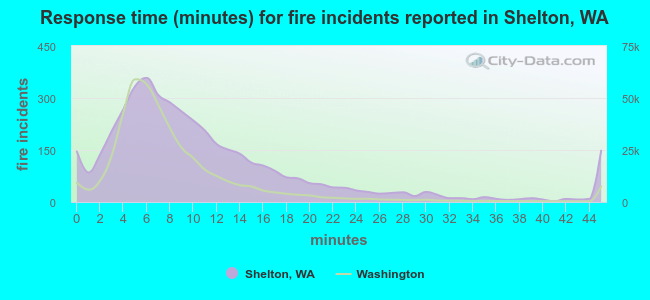 The median response time based on all reported fire incidents is 9 minutes. This is higher than the Washington median value.
The median response time in Shelton, WA compared to nearest cities:
(Note: Based on data for all years, including only cities with at least 500 fire incidents)
| Shelton: | 9 minutes |
| Hoodsport: | 14 minutes |
| Olympia: | 7 minutes |
| Tumwater: | 7 minutes |
| Belfair: | 9 minutes |
| Lacey: | 6 minutes |
| Elma: | 10 minutes |
| Gig Harbor: | 9 minutes |
| University Place: | 6 minutes |
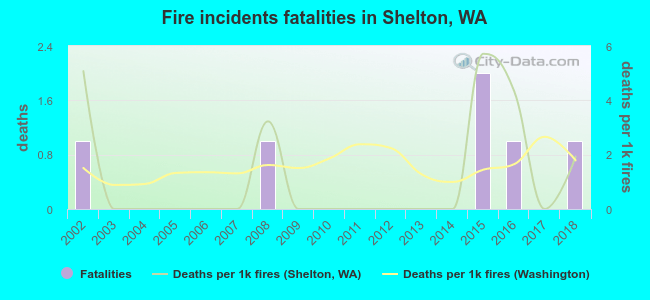 According to the reports from the years 2002 - 2018 the average number of fire-related yearly deaths is 0. The highest number of deaths - 2 took place in 2015, and the lowest - 0 in 2003. The data has a constant trend.
The average number of deaths per 1,000 fires is 1. This indicator was the highest - 6 in 2015, and the lowest 0 in 2003. The trend for deaths per 1,000 incidents is dropping. Compared to the Washington value the number of fatalities per 1,000 fires is similar.
According to the reports from the years 2002 - 2018 the average number of fire-related yearly deaths is 0. The highest number of deaths - 2 took place in 2015, and the lowest - 0 in 2003. The data has a constant trend.
The average number of deaths per 1,000 fires is 1. This indicator was the highest - 6 in 2015, and the lowest 0 in 2003. The trend for deaths per 1,000 incidents is dropping. Compared to the Washington value the number of fatalities per 1,000 fires is similar.Deaths per 1,000 incidents in Shelton, WA compared to nearest cities:
(Note: Based on data for all years, including only cities with at least 2,500 fire incidents)
| Shelton: | 1.4 |
| Olympia: | 1.4 |
| Lakewood: | 2.6 |
| Tacoma: | 0.5 |
| Port Orchard: | 4.8 |
| Bremerton: | 3.3 |
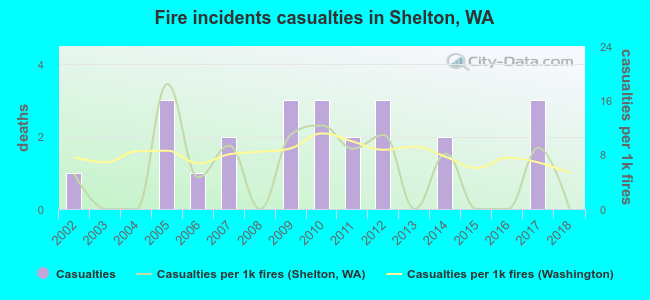 According to the data from the years 2002 - 2018 the average number of fire-related casualties per year is 1. The highest number of casualties - 3 took place in 2005, and the lowest - 0 in 2003. The data has a decreasing trend.
The average number of injuries per 1,000 fires is 6. This indicator was the highest - 18 in 2005, and the lowest 0 in 2003. The trend for casualties per 1,000 incidents is decreasing. Compared to the Washington value the number of casualties per 1,000 fires is lower.
According to the data from the years 2002 - 2018 the average number of fire-related casualties per year is 1. The highest number of casualties - 3 took place in 2005, and the lowest - 0 in 2003. The data has a decreasing trend.
The average number of injuries per 1,000 fires is 6. This indicator was the highest - 18 in 2005, and the lowest 0 in 2003. The trend for casualties per 1,000 incidents is decreasing. Compared to the Washington value the number of casualties per 1,000 fires is lower.Casualties per 1,000 incidents in Shelton, WA compared to nearest cities:
(Note: Based on data for all years, including only cities with at least 500 fire incidents)
| Shelton: | 5.2 |
| Hoodsport: | 0.0 |
| Olympia: | 4.6 |
| Tumwater: | 6.6 |
| Belfair: | 5.1 |
| Lacey: | 3.6 |
| Elma: | 0.0 |
| Gig Harbor: | 15.1 |
| University Place: | 2.5 |
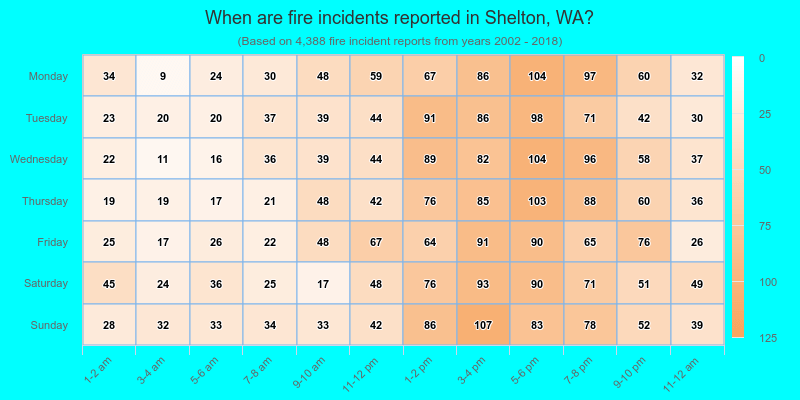
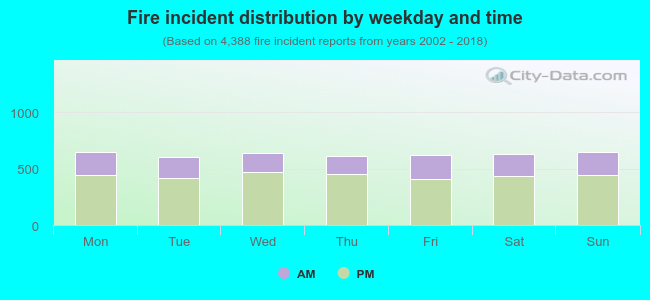 30.2% incidents where reported in the morning and 69.8% in the evening. The most fires (14.8%) took place on Monday, and the least (13.7%) on Tuesday.
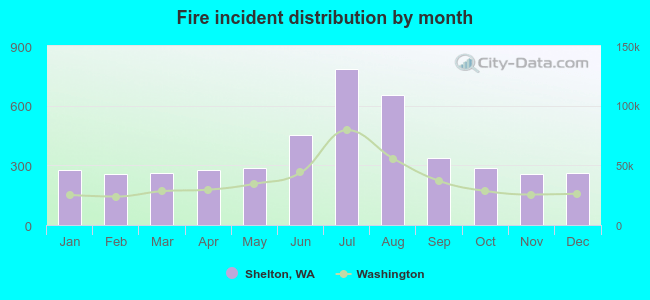 According to the 4,388 incident reports from years 2002 - 2018 most fires (17.9%) took place during July, and the least (5.8%) in February.
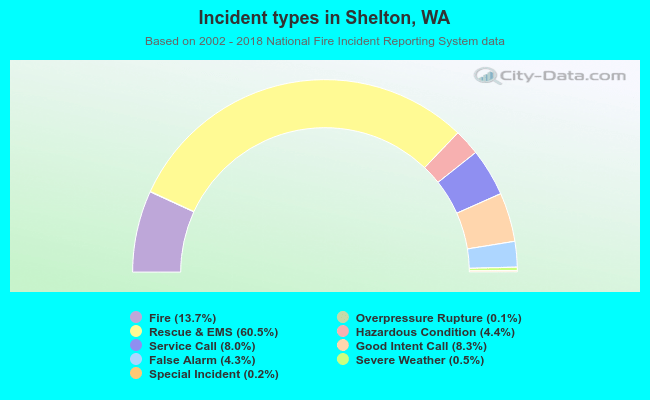 Out of all 32,012 cases reported during the years 2002 - 2018, the most belonged to the categories: Rescue & EMS (60.5%), Fire (13.7%), and Good Intent Call (8.3%).
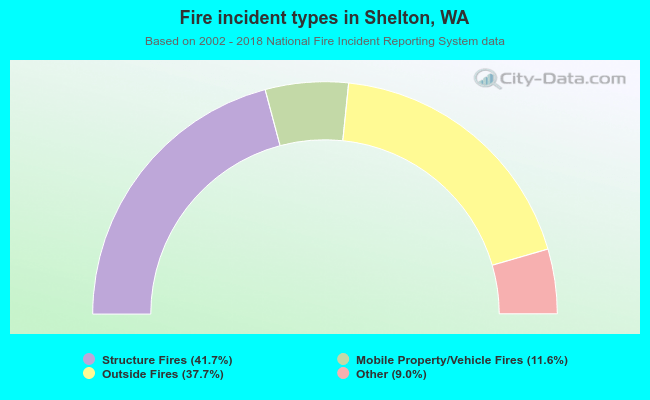 When looking into fire subcategories, the most incidents belonged to: Structure Fires (41.7%), and Outside Fires (37.7%).