DuPont: Fire Incidents, Washington (WA)
Where are fire incidents reported in DuPont, WA
Something went wrong! Please refresh the page.
|
| |||||||||||||||||||||||||||||||||||||||||||||||||||||||||||||||||||||||||||||||||||||||||||||||||||||||||||||
2002 - 2018 National Fire Incident Reporting System (NFIRS) incidents
- Incident types reported to NFIRS in DuPont, WA
- 30435.1%Rescue & EMS
- 21124.3%Fire
- 12214.1%Service Call
- 11713.5%Hazardous Condition
- 546.2%Good Intent Call
- 485.5%False Alarm
- 70.8%Special Incident
- 30.3%Overpressure Rupture
- 10.1%Severe Weather
- Fire incident types reported to NFIRS in DuPont, WA
- 10851.2%Outside Fires
- 6128.9%Structure Fires
- 2110.0%Mobile Property/Vehicle Fires
- 2110.0%Other
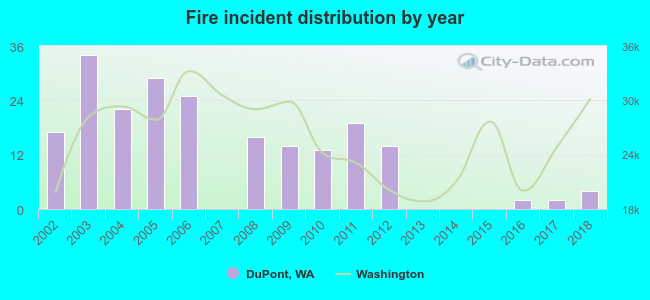 According to the data from the years 2002 - 2018 the average number of fires per year is 12. The highest number of reported fire incidents - 34 took place in 2003, and the least - 0 in 2007. The data has a decreasing trend.
The average number of yearly fire incidents per 10k residents in DuPont, WA compared to nearest cities:
(Note: Based on data for the last 3 years, including only cities with population 5,000 and above)
| DuPont: | 2.9 |
| Steilacoom: | 8.1 |
| Lakewood: | 25.9 |
| Lacey: | 35.4 |
| University Place: | 13.1 |
| Parkland: | 53.9 |
| Spanaway: | 42.1 |
| Fircrest: | 9.5 |
| Yelm: | 167.0 |

 26.1% incidents where reported in the morning and 73.9% in the evening. The most fires (22.3%) took place on Sunday, and the least (7.1%) on Monday.
 According to the 211 fires from years 2002 - 2018 most fires (26.5%) took place during July, and the least (2.8%) in February.
 Out of all 867 cases reported during the years 2002 - 2018, the most belonged to the categories: Rescue & EMS (35.1%), Fire (24.3%), and Service Call (14.1%).
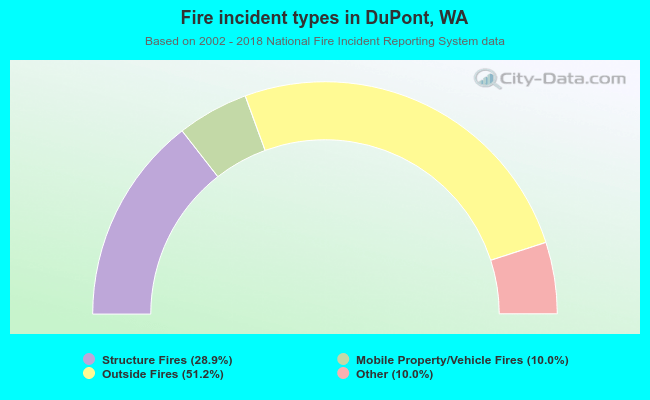 When looking into fire subcategories, the most incidents belonged to: Outside Fires (51.2%), and Structure Fires (28.9%).