Port Orchard: Fire Incidents, Washington (WA)
Where are fire incidents reported in Port Orchard, WA
Something went wrong! Please refresh the page.
| Fire incidents reported | |
|---|---|
| Sreet name | Count |
| BAY ST | 164 |
| SEDGWICK RD | 140 |
| SIDNEY AVE | 140 |
| BETHEL RD | 134 |
| LUND AVE | 122 |
| SIDNEY RD | 110 |
| MILE HILL DR | 108 |
| GLENWOOD RD | 82 |
| STATE HY 3 HWY | 80 |
| MADRONA DR | 76 |
| STATE HWY 16 HWY | 74 |
| BETHEL BURLEY RD | 66 |
| STATE HWY 16 | 66 |
| BETHEL AVE | 62 |
| BEACH DR | 56 |
| POTTERY AVE | 56 |
| LONG LAKE RD | 54 |
| PHILLIPS RD | 54 |
| STATE HWY 3 | 54 |
| OLD CLIFTON RD | 50 |
| OLNEY AVE | 50 |
| FIRCREST DR | 48 |
| HARRISON AVE | 46 |
| LIPPERT DR | 46 |
| ORLANDO ST | 44 |
| BANNER RD | 42 |
| MITCHELL AVE | 42 |
| PINE RD | 42 |
| CALIFORNIA AVE | 40 |
| MULLENIX RD | 36 |
| Other | 909 |
2002 - 2018 National Fire Incident Reporting System (NFIRS) incidents
- Incident types reported to NFIRS in Port Orchard, WA
- 31,57557.5%Rescue & EMS
- 8,81816.1%Service Call
- 5,55810.1%Good Intent Call
- 3,5186.4%Hazardous Condition
- 3,0935.6%Fire
- 2,0393.7%False Alarm
- 920.2%Severe Weather
- 890.2%Overpressure Rupture
- 840.2%Special Incident
- Fire incident types reported to NFIRS in Port Orchard, WA
- 1,21839.4%Structure Fires
- 1,16537.7%Outside Fires
- 62520.2%Mobile Property/Vehicle Fires
- 852.7%Other
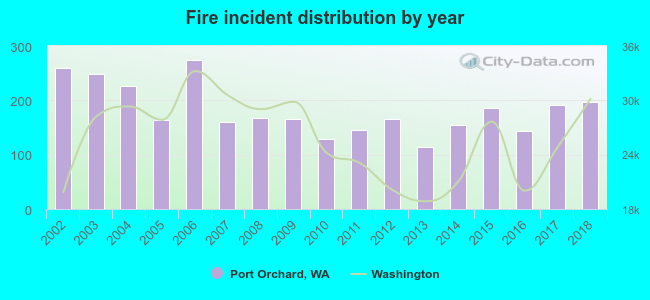 Based on the data from the years 2002 - 2018 the average number of fires per year is 182. The highest number of fires - 275 took place in 2006, and the least - 114 in 2013. The data has a dropping trend.
The average number of yearly fire incidents per 10k residents in Port Orchard, WA compared to nearest cities:
(Note: Based on data for the last 3 years, including only cities with population 5,000 and above)
| Port Orchard: | 133.7 |
| Bremerton: | 80.3 |
| Manchester: | 1.8 |
| Silverdale: | 41.8 |
| Bainbridge Island: | 19.9 |
| Vashon: | 33.6 |
| Belfair: | 138.8 |
| Gig Harbor: | 86.8 |
| Poulsbo: | 74.6 |
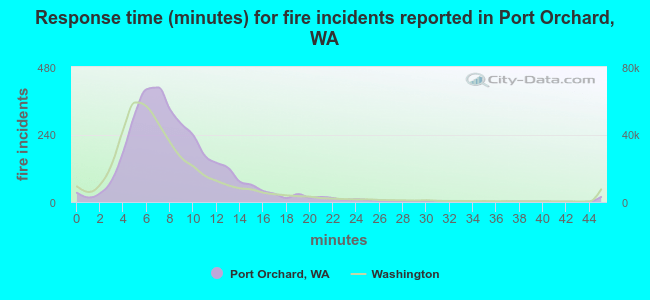 The median response time based on all reported fire incidents is 8 minutes. This is about the same as the Washington median value.
The median response time in Port Orchard, WA compared to nearest cities:
(Note: Based on data for all years, including only cities with at least 500 fire incidents)
| Port Orchard: | 8 minutes |
| Bremerton: | 6 minutes |
| Silverdale: | 7 minutes |
| Bainbridge Island: | 7 minutes |
| Vashon: | 8 minutes |
| Belfair: | 9 minutes |
| Gig Harbor: | 9 minutes |
| Poulsbo: | 8 minutes |
| Burien: | 5 minutes |
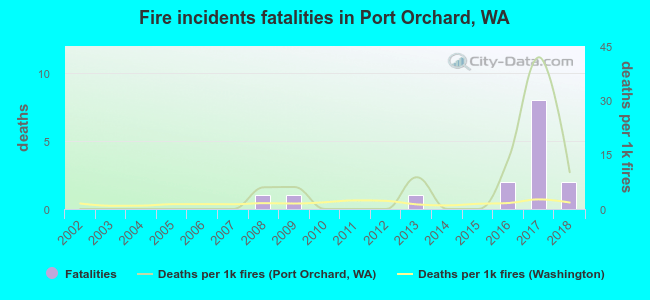 Based on the data from the years 2002 - 2018 the average number of fire-related fatalities per year is 1. The highest number of reported deaths - 8 took place in 2017, and the lowest - 0 in 2002. The data has an increasing trend.
The average number of deaths per 1,000 fires is 5. This indicator was the highest - 42 in 2017, and the lowest 0 in 2002. The trend for deaths per 1,000 incidents is rising. Compared to the state value the number of fatalities per 1,000 fires is much higher.
Based on the data from the years 2002 - 2018 the average number of fire-related fatalities per year is 1. The highest number of reported deaths - 8 took place in 2017, and the lowest - 0 in 2002. The data has an increasing trend.
The average number of deaths per 1,000 fires is 5. This indicator was the highest - 42 in 2017, and the lowest 0 in 2002. The trend for deaths per 1,000 incidents is rising. Compared to the state value the number of fatalities per 1,000 fires is much higher.
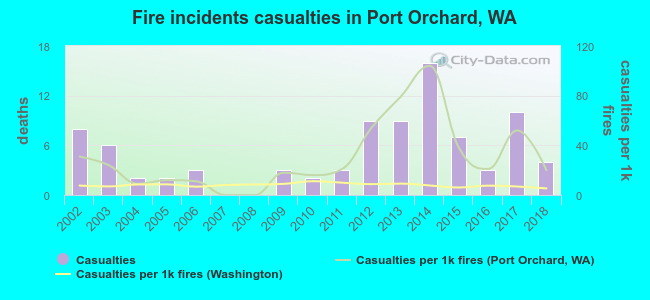 Based on the reports from the years 2002 - 2018 the average number of fire-related yearly casualties is 5. The highest number of reported casualties - 16 took place in 2014, and the lowest - 0 in 2007. The data has a dropping trend.
The average number of casualties per 1,000 fire incidents is 30. This indicator was the highest - 104 in 2014, and the lowest 0 in 2007. The trend for casualties per 1,000 incidents is decreasing. Compared to the Washington value the number of casualties per 1,000 fires is much higher.
Based on the reports from the years 2002 - 2018 the average number of fire-related yearly casualties is 5. The highest number of reported casualties - 16 took place in 2014, and the lowest - 0 in 2007. The data has a dropping trend.
The average number of casualties per 1,000 fire incidents is 30. This indicator was the highest - 104 in 2014, and the lowest 0 in 2007. The trend for casualties per 1,000 incidents is decreasing. Compared to the Washington value the number of casualties per 1,000 fires is much higher.Casualties per 1,000 incidents in Port Orchard, WA compared to nearest cities:
(Note: Based on data for all years, including only cities with at least 500 fire incidents)
| Port Orchard: | 28.1 |
| Bremerton: | 18.6 |
| Silverdale: | 14.6 |
| Bainbridge Island: | 17.7 |
| Vashon: | 3.2 |
| Belfair: | 5.1 |
| Gig Harbor: | 15.1 |
| Poulsbo: | 6.0 |
| Burien: | 14.7 |
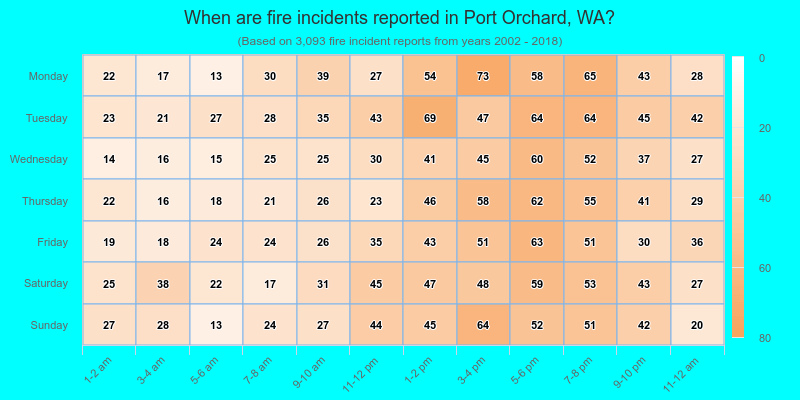
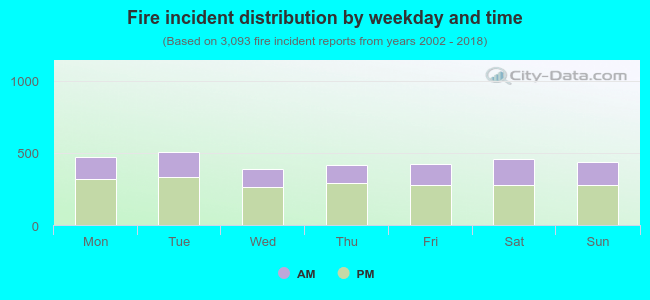 34.4% incidents where reported in the morning and 65.6% in the evening. The most fires (16.4%) took place on Tuesday, and the least (12.5%) on Wednesday.
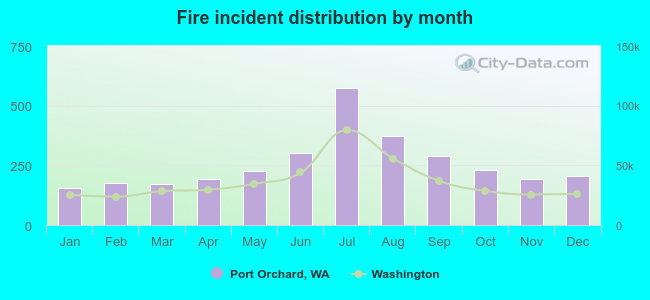 Based on the 3,093 fires from years 2002 - 2018 most fires (18.6%) took place during July, and the least (5.0%) in January.
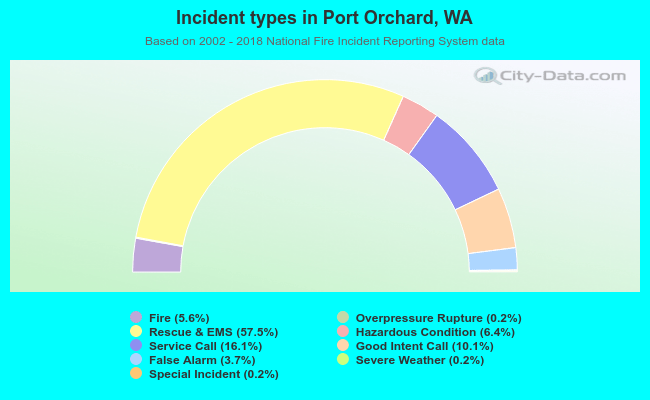 Out of all 54,866 cases reported during the years 2002 - 2018, the most belonged to the categories: Rescue & EMS (57.5%), Service Call (16.1%), and Good Intent Call (10.1%).
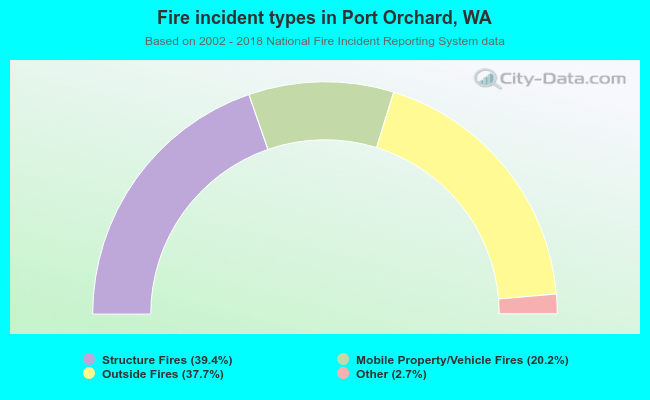 When looking into fire subcategories, the most reports belonged to: Structure Fires (39.4%), and Outside Fires (37.7%).