Olympia: Fire Incidents, Washington (WA)
Where are fire incidents reported in Olympia, WA
Something went wrong! Please refresh the page.
| Fire incidents reported | |
|---|---|
| Sreet name | Count |
| MARTIN WAY | 478 |
| 4TH AVE | 372 |
| COOPER POINT RD | 304 |
| HARRISON AVE | 266 |
| BLACK LAKE BLVD | 260 |
| LILLY RD | 254 |
| PACIFIC AVE | 218 |
| CAPITOL WAY | 212 |
| YELM HWY | 150 |
| WASHINGTON ST | 146 |
| 5TH AVE | 140 |
| FONES RD | 140 |
| LITTLEROCK RD | 134 |
| FERN ST | 130 |
| I5 FWY | 120 |
| STATE AVE | 120 |
| 14TH AVE | 118 |
| CAPITAL MALL DR | 112 |
| STEILACOOM RD | 112 |
| DIVISION ST | 104 |
| SOUTH BAY RD | 102 |
| 7TH AVE | 100 |
| 9TH AVE | 100 |
| 93RD AVE | 98 |
| EVERGREEN PARK DR | 96 |
| LEGION WAY | 92 |
| LIBBY RD | 90 |
| BOSTON HARBOR RD | 86 |
| SLEATER KINNEY RD | 82 |
| MARVIN RD | 80 |
| Other | 3,662 |
2002 - 2018 National Fire Incident Reporting System (NFIRS) incidents
- Incident types reported to NFIRS in Olympia, WA
- 63,54062.8%Rescue & EMS
- 11,71611.6%Good Intent Call
- 8,4788.4%Fire
- 7,2237.1%Service Call
- 5,0185.0%Hazardous Condition
- 5,0105.0%False Alarm
- Fire incident types reported to NFIRS in Olympia, WA
- 3,80644.9%Structure Fires
- 3,11936.8%Outside Fires
- 1,10413.0%Mobile Property/Vehicle Fires
- 4495.3%Other
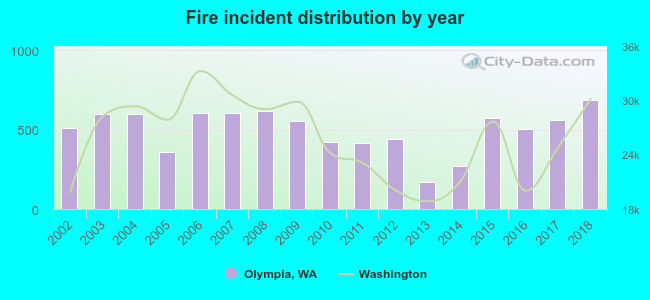 According to the data from the years 2002 - 2018 the average number of fires per year is 499. The highest number of reported fire incidents - 684 took place in 2018, and the least - 168 in 2013. The data has an increasing trend.
The average number of yearly fire incidents per 10k residents in Olympia, WA compared to nearest cities:
(Note: Based on data for the last 3 years, including only cities with population 5,000 and above)
| Olympia: | 118.4 |
| Tumwater: | 58.6 |
| Lacey: | 35.4 |
| DuPont: | 2.9 |
| Yelm: | 167.0 |
| Shelton: | 368.9 |
| Steilacoom: | 8.1 |
| Lakewood: | 25.9 |
| University Place: | 13.1 |
 The median response time based on all reported fire incidents is 7 minutes. This is comparable to the state median value.
The median response time in Olympia, WA compared to nearest cities:
(Note: Based on data for all years, including only cities with at least 500 fire incidents)
| Olympia: | 7 minutes |
| Tumwater: | 7 minutes |
| Lacey: | 6 minutes |
| Tenino: | 10 minutes |
| Yelm: | 10 minutes |
| Shelton: | 9 minutes |
| Roy: | 13 minutes |
| Rochester: | 9 minutes |
| Lakewood: | 7 minutes |
 Based on the data from the years 2002 - 2018 the average number of fire-related yearly deaths is 1. The highest number of reported deaths - 3 took place in 2008, and the lowest - 0 in 2005. The data has a decreasing trend.
The average number of fatalities per 1,000 fire incidents is 2. This indicator was the highest - 6 in 2013, and the lowest 0 in 2005. The trend for deaths per 1,000 incidents is dropping. Compared to the Washington value the number of fatalities per 1,000 fire incidents is about the same.
Based on the data from the years 2002 - 2018 the average number of fire-related yearly deaths is 1. The highest number of reported deaths - 3 took place in 2008, and the lowest - 0 in 2005. The data has a decreasing trend.
The average number of fatalities per 1,000 fire incidents is 2. This indicator was the highest - 6 in 2013, and the lowest 0 in 2005. The trend for deaths per 1,000 incidents is dropping. Compared to the Washington value the number of fatalities per 1,000 fire incidents is about the same.
 Based on the data from the years 2002 - 2018 the average number of fire-related casualties per year is 2. The highest number of injuries - 8 took place in 2018, and the lowest - 0 in 2005. The data has a growing trend.
The average number of casualties per 1,000 fires is 4. This indicator was the highest - 12 in 2002, and the lowest 0 in 2005. The trend for injuries per 1,000 fire incidents is declining. Compared to the Washington value the number of injuries per 1,000 fire incidents is lower.
Based on the data from the years 2002 - 2018 the average number of fire-related casualties per year is 2. The highest number of injuries - 8 took place in 2018, and the lowest - 0 in 2005. The data has a growing trend.
The average number of casualties per 1,000 fires is 4. This indicator was the highest - 12 in 2002, and the lowest 0 in 2005. The trend for injuries per 1,000 fire incidents is declining. Compared to the Washington value the number of injuries per 1,000 fire incidents is lower.
 34.5% incidents where reported in the morning and 65.5% in the evening. The most fires (15.1%) took place on Sunday, and the least (13.3%) on Thursday.
 According to the 8,478 fires from years 2002 - 2018 most fires (18.0%) took place during July, and the least (5.6%) in February.
 Out of all 101,186 cases reported during the years 2002 - 2018, the most belonged to the categories: Rescue & EMS (62.8%), Good Intent Call (11.6%), and Fire (8.4%).
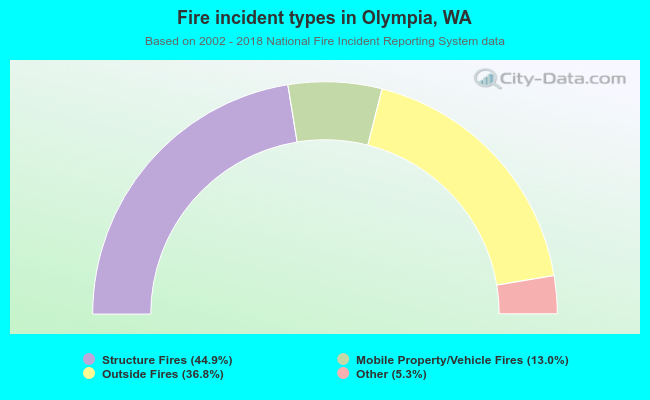 When looking into fire subcategories, the most incidents belonged to: Structure Fires (44.9%), and Outside Fires (36.8%).