Oakland Park: Fire Incidents, Florida (FL)
Where are fire incidents reported in Oakland Park, FL
Something went wrong! Please refresh the page.
| Fire incidents reported | |
|---|---|
| Sreet name | Count |
| OAKLAND PARK | 334 |
| DIXIE HWY | 200 |
| COMMERCIAL BLVD | 160 |
| 38TH ST | 140 |
| I95 | 124 |
| 9TH AVE | 114 |
| 21ST AVE | 110 |
| OAKLAND FOREST DR | 108 |
| ANDREWS AVE | 104 |
| 6TH AVE | 92 |
| 44TH ST | 90 |
| I95 RAMP | 86 |
| 62ND ST | 76 |
| PROSPECT RD | 66 |
| 41ST ST | 64 |
| 33RD ST | 62 |
| 40TH ST | 60 |
| 5TH AVE | 50 |
| 29TH ST | 46 |
| FEDERAL HWY | 44 |
| 43RD ST | 42 |
| 12TH TER | 40 |
| 35TH ST | 40 |
| 39TH ST | 40 |
| 40TH CT | 38 |
| 56TH ST | 38 |
| OAKLAND PARK BLVD | 38 |
| 42ND ST | 36 |
| 16TH AVE | 34 |
| 36TH ST | 34 |
2002 - 2018 National Fire Incident Reporting System (NFIRS) incidents
- Incident types reported to NFIRS in Oakland Park, FL
- 28,20065.9%Rescue & EMS
- 6,91616.2%Good Intent Call
- 2,1925.1%Hazardous Condition
- 1,9404.5%Fire
- 1,8454.3%False Alarm
- 1,6583.9%Service Call
- Fire incident types reported to NFIRS in Oakland Park, FL
- 73237.7%Structure Fires
- 54928.3%Mobile Property/Vehicle Fires
- 52627.1%Outside Fires
- 1336.9%Other
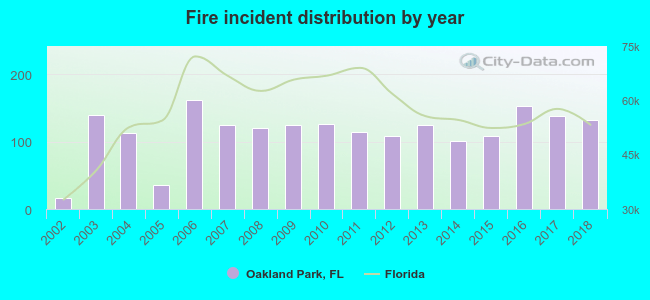 According to the data from the years 2002 - 2018 the average number of fire incidents per year is 114. The highest number of reported fires - 161 took place in 2006, and the least - 17 in 2002. The data has an increasing trend.
The average number of yearly fire incidents per 10k residents in Oakland Park, FL compared to nearest cities:
(Note: Based on data for the last 3 years, including only cities with population 5,000 and above)
| Oakland Park: | 32.1 |
| Wilton Manors: | 22.3 |
| Fort Lauderdale: | 31.2 |
| Lauderdale Lakes: | 22.5 |
| Pompano Beach: | 20.2 |
| Lauderhill: | 24.5 |
| North Lauderdale: | 19.9 |
| Margate: | 17.2 |
| Tamarac: | 11.5 |
 The median response time based on all reported fire incidents is 5 minutes. This is lower compared to the Florida median value.
The median response time in Oakland Park, FL compared to nearest cities:
(Note: Based on data for all years, including only cities with at least 500 fire incidents)
| Oakland Park: | 5 minutes |
| Fort Lauderdale: | 5 minutes |
| Lauderdale Lakes: | 6 minutes |
| Pompano Beach: | 6 minutes |
| Lauderhill: | 6 minutes |
| North Lauderdale: | 5 minutes |
| Margate: | 5 minutes |
| Tamarac: | 6 minutes |
| Coconut Creek: | 6 minutes |
 Based on the data from the years 2002 - 2018 the average number of fire-related yearly deaths is 0. The highest number of reported deaths - 2 took place in 2013, and the lowest - 0 in 2002. The data has a growing trend.
 35.2% incidents where reported in the morning and 64.8% in the evening. The most fires (15.8%) took place on Sunday, and the least (13.0%) on Tuesday.
 According to the 1,940 fire incident reports from years 2002 - 2018 most fires (11.1%) took place during January, and the least (6.3%) in June.
 Out of all 42,784 cases reported during the years 2002 - 2018, the most belonged to the categories: Rescue & EMS (65.9%), Good Intent Call (16.2%), and Hazardous Condition (5.1%).
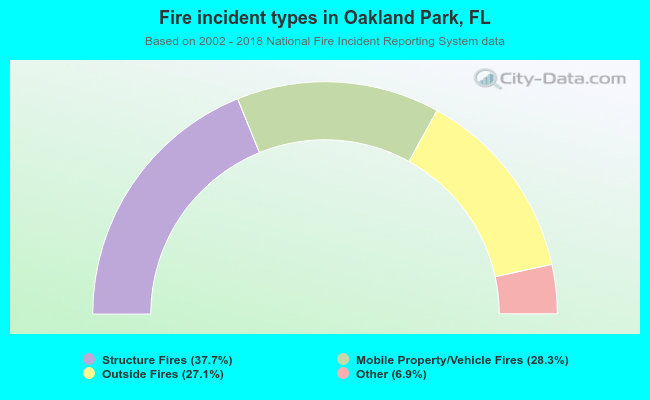 When looking into fire subcategories, the most reports belonged to: Structure Fires (37.7%), and Mobile Property/Vehicle Fires (28.3%).