Pompano Beach: Fire Incidents, Florida (FL)
Where are fire incidents reported in Pompano Beach, FL
Something went wrong! Please refresh the page.
|
| |||||||||||||||||||||||||||||||||||||||||||||||||||||||||||||||||||||||||||||||||||||||||||||||||||||||||||||
2002 - 2018 National Fire Incident Reporting System (NFIRS) incidents
- Incident types reported to NFIRS in Pompano Beach, FL
- 41,00476.9%Rescue & EMS
- 5,79710.9%Good Intent Call
- 2,9135.5%False Alarm
- 1,8243.4%Service Call
- 8761.6%Hazardous Condition
- 7991.5%Fire
- 1170.2%Special Incident
- Fire incident types reported to NFIRS in Pompano Beach, FL
- 36645.8%Structure Fires
- 20225.3%Mobile Property/Vehicle Fires
- 19123.9%Outside Fires
- 405.0%Other
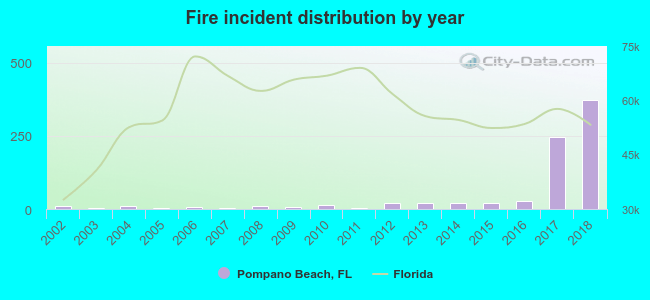 Based on the data from the years 2002 - 2018 the average number of fire incidents per year is 47. The highest number of reported fires - 372 took place in 2018, and the least - 2 in 2005. The data has a rising trend.
The average number of yearly fire incidents per 10k residents in Pompano Beach, FL compared to nearest cities:
(Note: Based on data for the last 3 years, including only cities with population 5,000 and above)
| Pompano Beach: | 20.2 |
| Lighthouse Point: | 22.5 |
| Oakland Park: | 32.1 |
| Coconut Creek: | 13.4 |
| Deerfield Beach: | 20.3 |
| Wilton Manors: | 22.3 |
| Margate: | 17.2 |
| North Lauderdale: | 19.9 |
| Lauderdale Lakes: | 22.5 |
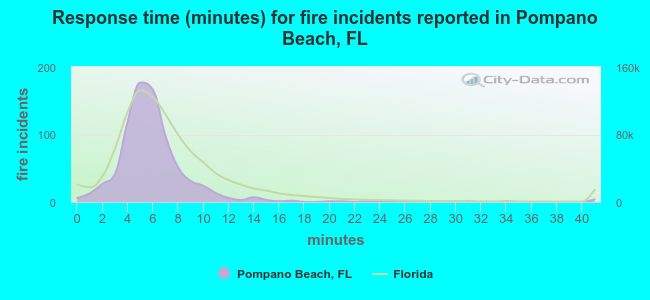 The median response time based on all reported fire incidents is 6 minutes. This is close to the Florida median value.
The median response time in Pompano Beach, FL compared to nearest cities:
(Note: Based on data for all years, including only cities with at least 500 fire incidents)
| Pompano Beach: | 6 minutes |
| Oakland Park: | 5 minutes |
| Coconut Creek: | 6 minutes |
| Deerfield Beach: | 6 minutes |
| Margate: | 5 minutes |
| North Lauderdale: | 5 minutes |
| Lauderdale Lakes: | 6 minutes |
| Fort Lauderdale: | 5 minutes |
| Tamarac: | 6 minutes |
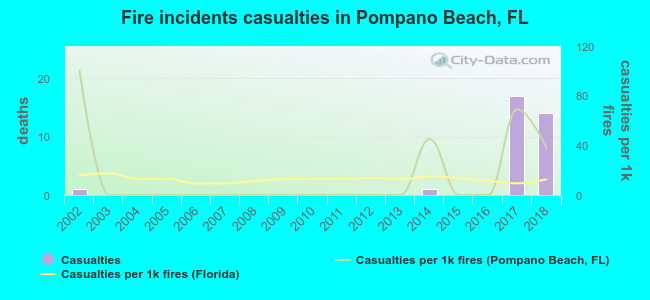 According to the data from the years 2002 - 2018 the average number of fire-related casualties per year is 2. The highest number of reported casualties - 17 took place in 2017, and the lowest - 0 in 2003. The data has an increasing trend.
The average number of injuries per 1,000 fire incidents is 15. This indicator was the highest - 100 in 2002, and the lowest 0 in 2003. The trend for casualties per 1,000 fires is dropping. Compared to the state value the number of injuries per 1,000 fire incidents is much higher.
According to the data from the years 2002 - 2018 the average number of fire-related casualties per year is 2. The highest number of reported casualties - 17 took place in 2017, and the lowest - 0 in 2003. The data has an increasing trend.
The average number of injuries per 1,000 fire incidents is 15. This indicator was the highest - 100 in 2002, and the lowest 0 in 2003. The trend for casualties per 1,000 fires is dropping. Compared to the state value the number of injuries per 1,000 fire incidents is much higher.Casualties per 1,000 incidents in Pompano Beach, FL compared to nearest cities:
(Note: Based on data for all years, including only cities with at least 500 fire incidents)
| Pompano Beach: | 41.3 |
| Oakland Park: | 0.5 |
| Coconut Creek: | 23.3 |
| Deerfield Beach: | 21.5 |
| Margate: | 25.8 |
| North Lauderdale: | 7.7 |
| Lauderdale Lakes: | 31.3 |
| Fort Lauderdale: | 9.8 |
| Tamarac: | 7.1 |
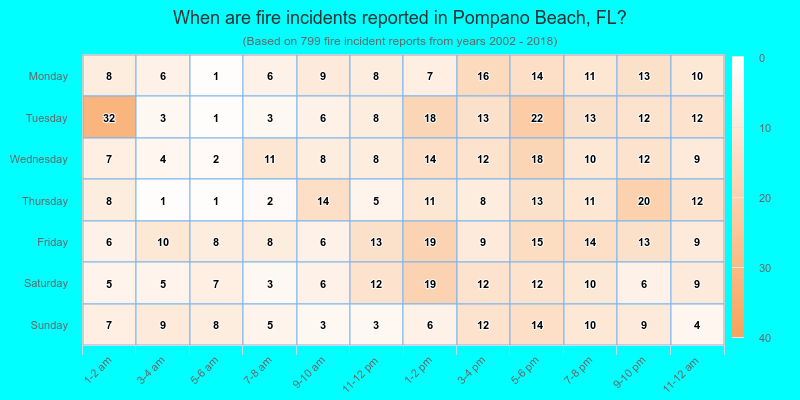
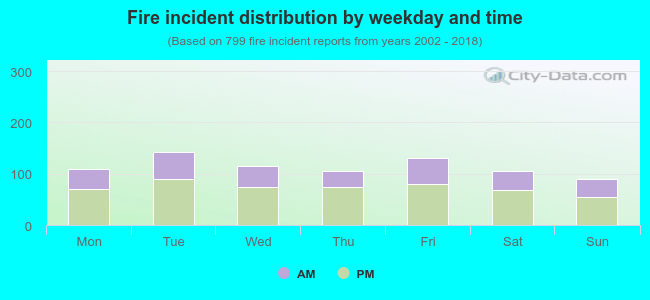 35.8% incidents where reported in the morning and 64.2% in the evening. The most fires (17.9%) took place on Tuesday, and the least (11.3%) on Sunday.
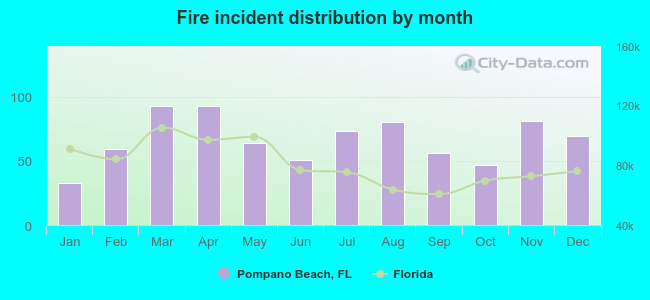 According to the 799 reports from years 2002 - 2018 most fires (11.6%) took place during March, and the least (4.1%) in January.
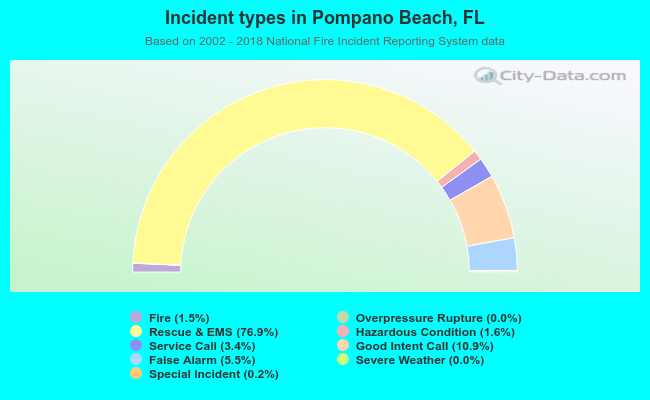 Out of all 53,350 cases reported during the years 2002 - 2018, the most belonged to the categories: Rescue & EMS (76.9%), Good Intent Call (10.9%), and False Alarm (5.5%).
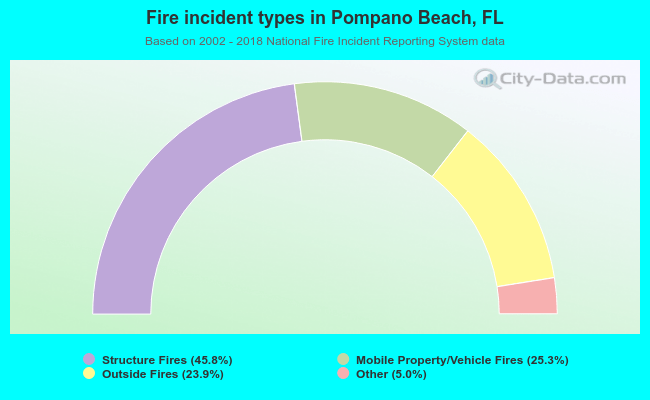 When looking into fire subcategories, the most incidents belonged to: Structure Fires (45.8%), and Mobile Property/Vehicle Fires (25.3%).